Effect of calcination temperature on structure, composition and properties of S2O82−/ZrO2 and its catalytic performance for removal of trace olefins from aromatics
Qing Zhao,
Jiajia Yao,
Li Shi and
Xin Wang*
The State Key Laboratory of Chemical Engineering, East China University of Science and Technology, Shanghai 200237, People's Republic of China. E-mail: wangxin890@ecust.edu.cn
First published on 22nd August 2016
Abstract
A solid superacid catalyst, S2O82−/ZrO2 (S2Z), was synthesized by the immersion-precipitation method to remove olefins from aromatics; the effect of calcination temperature on the structure, chemical and phase composition and properties of persulfated zirconia were studied. A series of synthesized catalyst samples were characterized by TG-DTG, XRD, SEM, FTIR, FTIR pyridine adsorption (py-IR) and N2 adsorption analysis. The characterization results revealed that the outstanding activity for removal trace olefins from aromatics is attributed to the interaction between sulfur species and ZrO2, particularly the more covalent persulfate with tetragonal zirconia (t-ZrO2), and the calcination temperature was shown to be the key factor in governing the phase composition of S2Z. Py-IR analysis indicated that the high catalytic activity was well correlated with excellent acidity, primarily with the Lewis acidity of S2Z. Different calcination temperatures influenced the amount of catalytically active t-ZrO2, which was favorable to increasing the number of acid sites, improving surface properties and thus enhancing the catalytic activity. Moreover, the regeneration procedure did not change the structure and crystal form of the catalyst. The catalytic activity test revealed that S2Z calcined at 650 °C was superiorly active and efficiently reusable to remove trace olefins and exhibits promising application prospects in industry.
Introduction
Benzene, toluene and xylene (BTX) are important industrial organic feedstocks in the petrochemical enterprises, and those aromatic streams contain trace olefins that have adverse effects on subsequent processes and applications of the BTX aromatics.1,2 Clays have been widely adopted, mainly through adsorption, to remove trace olefins from aromatics in the petrochemical industry due to their physical and chemical advantages (i.e. large specific surface and adsorptive affinity for organic and inorganic ions).3 Even though clay treatment has advantages of simple operation and low cost, its limited lifetime and the pollution of discarded clay are severe drawbacks. Compared with clay treatment, catalytic hydrogenation treating has a longer lifetime for the removal of olefins, but hydrogenation may cause a loss of aromatics; furthermore, the requirements of operation conditions for hydrogenation are high, which could increase the equipment investment and the cost of products.4To deal with increasingly stringent environmental regulations and the consequent trend towards eco-friendly process, many studies have been done to develop an efficient alternative to remove trace olefins from aromatics. Especially, through the efforts of our research,5 the mechanism of the reaction for removal of olefins from aromatics was figured out to be an alkylation, of which the reactants were para-xylene and olefins. According to fundamental studies, many kinds of novel and relatively eco-friendly alkylation catalysts, like zeolites,6 ionic liquids7 and solid superacid catalysts,8 have been proposed for use in the purification of aromatics. Specific zeolites, such as USY, are reasonable potential materials that may be prospectively utilized in the petrochemical industry because of its significantly high initial activity. However, unavoidable disadvantages of zeolites include rapid catalyst deactivation and poor regeneration performance.5,9 To date, there still has been no effective modification method to overcome those deficiencies. Ionic liquids are not suitable for industrial processes due to separation problems tied with environmental protection. Consequently, environmental-friendly benign solid super acid catalysts, by incorporating super acidity in solids, have received considerable everlasting interest in recent decades and have been considered as promising green catalysts, especially in the petroleum industry.10–15 Solid superacid catalysts like metal oxides, heteropolyacids and ion-exchange resins have been continually studied and exploited in the chemical industry. Both the excellent strength of acidity and the appropriate distribution of Brønsted and Lewis acid sites are the reasons for catalyzing many kinds of reactions with remarkable activity and selectivity.16,17
As one of the most common solid superacids, ZrO2 modified by high valence sulfur exhibits great application prospects in many reactions of industrial significance, such as alkylation,18,19 isomerization20–22 and esterification,23–25 which are attributed to its exceptional surface acidic properties. However, reports on the synthesis methods of zirconia modified by persulfate, S2O82−/ZrO2, and their applications in alkylation are hardly seen. More recently, we found that S2O82−/ZrO2 showed higher catalytic activity for purification of aromatics. Among zirconium-based catalysts, S2O82−/ZrO2 (S2Z), with abundant S![[double bond, length as m-dash]](https://www.rsc.org/images/entities/char_e001.gif) O covalent bonds, has a great number of acid and base sites that were catalytically active for many acid-catalyzed reactions.
O covalent bonds, has a great number of acid and base sites that were catalytically active for many acid-catalyzed reactions.
According to the advantages of S2Z, it may prospectively overcome the lack of existing catalysts to remove olefins from aromatics in the petrochemical industry. Even though some typical synthesis of S2Z is favored in certain common organic reactions, the challenge of these existing synthesis methods is to confirm how synthesis condition influences the structure, composition and properties of the persulfated zirconia and its effect on the catalytic activity. To achieve better performance of the scale-up product and industrialization of the solid superacids for the purification of aromatics, the main objective of the current work is optimization of the calcination temperature on S2O82−/ZrO2, which is suggested to have a great effect on the final catalytic activity.11,26–28 Structural and acid properties of the catalysts were studied by TG-DTG, XRD, SEM, FTIR, py-IR measurements and N2 adsorption analysis.
Experimental
Materials
Experimental raw materials, with a Bromine Index (BI) of 1068 mg Br/(100 g), were obtained from PX combination units at Sinopec Zhenhai Refining & Chemical Company. The main components of aromatic materials with a bromine index about 1100 mg Br/(100 g) are C8–C10 hydrocarbons. All other starting materials were analytically pure (AR) and commercially obtained from Sinopharm Chemical Reagent Co., Ltd; they were used without any further purification.Catalyst preparation
Highly amorphous zirconium hydroxide was synthesized by adding ammonium hydroxide solution (25–28%) dropwise to zirconium oxychloride (ZrOCl2·8H2O) solution while vigorously stirring. After aging at room temperature for 12 h, the suspension was filtered, subsequently washed to completely eliminate chloride ions and forced-air dried at 120 °C for 24 h. Then, dried zirconium hydroxide (Zr(OH)4) was persulfated by impregnating in ammonium persulphate solution for 1 h. After that, the persulfated precursor was filtered, followed by forced-air drying for 12 h and activated at various temperatures for 3 h. The synthesized catalysts were denoted as S2Zx. Correspondingly, S2Zx (x = 500–700) signifies S2Z calcined at a specified temperature (°C); for convenience, the dried persulfated zirconia without calcination was designated S2Z120 in the same way as above. For comparison, dried zirconium hydroxide was also calcined at 650 °C to synthesize pure ZrO2.Catalytic activity evaluation
The catalytic evaluation tests were carried out in a laboratory fixed-bed reactor at a liquid hourly space velocity (LHSV) of 30 h−1 and a pressure of 1.0 MPa. The constant temperature zone of the reaction tube was charged with 2 milliliters of catalyst in the intermediate position and other spaces loaded with 1.5 milliliters of quartz sand particles (20–40 mesh). During the activity test, raw materials flowed into the reactor from the top with an advection pump, and products were collected per hour out from the bottom of the reactor. Then, the Bromine Index (BI) of the feedstock and products were analyzed using a BI Analyzer. The bromine index, the number of milligrams of elemental bromine reacting with 100 g of hydrocarbon sample, was an accepted indicator of olefin content. The olefin removal rate X% was calculated using the following equation:| X = [(n0 − ni)/n0] × 100, |
Characterization of catalyst
TG-DTG was carried out with an ISOSDRP MP thermogravimetric analyzer. The samples were heated from ambient temperature to 900 °C with a heating rate of 10° min−1 in an air stream (40 mL min−1). Powder X-ray diffraction (XRD) patterns of the catalysts were obtained on a D8 Advance polycrystalline diffractometer apparatus with Cu Kα radiation under 100 mA current and 40 kV voltage in the 2θ range of 10–80° with a scan rate of 1° min−1. SEM morphological analysis was performed on a JSM-6360LV scanning electron microscope operating at an accelerating voltage of 30 kV. The catalyst samples were pretreated by drying at room temperature and coating with gold. The operation was under vacuum conditions in an ionization chamber protected by argon atmosphere to improve surface conductivity.The surface acidity was examined by FTIR spectroscopy in which pyridine acts as a molecular probe. Sample wafers (about 16.7 mg) loaded into an in situ cell were pretreated for deep dehydration at a temperature of 380 °C under high vacuum conditions (less than 0.1 Pa) followed by pyridine adsorption while cooling down to 80 °C. Finally, the pyridine adsorbed onto the wafers was respectively desorbed at 200 °C and 450 °C. FTIR spectra were recorded using an FTIR (Nicolet-6700) spectrometer (4000–400 cm−1). The specific pore volume and surface area were analyzed by N2 adsorption–desorption at −196 °C (ASAP 2010N, Micromeritics, America).
Results and discussion
Thermal stability analysis
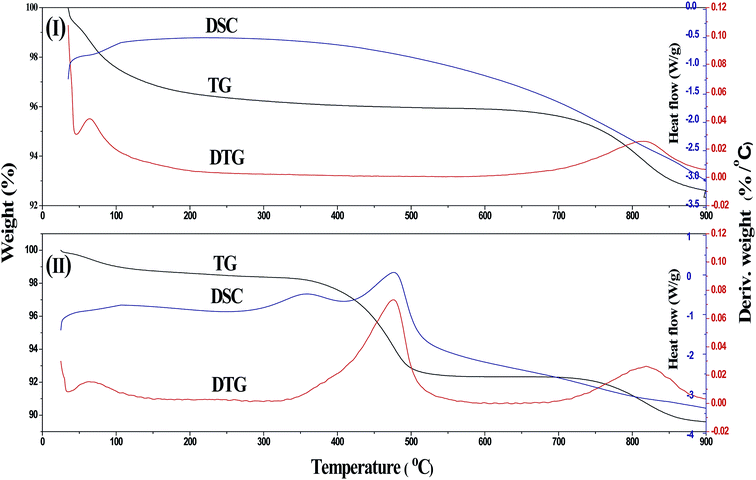
The weight loss experiments by DSC/DSG analysis over dried S2Z is presented in Fig. 1I. The first broad peak in the DTG curve at about 200 °C was ascribed to the elimination of water adsorbed onto the surface. A sharper weight loss peak from 650 °C to 900 °C indicated that persulfate began to decompose at 650 °C. The inappreciable weight loss at approximately 650 °C might be responsible for removing some unstable persulfate groups and thus anchoring newly formed and more covalent persulfates onto the surface of zirconia. However, the weight loss rate began to accelerate at higher temperatures over 700 °C, exhibiting excellent thermostability of sulfur species on S2Z. As reported by Jiang et al.,29 the thermostability, characterizing the bond strength of the persulfate group with tetragonal ZrO2, was well related to the acidity as well as activity. Therefore, the DTG results gave us a valid indication that the optimum calcination temperature of S2Z sample is not above 650 °C. To decrease the effect of persulfate decomposition on the catalysts, the highest calcination temperature in this work was set at 700 °C.The thermal analysis result of coked S2Z is also plotted in Fig. 1II. A significantly distinct weight loss was observed in the temperature ranging from 330 °C to 550 °C and was assigned to the combustion of deposited coke. This result could also be well demonstrated by the corresponding two exothermic peaks illustrated in the DSC curve. There were two endothermic peaks in the DSC curve, and the former one from 330–410 °C corresponded to a kind of young coke of low molecular weight, while the other one from 410–500 °C was caused by composition of older coke in the structure of the catalysts.30 The broad DTG peaks from 700 °C and 900 °C belonged to the thermal decomposition of persulfate. Regeneration temperature is a key factor in reusability, which can be considered an important indicator in industrial catalysts.31 In order to keep a balance between the deep removal of coke and the structural integrity of S2Z, the regeneration temperature was set at 550 °C.
Morphology and crystallization analysis (XRD & SEM)
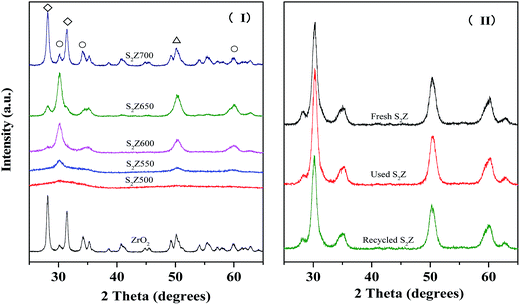
The XRD patterns of unmodified ZrO2 and S2Z activated at different temperatures (500–700 °C) are given in Fig. 2I. For these samples, a series of sharp diffraction peaks occurred at 2θ = 28.23°, 30.20°, 31.45°, 34.27°, 50.14° and 60.11°, indicating that ZrO2 exhibited a mixture of monoclinic (2θ = 28.23°, 31.46°) and tetragonal (2θ = 30.38°, 34.48°, 50.37°, 60.05°) phases.32,33 The pure ZrO2 (Fig. 2I) exhibited more thermodynamically stable monoclinic phase with larger crystallites, while S2Z650 exhibited more impeccable tetragonal phase,34,35 which revealed that the incorporated persulfate-ions could effectively retard the formation of larger crystallites and stabilize the metastable tetragonal ZrO2 at ambient conditions. It could be observed that the incorporation of persulfate ions increased the proportion of the tetragonal phase, which is considerable, for achieving superior catalytic activity.36–38It could also be suggested that the calcination temperature had enormous implications for the bulk properties of S2Z (Fig. 2I). S2Z500 still exhibited poor crystallinity with broad diffraction peaks for the tetragonal phases. Actually, it is more accurate to describe it as an amorphous intermediate towards a tetragonal crystal system. The peak intensities of all crystalline phases grew steadily with the increase of calcination temperature from 500 °C to 650 °C.39,40 However, the tetragonal phase was still deficiently crystallized for S2Z600. It could be seen that S2Z650 possessed the maximum amount of tetragonal phase, illustrating that the tetragonal ZrO2 within persulfated zirconia calcined at 650 °C was more stable than the rest. With further calcination up to 700 °C, the tetragonal phase disappeared obviously, which led to the formation of more monoclinic ZrO2. Meanwhile, the presence of new diffraction peaks could be attributed to the thermolysis of persulfate. The high similarity between patterns of S2Z700 and pure ZrO2 indicated that a large proportion of sulfate groups or persulfate ions had decomposed at this temperature,41 and further increases in the calcination temperature led to instability of the tetragonal zirconia phase. It could be concluded that the phase transition of both crystal phases (content of metastable tetragonal and stable monoclinic zirconia) is dependent on calcination temperature, and 650 °C is the optimal calcination temperature for S2Z to obtain superb catalytic activity.
In order to explore the stability of the crystal phase after successive use, the XRD patterns of fresh, used and recycled S2Z catalysts were recorded and the results are given in Fig. 2II. Obviously, the three patterns were fairly similar, because the reaction and regeneration procedure did not change the structure of the catalyst and the carbon deposits were dispersed amorphously on the surface. The stable bulk properties were responsible for the efficient reusability of S2Z.
SEM micrographs of different samples are reported in Fig. 3. The image of unmodified ZrO2 (Fig. 3I) showed a large irregular agglomerated surface.42 S2Z120 (Fig. 3II) containing glass-like particles and was in a relatively dispersive state. SEM image of Fig. 3III obviously showed the alternation and porosity of the surface after persulfation, which was due to the presence of highly charged species, i.e. S2O82− ions. Meanwhile, the particles were tightly aggregated to each other, and no cracks and other obvious defects were observed in the surface of the samples. According to Fig. 3II and III, the surface structure of S2Z120 was uneven and disordered, while that of S2Z650 was porous and uniform, and it has such a porous surface structure that makes it quite active,43 indicating that calcination shows a strong influence on the phase modification.
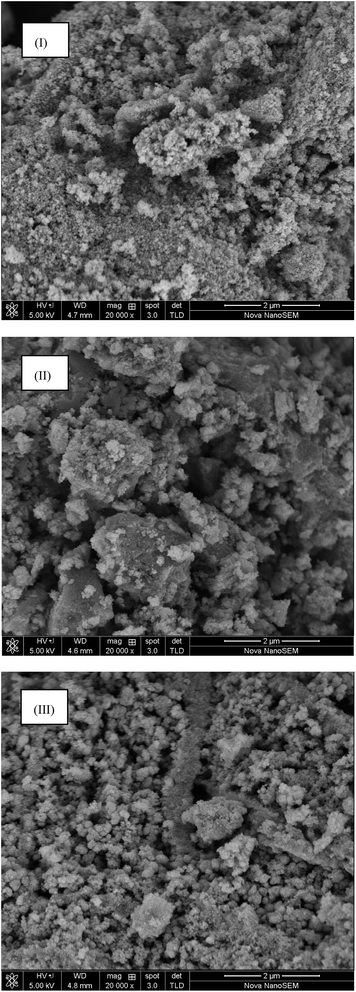 | ||
| Fig. 3 SEM images of unmodified and persulfate-modified zirconia samples: (I) pure ZrO2, (II) S2Z120 and (III) S2Z650. | ||
Chemical properties analysis
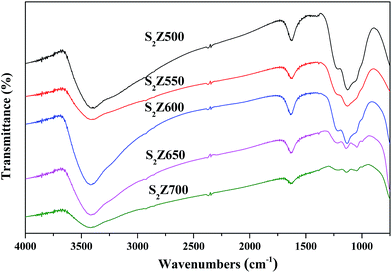
The FTIR spectroscopy of S2Z (KBr disc) with different calcination temperatures was recorded and the results are displayed in Fig. 4. There is a sharp peak in the wavenumber of 1629 cm−1 due to stretching vibrations of the persulfate hydroxyl group. Another hydroxyl stretching vibration that appears at around 3407 cm−1 is attributed to the effect of water associated with ZrO2. The band at 991 cm−1 corresponds to the symmetric O–S–O stretching mode of bidentate sulfate ion coordinated to Zr4+ ion. The bands observed at 1044 cm−1, 1136 cm−1 and 1221 cm−1 are assigned to the antisymmetric O![[double bond, length as m-dash]](https://www.rsc.org/images/entities/char_e001.gif) S
S![[double bond, length as m-dash]](https://www.rsc.org/images/entities/char_e001.gif) O stretching frequency of persulfate ion bonded to the surface of ZrO2 under the dehydrated conditions.44 These bands above are present in the spectra of all catalysts, although in different intensities depending on the calcination temperature.
O stretching frequency of persulfate ion bonded to the surface of ZrO2 under the dehydrated conditions.44 These bands above are present in the spectra of all catalysts, although in different intensities depending on the calcination temperature.
Fig. 4 showed that the calcination temperature exerted a great influence on the chemical properties of S2Z. When calcination temperatures were lower than 650 °C, the spectrum exhibited the appearance of a dominant shoulder peak at around 1136 cm−1. This result revealed that persulfate ions on ZrO2 were still in a chelating bidentate structure. When S2Z was calcined at 650 °C, the existence of bands with similar sizes at 991, 1044, 1136 and 1221 cm−1 indicated that the bidentate persulfate ion had been successfully coordinated to the surface of ZrO2 and inside the pores of zirconia.44 At higher calcination temperatures, the S![[double bond, length as m-dash]](https://www.rsc.org/images/entities/char_e001.gif) O stretching vibration decreased to lower values, illustrating that more covalent persulfate in nature was available.44,45 As investigated by Vishwanathan et al.,36 the presence of highly asymmetric vibrational mode of more covalent persulfate played a vital role in the outstanding acidity of the catalyst. However, when S2Z was further calcined at 700 °C, the intensities of these peaks decreased. It could be implied that decomposition of the persulfate ion has taken place, which was in conformity with XRD analysis and DSC data described. S2Z is a superacid due to the electron-accepting ability for the Zr atoms (Lewis acid) by offering the suction-induced complex O
O stretching vibration decreased to lower values, illustrating that more covalent persulfate in nature was available.44,45 As investigated by Vishwanathan et al.,36 the presence of highly asymmetric vibrational mode of more covalent persulfate played a vital role in the outstanding acidity of the catalyst. However, when S2Z was further calcined at 700 °C, the intensities of these peaks decreased. It could be implied that decomposition of the persulfate ion has taken place, which was in conformity with XRD analysis and DSC data described. S2Z is a superacid due to the electron-accepting ability for the Zr atoms (Lewis acid) by offering the suction-induced complex O![[double bond, length as m-dash]](https://www.rsc.org/images/entities/char_e001.gif) S
S![[double bond, length as m-dash]](https://www.rsc.org/images/entities/char_e001.gif) O, thus it is necessary to study the surface acidity of the catalysts.
O, thus it is necessary to study the surface acidity of the catalysts.
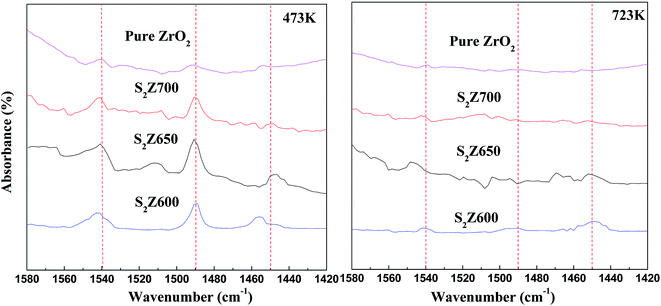
Though an infrared spectrometer was used to study the molecular structure and chemical bonds, FTIR spectra cannot reflect acid type and amount of the catalysts. Therefore, pyridine-FTIR spectroscopy (Fig. 5) of unmodified ZrO2 and S2Z samples calcined at different temperatures was investigated and the characteristic peaks were recorded in the 1580–1420 cm−1 region. IR adsorption bands observed at around 1450 cm−1 are attributed to a pyridine molecule interacting with Lewis (L) acid sites on the surface; bands at approximately 1540 cm−1 are characteristic of a pyridine molecule coordinated to Brønsted (B) acid sites.46 Another strong band located at 1490 cm−1 is normally assigned to the combination of pyridine adsorbed on both B and L acidic centers. The acid amount, calculated by the peak area desorbed at 200 °C, is the total acid, and the acid amount calculated by the peak area desorbed at 450 °C is the amount of strong acid. Accordingly, the difference value is the amount of weak acid.47 From measurement of retained pyridine at 200 °C along with 450 °C, the total and strong acidity can be calculated, respectively.48
The quantitative analysis (Table 1) was carried out by the Lambert–Beer law:
| A = ξ × C × t, |
| Samples | T | TB | TL | SB | SL | WB | WL |
|---|---|---|---|---|---|---|---|
| Pure ZrO2 | 1.206 | 1.152 | 0.054 | 0.600 | 0.054 | 0.552 | 0 |
| S2Z600 | 6.456 | 4.224 | 2.232 | 0.864 | 2.07 | 3.36 | 0.162 |
| S2Z650 | 8.436 | 5.664 | 2.772 | 1.601 | 1.228 | 4.063 | 1.544 |
| S2Z700 | 4.230 | 3.960 | 0.270 | 0.591 | 0.097 | 3.369 | 0.173 |
Pure ZrO2 only contained a small number of Lewis acid sites, exhibiting poor acidity, which led to its low catalytic activity. S2Z650 showed the existence of abundant Lewis, together with Brønsted, acid sites, which implied generation of Brønsted acidity as well as an increase of Lewis acidity during the persulfation treatment, and similar types of strong acid strengths were reported for sulfated zirconia by Yao et al.8 The reason for S2Z650 containing the highest amount of acid sites was that the moderate calcination temperature of 650 °C led to the formation of more tetragonal ZrO2 that facilitated ZrO2 to bear more acidic OH groups and base (O2−) sites, rendering the catalyst more accessible to pyridine molecules. As suggested by Pu et al.,6 the enrichment of Lewis acid sites in the catalysts could play a promotional effect on the catalytic activity and stability in the purification of aromatics. Particularly in this work, S2Z650 exhibited a great Lewis acid amount, which was particularly devoted to their better activity for acid-catalytic purification of aromatics. Compared to S2Z650, the relatively lower acidity, especially Lewis acidity of S2Z600, was due to insufficient calcination at 600 °C. With further calcination at 700 °C, the acidity decreased obviously, which was ascribed to thermal decomposition of persulfate accompanied with poor tetragonal crystallization. Combined with FTIR analysis, it could be found that the surface acidity was well correlated with calcination temperature.
BET surface area & pore size analysis
The pore size distribution (BJH model) curves of samples under different synthesis conditions are displayed in Fig. 6. As evidenced on Fig. 6I, two pore types were observed for Zr(OH)4, and their average pore diameter were centered at around 2.22 nm and 3.21 nm, respectively. After doping with S2O82− and insufficient calcination, the two pore types shifted to a slightly larger pore diameter, indicating the porosity decreased. It also could be observed that the calcination temperature had great effects on the pore size distribution of S2Z. The pore diameter as well as pore volume tended to increase with increasing calcination temperature from 500 °C to 600 °C, and this shift could be explained by the presence of closed porosity during the calcination process. It was easy to find that there was a strong peak at around 4.36 nm after calcination at 650 °C, and the increase of pore volume demonstrated that the closed porosity was opened, which was very helpful to the following purification process. However, the pore size of S2Z650 was inferior to that of S2Z600 and S2Z700. This was because deficient calcinations made S2Z possess a small amount of the tetragonal phase, while additional calcinations transformed the smaller tetragonal phase to a monoclinic phase. With further calcination at 700 °C, the ordered mesoporosity began to disappear and accordingly, S2Z700 exhibited a relatively wider pore size distribution. This fact seemed to be in a good accordance with the XRD results that additional calcinations led to instability of the tetragonal zirconia phase, thus the decrease of catalytic activity.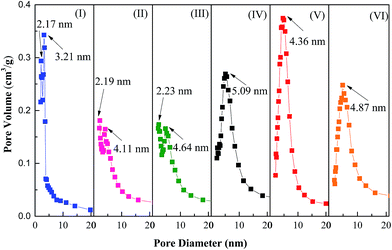 | ||
| Fig. 6 Pore size distribution of samples calcined at different temperatures: (I) zirconium hydroxide precursor, (II) S2Z500, (III) S2Z550, (IV) S2Z600, (V) S2Z650 and (VI) S2Z700. | ||
In order to study the influence of deactivation and regeneration on S2Z catalyst texture, N2 adsorption of fresh, used and recycled catalysts were studied and the results are shown in Fig. 7. Isotherms of the samples were type IV due to the presence of mesopores with the capillary condensation of liquid nitrogen on its surface. It could be found that fresh, used and recycled catalysts showed a similar hysteresis loop, indicating deactivation and regeneration did not greatly affect the form of the isotherms (Fig. 7I) of S2Z. This was because coke was uniformly dispersed on the S2Z surface, which had a high accordance with the XRD analysis. It is well known that special relative pressure (P/P0) is an indicator for qualitatively comparing the pore dimensions and that a higher value reveals a mesopore size. Accordingly, the peak of pore size distribution (Fig. 7II) for used S2Z became weaker and shifted to a lower value, which might be attributed to pore blockage by coke. These results could also be well explained by the data that the surface area of S2Z decreased sharply from 109.751 m2 g−1 to 78.477 m2 g−1, pore volume from 0.396 to 0.136 cm3 g−1 and average pore diameter from 14.425 nm to 6.954 nm after three catalytic uses. However, their surface area and pore diameter of recycled S2Z was restored after regeneration, though these textural parameters were slightly below that of fresh catalyst. The conclusions were in agreement with XRD analysis that the regeneration procedure did not change the structure of the catalyst, and the trivial decrease tendency was due to the blockage of some fine pores31,32 during the reaction and regeneration.
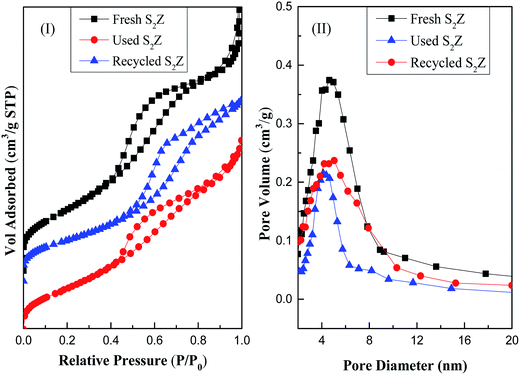 | ||
Fig. 7 N2 adsorption–desorption isotherms (I) and pore size distribution curves (II) of fresh, used and recycled S2Z catalysts. ( ) Fresh S2Z; ( ) Fresh S2Z; ( ) used S2Z; ( ) used S2Z; ( ) recycled S2Z. ) recycled S2Z. | ||
Effect of calcination temperature on catalytic activity of S2Z for aromatic refining
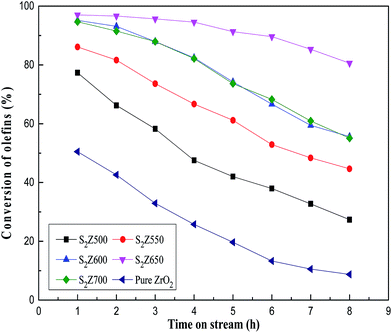
The catalytic activity of S2Z calcined at different temperatures was tested for the catalytic conversion of aromatics purification and results are presented in Fig. 8. It could be seen that the conversion of olefins over pure ZrO2 was far lower than expected. As for persulfated ZrO2, the variations in catalytic performance for olefin conversion were comparatively correlated with the increase of calcination temperature. As the increase of calcination temperature can improve the content of tetragonal ZrO2, persulfated zirconia showed an increase in olefin conversion with increasing calcination temperature and reached the best calcination temperature at 650 °C, beyond which the conversion decreased. Nevertheless, an excessive calcination could transform the partial tetragonal phase to a monoclinic phase, which led to the decrease of super acidity and catalytic activity. It was evident to note that practically all olefins were catalytically removed at 650 °C after operation for 8 h of time-on-stream (TOS). Olefin removal is an acid-catalyzed reaction, thus the superior catalytic activity of S2Z650 to others was attributed to larger acid amounts, especially L acid (Table 1). Combining with the above data, we could conclude that calcination temperature was well connected with phase transition and acid sites, and appropriate adjustment of phase as well as acid sites of S2Z materials could accelerate the reaction rate.Reusability of S2Z
It is of great significance to prepare a catalyst with good recyclability, so the recycling performance of S2Z was investigated and the results are shown in Fig. 9. The recycling experiments were carried out for olefin removal under the identical reaction conditions. After the reaction was finished, the catalyst was regenerated by calculation at 550 °C for 3 h under air flow. The symbol S2Z-Rz (z = 1, 2, 3) denotes the reused cycles of deactivated S2Z. It was clearly seen that the initial olefins conversion of the recycled catalysts were nearly as high as that of fresh S2Z. Remarkably, the conversion of olefins remained beyond 90% for at least 5 h of TOS after the third cycle, although the efficiency decreased during these successive runs. This decrease tendency was due to the deactivation of some active acid sites and the blockage of some pores. From the results, we could conclude that the S2Z650 catalyst was refreshable with a slight loss in its catalytic activity, and the regeneration temperature at 550 °C was very suitable, which was consistent with DSC analysis.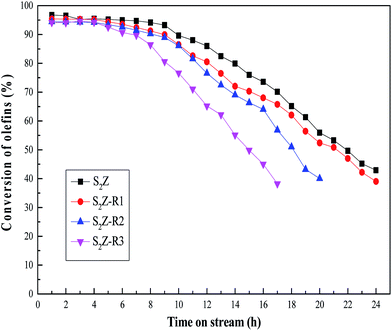 | ||
| Fig. 9 Recycling performance for the S2Z-catalyzed purification of aromatics with reaction temperature at 200 °C. | ||
Comparison of catalytic activity of S2Z and commercial clay
The catalytic performance of S2Z650 and commercial clay with optimal reaction temperature for removal of olefins from aromatics is shown in Fig. 10. It demonstrated that S2Z showed great superiority over the commercial clay. The initial conversion of olefins catalyzed by commercial clay was considerable, but the rapid inactivation rate substantially limited its service life.8 More seriously, the deactivated clay is not able to be regenerated. By comparison with commercial clay, olefins of S2Z were catalytically converted almost completely over a long usage time and the conversion of olefins remained as appreciable as 90% even after 12 hours later. The above comparison indicated that recyclable eco-friendly S2Z650 can be considered as a promising and superior alternative material to commercial clays for the purification of aromatics.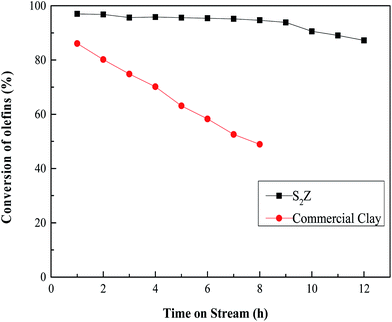 | ||
| Fig. 10 Olefin conversion over commercial clay with reaction temperature at 175 °C and S2Z650 with reaction temperature at 200 °C. | ||
Conclusions
The characterizations using XRD, SEM, FTIR, TG-DTG, BET and py-IR revealed that calcination temperature was a vital influencing factor affecting the structural properties as well as the corresponding catalytic behaviors of the material. Moreover, the optimal calcination temperature of S2Z was 650 °C, and S2Z650 catalyst was able to be reused for four times with only a slight loss in its catalytic activity. The results of py-IR showed that the existence of tetragonal phases, interconnected closely with calcination temperature, were important factors contributing to the formation of considerable super acidity in the catalyst, which worked for the high catalytic activity of aromatics purification. Compared with commercial catalysts, the high catalytic activity as well as efficient reusability of S2Z650 showed vast prospective development of superior and pollution-free processes in industry.References
- S. H. Brown, T. K. Chaudhuri and J. G. Santiesteban. US Pat. 66500996, 2002, vol. 6, p. 500.
- S. H. Brown, J. R. Waldecker and M. Lourvanij. US Pat., 7744750, 2005, vol. 7, p. 744.
- G. L. Li, J. N. Luan, X. S. Zeng and L. Shi, Ind. Eng. Chem. Res., 2011, 50, 6646–6649 CrossRef CAS.
- C. Chen, W. Wu, X. Zeng, Z. Jiang and L. Shi, Ind. Eng. Chem. Res., 2009, 48, 10359–10363 CrossRef CAS.
- N. Liu, X. Pu, X. Wang and L. Shi, J. Ind. Eng. Chem., 2014, 20, 2848–2857 CrossRef CAS.
- X. Pu, N. Liu and L. Shi, Microporous Mesoporous Mater., 2014, 201, 17–23 CrossRef.
- Y. Tian, X. Meng and L. Shi, Ind. Eng. Chem. Res., 2013, 52, 6655–6661 CrossRef CAS.
- J. Yao, N. Liu, L. Shi and X. Wang, Catal. Commun., 2015, 66, 126–129 CrossRef CAS.
- N. Liu, X. Pu and L. Shi, Chem. Eng. Sci., 2014, 119, 114–123 CrossRef CAS.
- T. Taniike, P. Chammingkwan, V. Q. Thang, T. Funako and M. Terano, Appl. Catal., A, 2012, 437, 24–27 CrossRef.
- B. M. Reddy and M. K. Patil, Chem. Rev., 2009, 109, 2185–2208 CrossRef CAS PubMed.
- M. Wu, J. Ni, Z. Yang, C. Li, C. Bu and Y. Sun, Chem. Eng. Technol., 2010, 33, 2044–2050 CrossRef CAS.
- X. Cui, H. Ma, B. Wang and H. Chen, J. Hazard. Mater., 2007, 147, 800–805 CrossRef CAS PubMed.
- H. Lia, H. Song, L. Chen and C. Xia, Appl. Catal., B, 2005, 165, 466–476 CrossRef.
- M. Y. Smirnova, A. V. Toktarev, A. B. Ayupov and G. V. Echevsky, Catal. Today, 2010, 152, 17–23 CrossRef CAS.
- V. Quaschning, J. Deutsch, P. Druska, H. J. Niclas and E. Kemnitz, J. Catal., 1998, 177, 164–174 CrossRef CAS.
- J. R. Sohn, J. G. Kim, T. D. Kwon and E. H. Park, Langmuir, 2002, 18, 1666–1673 CrossRef CAS.
- C. Guo, S. Yao, J. Cao and Z. Qian, Appl. Catal., A, 1994, 107, 229–238 CrossRef CAS.
- G. D. Yadav and G. S. Pathre, J. Mol. Catal. A: Chem., 2006, 243, 77–84 CrossRef CAS.
- N. Essayem, Y. Ben Taârit, C. Feche, P. Y. Gayraud, G. Sapaly and C. Naccache, J. Catal., 2003, 219, 97–106 CrossRef CAS.
- G. A. Urzhuntsev, E. V. Ovchinnikova, V. A. Chumachenko, S. A. Yashnik, V. I. Zaikovsky and G. V. Echevsky, Chem. Eng. J., 2014, 238, 148–156 CrossRef CAS.
- G. G. Volkova, S. I. Reshetnikov, L. N. Shkuratova, A. A. Budneva and E. A. Paukshtis, Chem. Eng. J., 2007, 134, 106–110 CrossRef CAS.
- G. D. Yadav and A. R. Yadav, Chem. Eng. J., 2012, 192, 146–155 CrossRef CAS.
- S. Ardizzone, C. L. Bianchi, G. Cappelletti and F. Porta, J. Catal., 2004, 227, 470–478 CrossRef CAS.
- T. S. Thorat, V. M. Yadav and G. D. Yadav, Appl. Catal., A, 1992, 90, 73–96 CrossRef CAS.
- A. Corma, V. Fornés, M. I. Juan-Rajadell and J. M. López Nieto, Appl. Catal., A, 1994, 116, 151–163 CrossRef CAS.
- T. Tatsumi, H. Matsuhashi and K. Arata, Bull. Chem. Soc. Jpn., 1996, 69, 1191–1994 CrossRef CAS.
- X. Song and A. Sayari, Catal. Rev.: Sci. Eng., 1996, 38, 329–412 CAS.
- K. Jiang, D. Tong, J. Tang, R. Song and C. Hu, Appl. Catal., A, 2010, 389, 46–51 CrossRef CAS.
- L. Jiang, H. Li, Y. Wang, W. Ma and Q. Zhong, Catal. Commun., 2015, 64, 22–26 CrossRef CAS.
- M. S. Khayoon and B. H. Hameed, Bioresour. Technol., 2012, 102, 9229–9235 CrossRef PubMed.
- I. D. Rodriguez, C. Adriany and E. M. Gaigneaux, Catal. Today, 2011, 167, 56–63 CrossRef.
- P. Manivasakan, V. Rajendran, P. P. Rauta, B. B. Sahu and B. K. Panda, J. Am. Ceram. Soc., 2011, 94, 1410–1420 CrossRef CAS.
- G. Fan, M. Shen, Z. Zhang and F. Jia, J. Rare Earths, 2009, 27, 437–442 CrossRef.
- C. M. Garcia, S. Teixeira, L. L. Marciniuk and U. Schuchardt, Bioresour. Technol., 2008, 99, 6608–6613 CrossRef CAS PubMed.
- V. Vishwanathan, G. Balakrishna, B. Rajesh, V. Jayasri, L. M. Sikhwivhilu and N. J. Coville, Catal. Commun., 2008, 9, 2422–2427 CrossRef CAS.
- Y. Sun, S. Ma, Y. Du, L. Yuan, S. Wang, J. Yang, F. Deng and F. Xiao, J. Phys. Chem. B, 2005, 109, 2567–2572 CrossRef CAS PubMed.
- F. H. Alhassan, U. Rashid, M. S. Al-Qubaisi, A. Rasedee and Y. H. Taufiq-Yap, Powder Technol., 2014, 253, 809–813 CrossRef CAS.
- Y. Huang, J. M. Timonthy and M. S. Wolfgang, Appl. Catal., A, 1996, 148, 135–154 CrossRef CAS.
- A. D'Epifanio, M. A. Navarra, F. C. Weise, B. Mecheri, J. Farrington, S. Licoccia and S. Greenbaum, Chem. Mater., 2009, 22, 813–821 CrossRef PubMed.
- H. Wang, G. Shi, F. Yu and R. Li, Fuel Process. Technol., 2016, 145, 9–13 CrossRef CAS.
- A. Patel, V. Brahmkhatri and N. Singh, Renewable Energy, 2013, 51, 227–233 CrossRef CAS.
- A. K. Aboul-Gheit, F. K. Gad, G. M. Abdel-Aleem, D. S. El-Desoukia, S. M. Abdel-Hamid, S. A. Ghoneim and A. H. Ibrahim, Egypt. J. Pet., 2014, 23, 303–314 CrossRef.
- Z. Wang, H. Shui, D. Zhang and J. Gao, Fuel, 2007, 86, 835–842 CrossRef CAS.
- M. Signoretto, F. Pinna, G. Strukul, P. Chies, G. Cerrato and S. D. Ciero, J. Catal., 1997, 167, 522–532 CrossRef CAS.
- V. Hoang, Q. Huang and A. Ungureanu, Microporous Mesoporous Mater., 2006, 92, 117–128 CrossRef CAS.
- J. Luan, G. Li and L. Shi, Ind. Eng. Chem. Res., 2011, 50, 7150–7154 CrossRef CAS.
- J. W. Ward, J. Catal., 1969, 14(4), 365–378 CrossRef CAS.
- C. A. Emeis, J. Catal., 1993, 141, 347–354 CrossRef CAS.
| This journal is © The Royal Society of Chemistry 2016 |

