Electrochemical exfoliation of graphene sheets from a natural graphite flask in the presence of sulfate ions at different temperatures
Chien-Te Hsieh* and
Jen-Hao Hsueh
Department of Chemical Engineering and Materials Science, Yuan Ze University, Taoyuan 32003, Taiwan. E-mail: cthsieh@saturn.yzu.edu.tw; Fax: +886-3-4559373; Tel: +886-3-4638800 ext. 2577
First published on 4th July 2016
Abstract
An electrochemical route to functionalize graphene nanosheets (GNs) directly from a natural graphite electrode is described herein in the presence of sulfate ions under constant-voltage (CV) and constant-current (CC) models at a temperature range of 300–333 K. This electrochemical exfoliation process is more effective than chemical exfoliation processes and also provides a means of producing low-defect and high-yield GN products. The influence of exfoliation temperature on the quality of the as-prepared GN products is systematically investigated. To clarify this effect, one mechanism, consisting of (i) ionic intercalation, (ii) anion insertion and polarization, (iii) water electrolysis and SO2 evolution, and (iv) bubble expansion, is proposed. The interlayer distance, defect concentration, and growth rate of GNs are found to be an increasing function of exfoliation temperature. More than 1.8 g of GNs is produced in less than 1 h by the CC operation in a 250 ml reactor. The growth rate of GNs under the CC model is approximately five times higher than that under the CV one at a fixed temperature. Based on the analysis of Arrhenius plots, the apparent activation energies through the CV and CC models are 20.6 and 23.1 kJ mol−1, respectively. Hence, this exfoliation method using the CC model displays a potentially scalable approach for generating high-quality GN products.
Introduction
Graphene is a rapidly emerging field of research that covers diverse areas of technology including transparent conducting films,1 catalyst supports,2,3 lithium-ion batteries,4,5 solar cells,6,7 electrochemical capacitors,8 and so on. Researchers have been attempting to develop methods for fabricating GN products on large scales since the isolation of graphene nanosheets (GNs) by the “Scotch tape” method.9,10 Thus far, well-studied GN fabrication methods include chemical oxidation of graphite powders (e.g., Hummers' method),11 chemical vapor deposition (CVD),12 sublimation of Si from SiC,13 solution-phase exfoliation of graphite,14 and mechanical cleavage from graphite paper.15 However, the development of one efficient method for preparing high-quality GNs from the exfoliation of graphite powders is still a big challenge. For example, the Hummers' and its modified Hummers' methods are the frequently-employed route to chemically exfoliate graphite powder, thus producing solution dispersible graphene oxide (GO) sheets. However, the presence of oxide functionalities on the GO sheets significantly reduces their electrical conductivity due to an inevitable disruption of long-range conjugation.16,17 To recover their electrical conduction, one thermal reduction process has to be performed on the GO sheets under inert or H2-containing atmosphere. Unfortunately, the electrical conductivity of the GO sheets can just be partially recovered by thermal reduction. As for CVD, the process is limited by its high energy consumption due to the requirements of high temperature, high material consumption for the requirement of metal catalyst and the complex transfer process to the desired substrate.17 Finally, despite being able to produce high quality graphene, the yield and controllability of mechanical cleavage method is too low to be commercially viable.18,19Within the above scope, one strategy to prepare high-yield and high-quality GNs has been initialized by using electrochemical exfoliation (EE) method. In fact, the EE method has gradually emerged and attracted lots of attentions owing to its rapid synthesis, simplicity, and environmental friendly approach.20–22 The EE of graphite into GN with one or a few stacks of graphene-like sheets could be achieved using different types of electrolytes such as LiCl in propylene carbonate (PC),16 (NH4)2SO4 aqueous solution,17 LiOH molten salt,23 LiClO4 in PC,24 LiCl in dimethyl sulfoxide,25 and H2SO4 aqueous solution.26,27 The direct exfoliation of graphite in solution by the EE method allows for the fabrication of high-quality graphene products at low temperatures. Among the electrolytes, the EE method in the presence of SO42− ions has been confirmed to exhibit the improved exfoliation efficiency (usually <20 min). This is because SO42− ions tend to intercalate defective sites at edges or grain boundaries of graphite, originated from the electrolysis of water.27 This superior efficiency can be attributed to a lower reduction potential of SO42− ions (+0.20 V) to enable release of SO2 gas and anion depolarization,19 causing the widening of interlayer distance of graphite. However, there are few reports focusing on the fundamental reaction kinetics of the EE method in the presence of sulfate ions.
Herein we demonstrate an efficient two-step EE approach of obtain high-quality GNs and investigate the influence of operating temperature on the exfoliation efficiency of graphite electrodes. An apparent activation energy (Eapp) was determined from the slope of Arrhenius linear plot, based on the generation rate of GNs by the EE method using constant voltage (CV) and constant current (CC) models. The crystalline structure and interlayer distance of GN products were systematically investigated. The present work sheds some lights on how the exfoliation temperature and operating models (i.e., CV and CC model) affect the quality of GNs based on the EE approach operated in the presence of sulfate ions.
Experimental
Electrochemical exfoliation of graphene from graphite
Natural graphite (NG) with a size of 2 × 2 × 1.5 cm3 was used as an electrode and source of GNs for the EE method. The graphite flake was adhered to a stainless wire and then was immersed into 250 ml of 2 M H2SO4 solution. One piece of platinum foil with an area of 2 × 1.5 cm2 was carefully placed parallel to the graphite flake. The distance between the graphite plate and the platinum foil was carefully held at 4 cm. Before the exfoliation process, the NG electrode was immersed into the H2SO4 solution for 5 min, ensuring the total wetting on the NG surface. The present work employed two electrochemical models, CV and CC, for the exfoliation of graphene from NG electrodes. As for CV model, the exfoliation process was carried out by applying two-step DC bias on the graphite electrode: 1 V for 5 min and then 5 V for 10 min. The CC model was conducted by using two-step procedure: 0.1 A for 5 min and then 0.5 A for 10 min. The schematic diagram for illustrating the EE process could be briefly described in Fig. 1.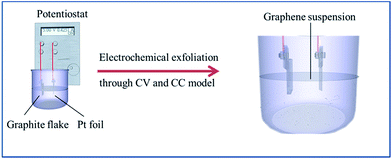 | ||
| Fig. 1 The schematic diagram of electrochemically exfoliating graphene from graphite electrode under CV and CC models with the temperature range of 300–333 K. | ||
To clarify the reactivity, both the CV and CC models were performed at 300, 313, 323, and 333 K. The electrochemical reactor was placed on a hot plate and then uniformly heated to the desired temperatures. To accurately control the temperature, we employed thermal couples to detect the temperature of electrochemical system. The temperature reading was monitored and recorded by using the thermal couple (K-type, accuracy: ±0.1 °C). The exfoliated GNs were carefully collected with a Teflon filter paper and washed with distilled water. To confirm the yield of GNs, the NG electrodes were weighted before and after the EE process.
Characterization of exfoliated graphene sheets
Field-emission scanning electron microscope (FE-SEM, JEOL JSM-5600) and high-resolution transmission electron microscope (HR-TEM, JEOL, JEM-2100) were adopted to inspect the micro-structural morphology of as-prepared graphene sheets. We employed X-ray diffraction (XRD, Shimadzu Labx XRD-6000) spectroscope, equipped with Cu-Kα radiation emitter, to analyze the crystalline structures of GN samples. The crystalline structure of GN powders was characterized by using Raman spectroscopy (Renishaw Micro-Raman spectrometer). An optical microscopy (OM, Model Eclipse L150) was used to observe cross-sectional views of graphite electrodes.Chemical kinetics of electrochemical exfoliation process
The linear Arrhenius plots could be formulated as follows: −ln(RGN) = ln![[thin space (1/6-em)]](https://www.rsc.org/images/entities/char_2009.gif) A − Eapp/RT, where RGN is the global reaction rate in units of [mg GN per min g NG], A is the apparent reaction constant, R is the universal gas constant, and T is the operating temperature. The Eapp value could be determined from the slope of Arrhenius plot of −ln(RGN) versus 1/T. Two sets of RGN values could be obtained from the weight loss of NG electrode and the GN products generated from the EE methods, according to the CV and CC models.
A − Eapp/RT, where RGN is the global reaction rate in units of [mg GN per min g NG], A is the apparent reaction constant, R is the universal gas constant, and T is the operating temperature. The Eapp value could be determined from the slope of Arrhenius plot of −ln(RGN) versus 1/T. Two sets of RGN values could be obtained from the weight loss of NG electrode and the GN products generated from the EE methods, according to the CV and CC models.
Results and discussion
Fig. 2(a) and (b) illustrate the profiles of CV and CC models using the electrochemical exfoliation process, respectively. Both CV and CC models were conducted to exfoliate graphene from graphite flake at different temperatures. The profile for both CV and CC models can be divided into three steps: (i) ionic adsorption and surface wetting on the NG surface, (ii) ionic intercalation at low voltage or low current, and (iii) edge and in-depth exfoliation of GNs at high voltage or high current. In the step (iii), the current and voltage as the functions of exfoliation period for the CV and CC models are depicted in Fig. 2(c) and (d), respectively. It can be viewed that the current and voltage profiles are independent to the operating temperature. The current displays an obvious decay with an increase in exfoliation period, whereas the voltage is an increasing function of the exfoliation time. The CC model reveals the rapid intercalation of OH− and SO42− ions into the graphite lattice in initial stage. With increasing the electrolysis period, the ionic insertion into the interlayer spaces becomes more difficult since the intercalated compounds are gradually formed. Thus, the voltage gradually increases as the electrolysis period is prolonged. Similarly, this deduction can be used to support the finding of CV model.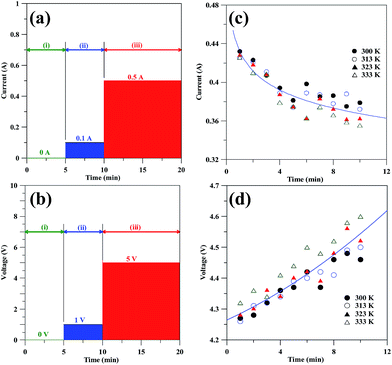 | ||
| Fig. 2 The profiles of the EE method using (a) CV and (b) CC model. The current and voltage as a function of exfoliation time under (c) CV and (d) CC operation. | ||
Fig. 3(a) and (b) show typical XRD patterns of GN products, prepared by the EE method under CV and CC models, respectively. For comparison, the NG possesses a (002) diffraction peak at 26.6°, i.e., d-interlayer spacing distance: ∼0.334 nm. After the exfoliation process, all (002) peaks gradually shift from 26.6° to smaller scattering angle, indicating the presence of GNs.23 It is worth noting that the shift becomes more evident when the exfoliation of GNs from graphite flake happens at high temperatures. This observation persists for both CV and CC models, implying that the interlayer distance of graphite lattice is enlarged. The influence of operating temperature on the d-interlayer spacing distance of GN powders is depicted in Fig. 3(c) and (d). The figures clearly reflect that the d-interlayer distances is an increasing function of temperature for both CV and CC models. This finding can be ascribed to the fact that the ionic diffusion and intercalation are more accessible at high temperature, thereby enlarging the interlayer distance.
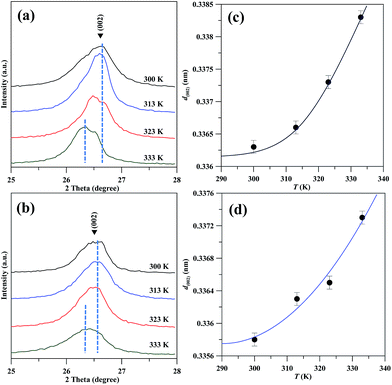 | ||
| Fig. 3 Typical XRD patterns of GN powders prepared under (a) CV and (b) CC model at different temperatures. The interlayer distance as a function of exfoliation temperature: (c) CV and (d) CC model. | ||
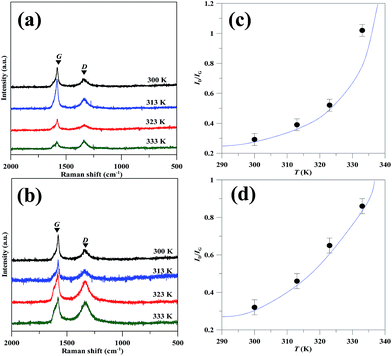
To inspect the quality of GN products, Raman spectroscopy was adopted to characterize the crystallization degrees of GN samples, as shown in Fig. 4(a) and (b). It is generally recognized that two main peaks for GN center at 1580 and 1350 cm−1, which are assigned to the G and D bands, respectively. The G band is basically assigned to the stacking of the graphite hexagon network plane, whereas the D band at 1350 cm−1 can be attributed to defects or structural disorder in the graphite lattice.24–26 That is, the G band is assigned to the vibration of sp2-bonded carbon atoms in a two-dimensional hexagonal lattice, whereas the D band either results from the vibration of carbon atoms with dangling bonds in crystal lattice plane terminations of disordered graphite, or from the defects in curved graphene sheets.27 The ratio of the intensity of D to G peak, ID/IG, serves as a crucial index to clarify the defect concentration on the GNs.28,29 The ID/IG ratios are also found to be two increasing functions of operating temperature, as depicted in Fig. 4(c) and (d) for the CV and CC models, respectively. The minimal ID/IG ratios are 0.29 and 0.25 for the CV and CC models operated at 300 K, respectively. In contrast, such low magnitudes are much lower than that of thermally reduced GO sheets (0.85–0.95)30 and chemically reduced GO sheets (∼0.94) under microwave irradiation.31 To inspect the Raman analysis, the 2D peaks for all GN samples have been illustrated in Fig. 5. It is generally recognized that both position and shape of 2D band are important indicators to identify the number of GN layer.32 The 2D band, at roughly 2700 cm−1, mainly originates from two phonon double resonance Raman process.33 The 2D peaks observed from the GN products deliver a slight change in the shape, varied with the exfoliation temperature. As for the GN produced under the CV model, the position of 2D peak ranges from 2678 to 2686 cm−1 and its shape suggests 2- or 5-layered graphene. The GN products prepared from the CC model are found to have 2–6 layered graphene, according to their shapes and 2D positions (i.e., 2680 to 2694 cm−1). The result reflects that (i) the two-step EE method is capable of producing high-quality graphene and (ii) the low-temperature exfoliation process can produce low-defect GN products.
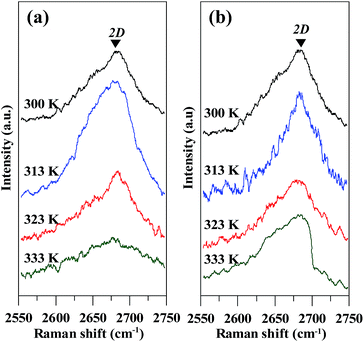 | ||
| Fig. 5 Typical 2D Raman spectra of GN powders prepared under (a) CV and (b) CC models at different temperatures. | ||
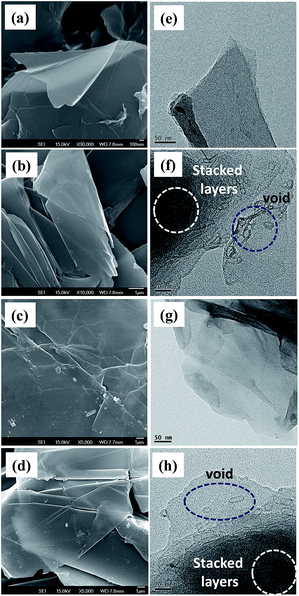
To verify the argument, the influence of exfoliation temperature on the morphology of as-prepared GNs was characterized by FE-SEM and HR-TEM, as illustrated in Fig. 6. As observed from the FE-SEM photographs that the exfoliated GNs are composed of several wrinkled carbon layers. Fig. 6(e)–(h) show HR-TEM micrographs for GNs prepared at 300 and 333 K, based on the CV and CC models.
The HR-TEM studies provides further support that the GNs prepared at 300 K are composed of an isolated single or several graphene layers, while the GNs exfoliated at 333 K are found to have a number of cavities and voids on the basal planes. The presence of cavities and voids significantly increase the defect concentration over the surface of GN, which is identical with the result of Raman spectroscopy.
The formation of “broken” graphene layers mainly originate from the interaction of H2O on expanded graphite, which was electrochemically peeled by the generation of O2 and the evolution of SO2 gas. Since water is oxidized to generate hydroxyl (OH˙) and oxygen (O˙) radicals, the active radicals enable to the corrosion of edges sites, grain boundaries, or defect sites for expanded graphite, thus inducing the dissolution of carbon crystals.34 Meanwhile, the Cx layers tend to react with water molecules during the EE process, which can be represented as follows:34,35
| Cx + H2O → Cx−1OH + H+ + e− | (R1) |
| Cx + 2H2O → Cx−1 + CO2↑ + 4H+ + 4e− | (R2) |
| Cx + 2H2O → Cx−1COOH + CO2↑ + 3H+ + 3e− | (R3) |
This phenomenon becomes more evident at high exfoliation temperature for both CV and CC models. Additionally, it is worth noting that the high-temperature exfoliation produces some stacked graphene layers (see Fig. 6(f) and (h)), which are rapidly suspended during the exfoliation process. This is unfavorable for producing high-quality GN product. On the basis of the results, the selection of an appropriate temperature is crucial for the generation of high-quality graphene during the EE operation.
The RGN value as an increasing function of temperature for both CV and CC models is depicted in Fig. 7(a) and (b), respectively. The figures clearly indicate that the exfoliation process is an exothermic reaction, in which the RGN value is strongly predominant at high temperature. Of interest, the RGN of GNs operated at the CC model is approximately five times higher than that at the CV model within the temperature range of 300–333 K, i.e., RGN: 30.2 mg g−1 min−1 (CC model) and 6.1 mg g−1 min−1 (CV model) at 333 K. This enhanced RGN can be attributed to the fact that the CV model continues a fixed current during the exfoliation process. However, the NG electrode shrinks, and thus the current density on the working electrode gradually rises with an increase in exfoliation period. This increased current density aids more water electrolysis, anion reduction, carbon corrosion, bubble expansion on the NG electrode. On the other hand, there is a decline in current with the exfoliation time when operating the CV model, as showing in Fig. 2(c).
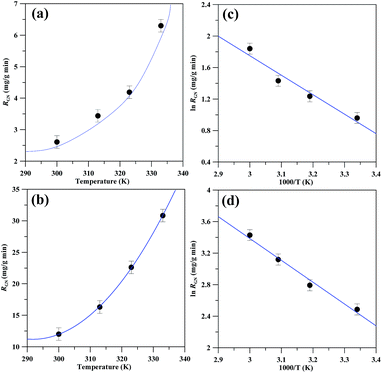 | ||
Fig. 7 The growth rate of GNs as an increasing function of exfoliation temperature: (a) CV and (b) CC model. The Arrhenius plots of ln![[thin space (1/6-em)]](https://www.rsc.org/images/entities/char_2009.gif) RGN versus 1/T under (c) CV and (d) CC model. RGN versus 1/T under (c) CV and (d) CC model. | ||
Since both models could produce high-quality GNs, this study reveals that the EE route under the CC model is beneficial for large-scale production. By using only 250 ml reactor, more than 1.8 g of GNs can be obtained in less than 1 h, according to the RGN value under the CC model. The Arrhenius plots are also illustrated in Fig. 7, showing the linear relations for both CV and CC operations. The Eapp values, determined from the slope of Arrhenius plots, are 20.6 and 23.1 kJ mol−1 for the CV and CC models, respectively. This result reflects that the growth rate of GNs is less sensitive to the exfoliation temperature, based on the CV model.
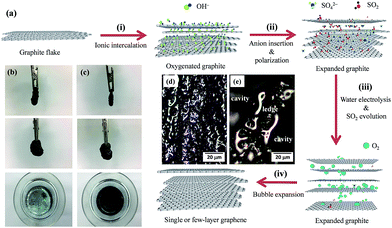
Accordingly, we propose one mechanism of EE process, which can be depicted in Fig. 8(a). The mechanism covers the following steps: (i) ionic intercalation, (ii) anion insertion and polarization, (iii) electrolysis of water and SO2 evolution, and (iv) bubble expansion. In step (i), the oxidation of water at anode produces hydroxyl and oxygen radicals,35 which is formulated as follows:
| H2O → H+ + OH˙ + e → 2H+ + O˙ + e− | (R4) |
The oxidation or hydroxylation due to these radicals starts to take place at edges sites and grain boundaries of NG electrode. The step (ii) allows that the insertion of anionic SO42− into the oxygenated graphite, where the defective sites were opened up by the oxidation or hydroxylation. With increasing period, the defective sites are totally occupied by SO42− ions and water molecules. The step (iii) leads to the release of SO2 and O2 gases, contributed from the anion reduction17 and the water oxidation,34,35 respectively. The reaction steps concerning the evolution of gaseous molecules can be expressed as follows:
| SO42− + 4H+ + 4e− → SO2↑ + 3H2O | (R5) |
| H2O → 2H+ + 2e− + 1/2O2↑ | (R6) |
These gas species would be evolved from the expanded graphite, causing the exfoliation of graphene from the NG electrode, i.e., the progress of step (iv). Due to its low reduction potential (+0.20 V), the formation of SO2 gas (i.e., (R5)) is fast, thereby imparting a rapid exfoliation.17 Since the oxygenated graphite possesses a hydrophilic surface, water and other hydration molecules tends to physically adsorb on the expanded graphite surface. When applying a DC bias, the bubble expansion from the electrolysis of water (i.e., oxygen gas from (R6)) could assist the exfoliation of GNs from the NG electrode.
Fig. 8(b) and (c) show the top- and cross-sectional views of NG flake used as an anode operated under the CV and CC model at 300 K after 10 min exfoliation, respectively. These photos evidently indicate the edge corrosion and size shrinkage of NG electrode, eventually leading to the dissociation of graphite flakes. The OM photos, focusing on the edge corrosion before and after the EE process, have been provided, as shown in Fig. 8(d) and (e). It can be seen that there is obvious edge corrosion, supporting the formation mechanism of graphene products via the EE route. As expected, the amount of GNs under the CC operation is much larger than that under the CV model. This result could be explained by the above mechanism. It has been confirmed that the CC model supplies higher current density, as compared with the CV one. This reflects that the CC model facilitates the advance of reaction steps including (R4)–(R6), leading to fast exfoliation of graphene. However, it should be noted that the high-temperature exfoliation process (e.g., 333 K) is harmful for the quality of GNs, resulting in broken layers and fragment. Two explanations can be inferred from the phenomenon: (i) high reaction kinetics (i.e., (R1)–(R3)) for the NG etching and (ii) drastic releasing of gas species from the expanded graphite.
Conclusions
We have devised a high-yield method for producing low-defect GNs by electrochemical exfoliation of graphene from NG electrode in the presence of sulfate ions under CV and CC models. The growth rate of GNs obtained under the CC operation was significantly higher than that produced under CV one. The EE process was capable of producing low-defect and high-yield GN products, as compared to other chemical exfoliation processes. By using only 250 ml reactor, more than 1.8 g of GNs is obtained in less than 1 h through the CC operation. The interlayer distance, defect concentration, and growth rate of GNs is found to be an increasing function of exfoliation temperature. Accordingly, the selection of an appropriate temperature is crucial for the formation of high-quality graphene during the EE operation. One mechanism, composed of (i) ionic intercalation, (ii) anion insertion and polarization, (iii) water electrolysis and SO2 evolution, and (iv) bubble expansion, was proposed to clarify the growth of GNs during the exfoliation process. The apparent activation energies under the CV and CC operations were in the range of 20.6–23.1 kJ mol−1, based on the analysis of Arrhenius plots. On the basis of experimental results, this EE approach constitutes an industrially scalable processing method for producing high-yield and low-defect graphene products.Acknowledgements
The authors are very grateful for the financial support from the National Science Council of Taiwan under the contract MOST 103-2221-E-155-014-MY2 and MOST 105-2221-E-155-014-MY3.References
- S. Biswas and L. T. Drzal, Nano Lett., 2009, 9, 167–172 CrossRef CAS PubMed.
- C. Xu, X. Wang and J. Zhu, J. Phys. Chem. C, 2008, 112, 19841–19845 CAS.
- C. T. Hsieh, J. L. Gu, Y. C. Chen and D. Y. Tzou, Electrochim. Acta, 2013, 98, 39–47 CrossRef CAS.
- S. M. Paek, E. Yoo and I. Honma, Nano Lett., 2009, 9, 72–75 CrossRef CAS PubMed.
- C. T. Hsieh, C. Y. Lin, Y. F. Chen, J. S. Lin and H. Teng, Carbon, 2013, 62, 109–116 CrossRef CAS.
- R. Muszynski, B. Seger and P. V. Kamat, J. Phys. Chem. C, 2008, 112, 5263–5266 CAS.
- C. T. Hsieh, B. H. Yang and J. Y. Lin, Carbon, 2011, 49, 3092–3097 CrossRef CAS.
- C. T. Hsieh, W. Y. Lee, C. E. Lee and H. Teng, J. Phys. Chem. C, 2014, 118, 15146–15153 CAS.
- K. S. Novoselov, A. K. Geim, S. V. Morozov, D. Jiang, Y. Zhang, S. V. Dubonos, I. V. Grigorieva and A. A. Firsov, Science, 2004, 306, 666–669 CrossRef CAS PubMed.
- A. K. Geim, Science, 2009, 324, 1530–1534 CrossRef CAS PubMed.
- W. S. Hummers Jr and R. E. Offeman, J. Am. Chem. Soc., 1958, 80, 1339 CrossRef.
- X. Li, W. Cai, J. An, S. Kim, J. Nah and D. Yang, Science, 2009, 324, 1312–1314 CrossRef CAS PubMed.
- Y. Lin, C. Dimitrakopoulos, K. A. Jenkins, D. B. Farmer, H. Chiu and A. Grill, Science, 2010, 327, 662–669 CrossRef CAS PubMed.
- Y. Hernandez, V. Nicolosi, M. Lotya, F. M. Blighe, Z. Sun and S. De, Nat. Nanotechnol., 2008, 3, 563–568 CrossRef CAS PubMed.
- M. J. Allen, V. C. Tung and R. B. Kaner, Chem. Rev., 2010, 110, 132–145 CrossRef CAS PubMed.
- J. Wang, K. K. Magnga, Q. Bao and K. P. Loh, J. Am. Chem. Soc., 2011, 133, 8888–8891 CrossRef CAS PubMed.
- K. Parvez, Z. S. Wu, R. Li, X. Liu, R. Graf, X. Feng and K. Müllen, J. Am. Chem. Soc., 2014, 136, 6083–6091 CrossRef CAS PubMed.
- J. Buddhika and S. Subbiah, Nanoscale Res. Lett., 2011, 6, 95–101 CrossRef PubMed.
- B. Marta, C. Leordean, T. Istvan, I. Botiz and S. Astilean, Appl. Surf. Sci., 2016, 363, 613–618 CrossRef CAS.
- J. Liu, H. Yang, S. G. Zhen, C. K. Poh, A. Chaurasia, J. Luo, X. Wu, E. K. L. Yeow, N. G. Sahoo, J. Lin and Z. Shen, RSC Adv., 2013, 3, 11745–11750 RSC.
- P. K. M. K. S. Shanthini and C. Srivastava, RSC Adv., 2015, 5, 53865–53869 RSC.
- X. Huang, S. Li, Z. Qi, Z. Wei, Y. Wei and Y. Fang, Nanotechnology, 2015, 26, 105602–105608 CrossRef PubMed.
- C. T. Hsieh, C. Y. Lin, Y. F. Chen, J. S. Lin and H. Teng, Carbon, 2013, 62, 109–116 CrossRef CAS.
- G. D. Yuan, W. J. Zhang, Y. Yang, Y. B. Tang, Y. Q. Li and J. X. Wang, Chem. Phys. Lett., 2009, 467, 361–364 CrossRef CAS.
- A. Dato, V. Radmilovic, Z. Lee, J. Phillips and M. Frenklach, Nano Lett., 2008, 8, 2012–2016 CrossRef CAS PubMed.
- H. Guo, L. Song, W. Guo, L. Huang, D. Yang and F. Wang, Carbon, 2012, 50, 4476–4482 CrossRef.
- C. W. Huang, C. H. Hsu, P. L. Kuo, C. T. Hsieh and H. Teng, Carbon, 2011, 49, 895–903 CrossRef CAS.
- D. Graf, F. Molitor, K. Ensslin, C. Stampfer, A. Jungen, C. Hierold and L. Wirtz, Nano Lett., 2007, 7, 238–242 CrossRef CAS PubMed.
- K. N. Kudin, B. Ozbas, H. C. Schniepp, R. K. Prud'homme, I. A. Aksay and R. Car, Nano Lett., 2008, 8, 36–41 CrossRef CAS PubMed.
- C. T. Hsieh, B. H. Yang and Y. F. Chen, Diamond Relat. Mater., 2012, 27, 68–75 CrossRef.
- C. T. Hsieh, B. H. Yang and J. Y. Lin, Carbon, 2011, 49, 3092–3097 CrossRef CAS.
- A. C. Ferrari, J. C. Meyer, V. Scardaci, C. Casiraghi, M. Lazzeri, F. Mauri, S. Piscanec, D. Jiang, K. S. Novoselov, S. Roth and A. K. Geim, Phys. Rev. Lett., 2006, 97, 187401 CrossRef CAS PubMed.
- A. C. Ferrari, Solid State Commun., 2007, 143, 47–57 CrossRef CAS.
- S. Ravula, S. Baker, G. Kamath and G. Baker, Nanoscale, 2015, 7, 4338–4353 RSC.
- J. Lu, J. X. Yang, J. Wang, A. Lim, S. Wang and K. P. Loh, ACS Nano, 2009, 3, 2367–2375 CrossRef CAS PubMed.
| This journal is © The Royal Society of Chemistry 2016 |

