A hydrothermal route for synthesizing highly luminescent sulfur- and nitrogen-co-doped carbon dots as nanosensors for Hg2+†
Chunfeng Wang‡
ab,
Dong Sun‡a,
Yujuan Chena and
Kelei Zhuo*a
aCollaborative Innovation Center of Henan Province for Green Manufacturing of Fine Chemicals, Key Laboratory of Green Chemical Media and Reactions, Ministry of Education, School of Chemistry and Chemical Engineering, Henan Normal University, Xinxiang, Henan 453007, P. R. China. E-mail: klzhuo@263.net; Fax: +86-373-3329056; Tel: +86-373-3329056
bSchool of Life Science, Henan Normal University, Xinxiang, Henan 453007, China
First published on 6th September 2016
Abstract
Carbon dots have attracted tremendous attention due to their excellent properties, such as outstanding photoluminescence, low cytotoxicity, and superior biocompatibility. In this work, a simple and low cost method was developed to synthesize sulfur- and nitrogen-co-doped carbon dots (S/N-CDs) via hydrothermal treatment of pyritinol hydrochloride in the presence of graphene oxide (GO). The S/N-CDs displayed good water solubility, high luminescence stability, excitation-dependent emission, up-conversion photoluminescence, and strong photoluminescence with a quantum yield of ca. 32.2% without complicated surface modifications. In addition, the prepared S/N-CDs were used as a sensitive probe to detect Hg2+ ions, showing an excellent selectivity and wide linear range. Particularly, the detection limit could reach as low as 1.0 nM.
Introduction
Carbon dots (CDs), derived from carbon nanotubes during the process of electrophoresis in 2004, commonly exist at a size of less than 10 nm. CDs, emerging as a rising star of carbon nanomaterials, have attracted tremendous attention due to their excellent properties, such as outstanding photoluminescence, low cytotoxicity, and superior biocompatibility.1 The excellent performances of CDs make them applicable in many fields such as bioimaging,2–4 drug delivery,5,6 sensors,7–10 and catalysis.11Up to now, a number of synthetic approaches have been reported to produce photoluminescent CDs, such as ultrasonic treatment,12 laser ablation,13 hydrothermal treatment,14,15 electrochemical oxidation,16 pyrolysis,17 and microwave methods.18,19 However, the generality of CDs shows a comparatively low photoluminescence quantum yield (QY) compared with traditional semiconductor QDs. In recent years, the surface modification becomes an effective method to tune the fluorescent performances. For example, Sun et al.13 developed a method for synthesizing fluorescent CDs through laser ablation of graphite powder and further obtaining surface-functionalized CDs by surface passivation. The observed photoluminescence QYs were from 4% to 10%. Zhu et al.20 proposed a method for synthesizing polyethylene glycol passivated graphene quantum dots (GQDs-PEG) with a QY of 28.0%. The photoluminescence QY of GQDs-PEG were two times higher than the pure GQDs. Wang et al.21 reported a route to produce functionalized CDs with a high photoluminescence efficiency of about 10% by surface passivation of crude CDs with poly (ethyleneglycol) (PEG1500), which was three times higher than the crude CDs. However, these approaches need complicated surface modifications. Thus, there is a considerable demand to establish a facile, green, and low-cost method for synthesizing fluorescent CDs with excellent photoluminescence properties.
In this work, we suggest an economical and one-pot approach for synthesizing sulfur- and nitrogen-co-doped carbon dots (S/N-CDs) with a high photoluminescence efficiency through hydrothermal treatment of pyritinol hydrochloride in the presence of GO. The synthetic route for the S/N-CDs is shown in Scheme 1. The approach developed for the synthesis of S/N-CDs is a facile and green, does not need any costly chemical reagents, severe synthetic conditions, and further complicated surface functionalization. The resulting S/N-CDs have a size around 3.45–11.55 nm and exhibit strong photoluminescence with a quantum yield of ca. 32.2%, good luminescence stability, excitation-dependent emission, excellent water solubility, and up-conversion photoluminescence behaviour. In addition, the prepared S/N-CDs were used as a sensitive probe for the detection of mercury ions with good selectivity and wide linear range in aqueous solutions. Particularly, the detection limit could reach as low as 1.0 nM. This S/N-CDs sensing system has been successfully applied for the analysis of Hg2+ ions in water samples from river, showing good practical feasibility.
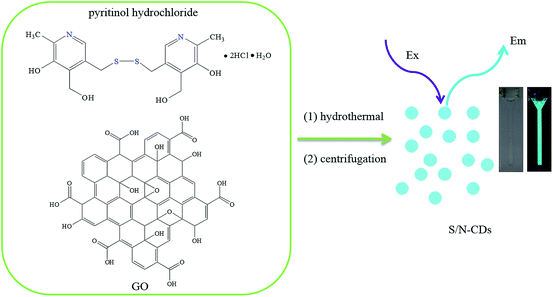 | ||
| Scheme 1 Illustration of formation of S/N-CDs from hydrothermal treatment of pyritinol hydrochloride. Photographs of S/N-CDs: taken under visible light (left) and UV light (right). | ||
Experimental section
Materials and apparatus
Pyritinol hydrochloride was obtained from Sigma-Aldrich Trading Co. Ltd, China. In addition, all other reagents and apparatus used in this work are the same as those used in our previous work.22Synthesis of S/N-CDs
GO was prepared by using the modified Hummers method.23 S/N-CDs were prepared via hydrothermal treatment of pyritinol hydrochloride in the presence GO. 0.15 g of pyritinol hydrochloride was put into 10 mL GO aqueous suspension of 0.5 mg mL−1, then the mixture was stirred until the pyritinol hydrochloride was thoroughly dissolved. Finally, the mixture was placed into a 25 mL Teflon-lined autoclave and heated at 100 °C for 60 h. The product was isolated by centrifugation at 5000 rpm, then the product was filtered through microporous membrane to filter the large particles, yielding a yellow dispersion (S/N-CDs-1). For comparison, 0.15 g of pyritinol hydrochloride was put into 10 mL water. Then the mixture was stirred until the pyritinol hydrochloride was thoroughly dissolved. Finally, the mixture was placed into a 25 mL Teflon-lined autoclave and heated at 100 °C for 60 h. The suspension was isolated by centrifugation at 5000 rpm, then the product was filtered through microporous membrane to filter the large particles, yielding a yellow dispersion (S/N-CDs-2).Fluorescence detection of Hg2+
1 mL of 10 mM phosphate buffer solution (PBS, pH 7.0), 10 μL of S/N-CDs, and different amounts of Hg2+ ions were placed into a 2.0 mL vial. Then the mixture was diluted to a given volume. Photoluminescence spectra were obtained after 15 min at room temperature.Results and discussion
Characterization of S/N-CDs
Fig. 1a indicates typical peaks of carbon (about 285.2 eV), sulfur (about 164.0 eV), oxygen (about 532.0 eV), and nitrogen (about 400.0 eV) atoms. The contents of C, N, and S elements are 66.36%, 7.14%, and 8.62%, respectively. The C1s spectrum in the as-prepared S/N-CDs (Fig. 1b) shows four single peaks at 284.5 eV, 285.3 eV, 286.0 eV and 286.5 eV, which are associated with C–C/C![[double bond, length as m-dash]](https://www.rsc.org/images/entities/char_e001.gif) C, C–S, C–N, and C–O (epoxy and alkoxy), respectively.24,25 The N1s spectrum can be deconvoluted into two peaks at 400.6 and 398.4 eV, which correspond to the pyrrolic N and pyridinic N, respectively (Fig. 1c).26 The O1s spectrum reveals two carbon species of C
C, C–S, C–N, and C–O (epoxy and alkoxy), respectively.24,25 The N1s spectrum can be deconvoluted into two peaks at 400.6 and 398.4 eV, which correspond to the pyrrolic N and pyridinic N, respectively (Fig. 1c).26 The O1s spectrum reveals two carbon species of C![[double bond, length as m-dash]](https://www.rsc.org/images/entities/char_e001.gif) O (531.7 eV) and C–O (532.7 eV) (Fig. 1d).27 The S2p spectrum exhibits two peaks centered at 163.9 and 165.1 eV (Fig. 1e), showing that sulfur exists in two forms.28
O (531.7 eV) and C–O (532.7 eV) (Fig. 1d).27 The S2p spectrum exhibits two peaks centered at 163.9 and 165.1 eV (Fig. 1e), showing that sulfur exists in two forms.28
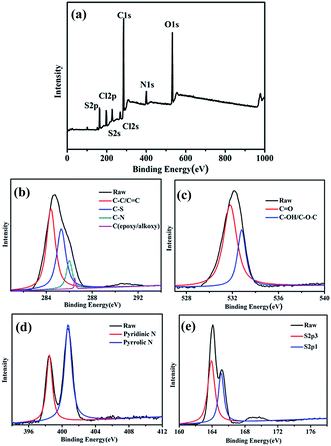 | ||
| Fig. 1 (a) The X-ray photoelectron spectra (XPS) spectra of S/N-CDs-1. (b–e) High-resolution XPS spectra of C1s, O1s, N1s and S1s of S/N-CDs-1. | ||
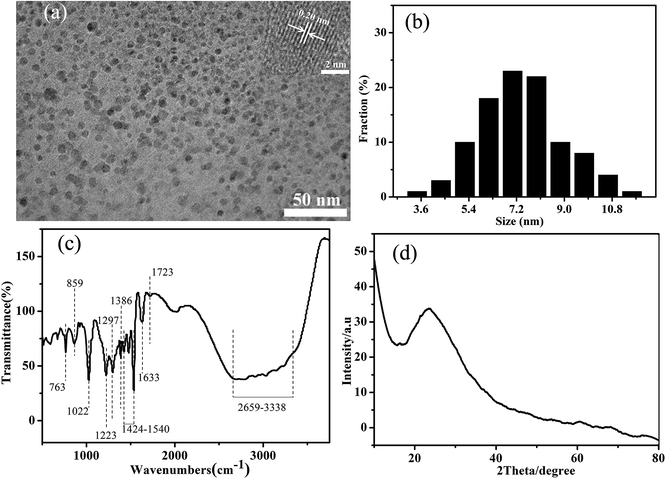
The transmission electron microscopy (TEM) image (Fig. 2a) indicates that the obtained S/N-CDs-1 were spherical structures and present good dispersion. The size distribution histogram (Fig. 2b) shows that the S/N-CDs-1 have a narrow size distribution of 3.45–11.55 nm in diameter with maximum population at about 7.4 nm (100 random carbon dots were accounted). High-resolution TEM image (inset of Fig. 2a) shows the presence of particles with obvious lattice fringes. The lattice parameter was measured to be 0.20 nm corresponding to the (100) diffraction planes of graphitic carbon,29 demonstrating that the S/N-CDs have a graphite-like structure. In the Raman spectra of the carbon nanostructures, the D band arises from the extent of defects, while the G band is attributed to the E2g phonon of sp2 carbon atoms.30 The Raman spectrum of the S/N-CDs-1 shows only a broad D-band at 1386 cm−1, which implies a low carbon-lattice-structure content (Fig. S1†).
Fig. 2c indicates fourier transform infrared (FTIR) spectrum of the S/N-CDs-1. Peaks around 1022 cm−1 and 1297 cm−1 correspond to the C–O–C and C–O bonds, respectively.31,32 The peak at 1223 cm−1 corresponds to the C–N and C–S stretching modes.33 The peak located around 1386 cm−1 is identified as δs(CH3).34 The peak at 1401 cm−1 shows the existence of carboxyl group.35 The band around 1424–1540 cm−1 is assigned to the C–N and N–H groups.36 The peaks at 1633 and 1723 cm−1 are ascribed to C![[double bond, length as m-dash]](https://www.rsc.org/images/entities/char_e001.gif) C7 and C
C7 and C![[double bond, length as m-dash]](https://www.rsc.org/images/entities/char_e001.gif) O group, respectively. The broad absorption bank at 2659–3338 cm−1 represents C–N and O–H bonds. The above results display that the S/N-CDs-1 is functionalized with oxygen-containing groups, such as carboxyl, carbonyl, epoxyl, and hydroxyl. Besides, the S/N-CDs-1 have a diffraction peak centered at ca. 23.0° in the typical X-ray diffraction (XRD) spectrum (Fig. 2d), exhibiting that the (002) interlayer spacing distance is ca. 0.38 nm. The intensity of the peak was relatively low, showing that the crystallinity of the S/N-CDs-1 was not obvious. The amorphous part of the S/N-CDs-1 may contain various functional groups, such as hydroxyl, carbonyl, and carboxyl groups.37 These functional groups endow the S/N-CDs-1 with good water-solubility.
O group, respectively. The broad absorption bank at 2659–3338 cm−1 represents C–N and O–H bonds. The above results display that the S/N-CDs-1 is functionalized with oxygen-containing groups, such as carboxyl, carbonyl, epoxyl, and hydroxyl. Besides, the S/N-CDs-1 have a diffraction peak centered at ca. 23.0° in the typical X-ray diffraction (XRD) spectrum (Fig. 2d), exhibiting that the (002) interlayer spacing distance is ca. 0.38 nm. The intensity of the peak was relatively low, showing that the crystallinity of the S/N-CDs-1 was not obvious. The amorphous part of the S/N-CDs-1 may contain various functional groups, such as hydroxyl, carbonyl, and carboxyl groups.37 These functional groups endow the S/N-CDs-1 with good water-solubility.
Optical performances of S/N-CDs
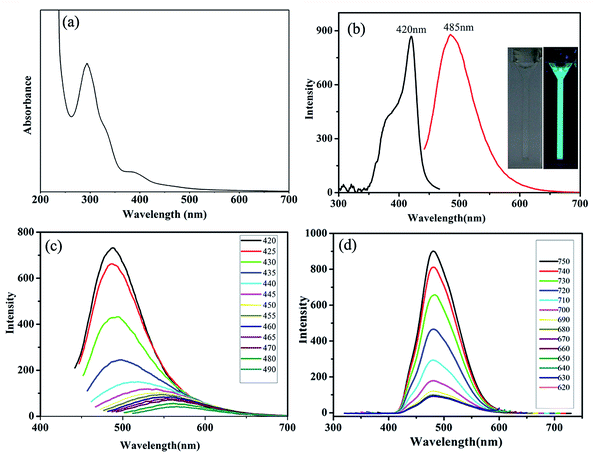
To further explore the optical performance of the S/N-CDs-1, ultraviolet-visible (UV-vis) absorption and photoluminescence spectra were studied at room temperature. It can be seen that S/N-CDs-1 show two absorption peaks centered at 294 nm and 372 nm (Fig. 3a), respectively. The former is attributed to the π–π* transition of aromatic sp2 domains,38 the latter is ascribed to the n–π* transition of the conjugated C![[double bond, length as m-dash]](https://www.rsc.org/images/entities/char_e001.gif) O bond.39 The experiment results indicate that the S/N-CDs-1 have the highest fluorescent intensity at 485 nm when excited at 420 nm (Fig. 3b). The inset of Fig. 3b indicates that aqueous S/N-CDs-1 solution is almost colorless, and but a greenish-blue emission is observed when excited with a 365 nm ultra-violet (UV) lamp. When the excitation wavelength changes from 420 to 490 nm, the corresponding photoluminescence emission wavelength shifts from 488 to 566 nm (Fig. 3c). This phenomenon is similar to the previous reports.40,41 Interestingly, the up-conversion photoluminescence behavior of the S/N-CDs-1 is different from their corresponding down-conversion photoluminescence behavior. As shown in Fig. 3d, upon excitation in the long wave region, the fluorescence spectra of the S/N-CDs-1 had a fixed emission peak at 485 nm, which did not shift with increasing the excitation wavelengths from 590 to 630 nm. However, the intensity of emission peaks gradually decreased with a change in the excitation wavelength. The up-conversion photoluminescence performances of the S/N-CDs-1 could be due to the multi-photon activation process.41 The fixed emission peak position indicated that the emission occurs from the lowest single state, which has nothing to do with the excitation mode.42 The up-conversion photoluminescence of the S/N-CDs-1 is a fascinating feature, which can avoid harmful UV/blue excitations in bioimaging and biomedical applications.35
O bond.39 The experiment results indicate that the S/N-CDs-1 have the highest fluorescent intensity at 485 nm when excited at 420 nm (Fig. 3b). The inset of Fig. 3b indicates that aqueous S/N-CDs-1 solution is almost colorless, and but a greenish-blue emission is observed when excited with a 365 nm ultra-violet (UV) lamp. When the excitation wavelength changes from 420 to 490 nm, the corresponding photoluminescence emission wavelength shifts from 488 to 566 nm (Fig. 3c). This phenomenon is similar to the previous reports.40,41 Interestingly, the up-conversion photoluminescence behavior of the S/N-CDs-1 is different from their corresponding down-conversion photoluminescence behavior. As shown in Fig. 3d, upon excitation in the long wave region, the fluorescence spectra of the S/N-CDs-1 had a fixed emission peak at 485 nm, which did not shift with increasing the excitation wavelengths from 590 to 630 nm. However, the intensity of emission peaks gradually decreased with a change in the excitation wavelength. The up-conversion photoluminescence performances of the S/N-CDs-1 could be due to the multi-photon activation process.41 The fixed emission peak position indicated that the emission occurs from the lowest single state, which has nothing to do with the excitation mode.42 The up-conversion photoluminescence of the S/N-CDs-1 is a fascinating feature, which can avoid harmful UV/blue excitations in bioimaging and biomedical applications.35
We further investigated fluorescent properties of the S/N-CDs-1 under other conditions. First, Fig. S2a† indicated that their photoluminescence intensities did not almost change when the S/N-CDs-1 were stored for 4 months. Second, their fluorescence intensities are nearly constant when NaCl concentrations gradually increase, exhibiting good stability of the S/N-CDs-1 in high ionic strength (Fig. S2b†). Third, as shown in Fig. S2c,† with increasing pH value from 1.0 to 11.0, the fluorescence intensity of the S/N-CDs-1 only had a small change, but shortly decreased when pH > 11, because of the presence of –COOH groups on the surfaces of S/N-CDs-1. The optimum pH = 7 was achieved. Such observations are similar to those for the CDs modified by hydroxyl and carboxylic/carbonyl moieties.39,43 This phenomenon may attributed to the protonation/deprotonation of the functional groups (–COO−/COOH) on the surface of S/N-CDs-1 in basic/acidic media.44
At present, the clear photoluminescence mechanism of CDs is still open debate for the related researchers. Recently, Liu proposed a mechanism: the radiative recombination of excitons trapped by the surface states of CDs,45 which are related to the presence (or absence) of surface groups such as carboxyl, hydroxyl, amine and amide groups.46 In our work, the S/N-CDs-1 were synthesized by hydrothermal treatment of pyritinol hydrochloride in the presence of graphene oxide (GO), and showed a high photoluminescence QY of 32.2%, comparable to those of some CDs reported in the literatures47–50 and common fluorescent semiconductor quantum dots.51–53 However, by the same method, the S/N-CDs-2 synthesized using only pyritinol hydrochloride as the precursor showed a QY of 15.5%. It is known that pyritinol hydrochloride can carry out an oxidation–reduction reaction with GO. Therefore, the presence of GO may change the surface states of the prepared S/N-CDs. So we speculate that the fluorescence of the S/N-CDs-1 may be attributed to the radiative recombination of excitons trapped by the surface states of S/N-CDs.45
Fluorescence detection of Hg2+
Fig. 4a indicated that the prepared S/N-CDs-1 exhibited a strong photoluminescence emission peak at 485 nm in the absence of Hg2+ ions. With increasing concentrations of Hg2+ ions, the photoluminescence intensity of the S/N-CDs-1 gradually weakened. Even at the concentration of 40 μM, nearly 80% of the photoluminescence of the S/N-CDs-1 is quenched, showing a sensitive response to Hg2+ ions. This observation may be attributed to the coordination of Hg2+ with carboxyl, hydroxyl, or the doping heteroatom (nitrogen/sulfur) groups of the S/N-CDs, which changes the electronic structure of the S/N-CDs and affects the distribution of excitons, thus facilitating the non-radiative recombination of the excitons through an effective electron transfer process and leading to a significant quenching of the fluorescence of the S/N-CDs.54–56 Based on the phenomenon, the S/N-CDs-1 was developed as a sensitive probe for Hg2+ detection.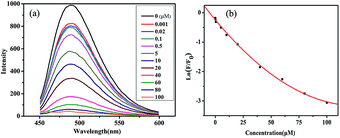 | ||
| Fig. 4 (a) The photoluminescence responses of the S/N-CDs-1 in PBS after adding the different amount of Hg2+ ion (from 0.001 to 100 μM), (b) plot of the F/F0 against the concentration of Hg2+. | ||
Fig. 4b indicates the plot of the relative photoluminescence intensity (F/F0) of the S/N-CDs-1 against the concentration of Hg2+ ions. The fitted curve equation is as follows:
| ln(F/F0) = −0.244 − 0.0457c/μM + 1.79 × 10⁻⁴c2/μM2 (R2 = 0.9977) |
| Probe | Linear range | Detection limit | Ref. |
|---|---|---|---|
| Carbon nanodots | 0–3 μM | 4.2 nM | 55 |
| Nitrogen-doped carbon nanoparticles | 10 nM to 50 μM | 3 nM | 57 |
| Carbon dots | 0–50 nM | 1.35 nM | 58 |
| Carbon dots | 5–200 nM | 2.6 nM | 59 |
| Nitrogen-doped carbon nanoparticles | 0–1 and 1–100 μM | 1.4 nM | 60 |
| Nitrogen-rich quantum dots | 0–20 μM | 0.63 μM | 61 |
| Nitrogen-doped graphene quantum dots | 0–5.0 μM | 0.032 μM | 62 |
| Nitrogen-doped carbon quantum dots | 10 nM to 20 μM | 8.6 nM | 63 |
| Sulfur- and nitrogen-co-doped carbon dots | 1 nM to 100 μM | 1.0 nM | This work |
Different metal ions were studied under the same conditions. Fig. S3† indicates that the additions of Cu2+, Ca2+, Mg2+, Cd2+, Pb2+, Mn2+, Fe3+, Co2+, Ag+, Ni2+, and Ba2+ can not cause any tremendous change in fluorescence intensity. This prominent selectivity is possibly due to stronger interaction between Hg2+ and groups on S/N-CDs-1 surface than that of other metal ions.64,65
To assess the utility of the Hg2+-responsive S/N-CDs-1 probe, we applied the probe to sensing Hg2+ ions in natural water samples, which were collected from the local river. The samples were filtered before measurements. The experimental results show that the photoluminescence intensity of the S/N-CDs-1 did not change in the filtered samples. However, when Hg2+ ions were added to reach 30 μM and 60 μM, the fluorescence intensities of the S/N-CDs-1 decreased in some degree. The recoveries of Hg2+ ions were in the range of 98.7–103.5% (Table S1†). The results suggested that the S/N-CDs-1 based fluorescence probe for Hg2+ detection is reliable and possesses a potential in practical applications.
Conclusion
We have reported a low cost and green method for synthesizing highly photoluminescent sulfur- and nitrogen-co-doped carbon dots with a size of ca. 7.4 nm through hydrothermal treatment of the pyritinol hydrochloride in the presence of GO. Optical property characterization shows that the resulting S/N-CDs possess excellent photoluminescence properties, such as good luminescence stability, excitation-dependent emission, up-conversion photoluminescence, and high QY of ca. 32.2%. In addition, the prepared S/N-CDs were used as a sensitive probe to detect Hg2+ ion, showing an excellent selectivity and wide linear range. Particularly, the detection limit could reach as low as 1.0 nM. We believe that the synthetic strategy would open a novel pathway to synthesize heteroatom-co-doped CDs with wide application prospects such as the detection of metal ions.Acknowledgements
Financial supports from the National Natural Science Foundation of China (No. 21573058, 21173070, U1504212, 21303044) and Program for Innovative Research Team in Science and Technology in University of Henan Province (15IRTSTHN 003) are gratefully acknowledged.Notes and references
- C. X. Wang, H. H. Lin, Z. Z. Xu, Y. J Huang, M. G. Humphrey and C. Zhang, ACS Appl. Mater. Interfaces, 2016, 8, 6621–6628 CAS.
- S. J. Zhu, S. J. Tang, J. H. Zhang and B. Yang, Chem. Commun., 2012, 48, 4527–4539 RSC.
- Y. X. Fang, S. J. Guo, D. Li, C. Z. Zhu, W. Ren and S. J. Dong, et al., ACS Nano, 2012, 6, 400–409 CrossRef CAS PubMed.
- C. X. Wang, Z. Z. Xu, H. H. Lin, Y. J. Huang and C. Zhang, Part. Part. Syst. Charact., 2015, 32, 944–951 CrossRef CAS.
- J. Tang, B. Kong, H. Wu, M. Xu, Y. C. Wang and Y. L. Wang, et al., Adv. Mater., 2013, 25, 6569–6574 CrossRef CAS PubMed.
- Q. L. Wang, X. X. Huang, Y. J. Long, X. L. Wang, H. J. Zhang and R. Zhu, et al., Carbon, 2013, 59, 192–199 CrossRef CAS.
- D. Zhong, H. Miao, K. C. Yang and X. M. Yang, Mater. Lett., 2016, 166, 89–92 CrossRef CAS.
- F. Y. Yan, Y. Zou, M. Wang, X. L. Mu, N. Yang and L. Chen, Sens. Actuators, B, 2014, 192, 488–495 CrossRef CAS.
- C. X. Wang, Z. Z. Xu, H. Cheng, H. H. Lin, M. G. Humphrey and C. Zhang, Carbon, 2015, 82, 87–95 CrossRef CAS.
- C. X. Wang, Z. Z. Xu and C. Zhang, ChemNanoMat, 2015, 1, 122–127 CrossRef CAS.
- J. Q. Pan, Y. Zhou, J. Cao, Y. Z. Sheng, Y. Wu, C. Cui, C. R. Li and B. X. Feng, Mater. Lett., 2016, 170, 187–191 CrossRef CAS.
- Y. C. Li, Y. M. Zhong, Y. Y. Zhang, W. Weng and S. X. Li, Sens. Actuators, B, 2015, 206, 735–743 CrossRef CAS.
- Y. P. Sun, B. Zhou, Y. Lin, W. Wang, K. A. S. Fernando and P. Pathak, et al., J. Am. Chem. Soc., 2006, 128, 7756–7757 CrossRef CAS PubMed.
- Y. Q. Gong, B. Yu, W. Yang and X. L. Zhang, Biosens. Bioelectron., 2016, 79, 822–828 CrossRef CAS PubMed.
- C. X. Wang, K. L. Jiang, Z. Z. Xu, H. H. Lin and C. Zhang, Inorg. Chem. Front., 2016, 3, 514–522 RSC.
- L. Zheng, Y. Chi, Y. Dong, J. Lin and B. Wang, J. Am. Chem. Soc., 2009, 131, 4564–4565 CrossRef CAS PubMed.
- D. Pan, J. Zhang, Z. Li, C. Wu, X. Yan and M. Wu, Chem. Commun., 2010, 46, 3681–3683 RSC.
- Z. Z. Xu, C. X. Wang, K. L. Jiang, H. H. Lin, Y. J Huang and C. Zhang, Part. Part. Syst. Charact., 2015, 32, 1058–1062 CrossRef CAS.
- H. Zhu, X. Wang, Y. Li, Z. Wang, F. Yang and X. Yang, Chem. Commun., 2009, 5118–5120 RSC.
- J. H. Shen, Y. H. Zhu, X. L. Yang, J. Zong, J. M. Zhang and C. Z. Li, New J. Chem., 2012, 36, 97–101 RSC.
- F. Wang, M. Kreiter, B. He, S. P. Pang and C. Y. Liu, Chem. Commun., 2010, 46, 3309–3311 RSC.
- C. F. Wang, D. Sun, K. L. Zhuo, H. C. Zhang and J. J. Wang, RSC Adv., 2014, 4, 54060–54065 RSC.
- W. S. Hummers and R. E. Offeman, J. Am. Chem. Soc., 1958, 80, 1339 CrossRef CAS.
- C. Mattevi, G. Eda, S. Agnoli, S. Miller, K. A. Mkhoyan and O. Celik, et al., Adv. Funct. Mater., 2009, 19, 2577–2583 CrossRef CAS.
- J. P. Paraknowitsch, Y. J. Zhang, B. Wienert and A. Thomas, Chem. Commun., 2013, 49, 1208–1210 RSC.
- K. P. Gong, F. Du, Z. H. Xia, M. Durstock and L. M. Dai, Science, 2009, 323, 760–764 CrossRef CAS PubMed.
- S. Liu, J. Q. Tian, L. Wang, Y. W. Zhang, X. Y. Qin and Y. L. Luo, et al., Adv. Mater., 2012, 24, 2037–2041 CrossRef CAS PubMed.
- S. B. Yang, L. J. Zhi, K. Tang, X. L. Feng, J. Maier and K. Müllen, Adv. Funct. Mater., 2012, 22, 3634–3640 CrossRef CAS.
- Y. Dong, N. Zhou, X. Lin, J. Lin, L. Y. Chi and G. Chen, Chem. Mater., 2010, 22, 5895–5899 CrossRef CAS.
- K. P. Liu, J. J. Zhang, F. F. Cheng, T. T. Zheng, C. M. Wang and J. J. Zhu, J. Mater. Chem., 2011, 21, 12034–12040 RSC.
- H. Peng and J. Travas-Sejdic, Chem. Mater., 2009, 21, 5563–5565 CrossRef CAS.
- H. Fang, M. J. Fang and X. X. Liu, Chin. J. Inorg. Chem., 2005, 25, 466–469 CAS.
- J. Wang, C. F. Wang and S. Chen, Angew. Chem., Int. Ed., 2012, 51, 9297–9301 CrossRef CAS PubMed.
- H. T. Li, Z. H. Kang, Y. Liu and S. T. Lee, J. Mater. Chem., 2012, 22, 24230–24253 RSC.
- S. J. Zhu, J. H. Zhang, S. J. Tang, C. Y. Qiao, L. Wang and H. Y. Wang, et al., Adv. Funct. Mater., 2012, 22, 4732–4740 CrossRef CAS.
- J. Jiang, Y. He, S. Y. Li and H. Cui, Chem. Commun., 2012, 48, 9634–9636 RSC.
- X. T. Cao, J. Ma, Y. P. Lin, B. X. Yao, F. M. Li, W. Weng and X. C. Lin, Spectrochim. Acta, Part A, 2015, 151, 875–880 CrossRef CAS PubMed.
- S. Sahu, B. Behera, T. K. Maitib and S. Mohapatra, Chem. Commun., 2012, 48, 8835–8837 RSC.
- X. F. Jia, J. Lia and E. K. Wang, Nanoscale, 2012, 4, 5572–5575 RSC.
- Y. Li, Y. Hu, Y. Zhao, G. Q. Shi, L. E. Deng and Y. B. Hou, et al., Adv. Mater., 2011, 23, 776 CrossRef CAS PubMed.
- J. Shen, Y. Zhu, C. Chen, X. Yang and C. Li, Chem. Commun., 2011, 47, 2580–2582 RSC.
- W. B. Lu, X. Y. Qin, S. Liu, G. H. Chang, Y. W. Zhang and Y. L. Luo, et al., Anal. Chem., 2012, 84, 5351–5357 CrossRef CAS PubMed.
- H. Liu, T. Ye and C. Mao, Angew. Chem., Int. Ed., 2007, 46, 6473–6475 CrossRef CAS PubMed.
- Q. Wang, S. R. Zhang, H. G. Ge, G. H. Tian, N. N. Cao and Y. Q. Li, Sens. Actuators, B, 2015, 207, 25–33 CrossRef CAS.
- Y. Zhang, Y. H. He, P. P. Cui, X. T. Feng, L. Chen, Y. Z. Yang and X. G. Liu, RSC Adv, 2015, 5, 40393–40401 RSC.
- X. M. Li, S. L. Zhang, S. A. Kulinich, Y. L. Liu and H. B. Zeng, Sci. Rep., 2014, 4, 4976 CAS.
- F. Y. Yan, D. P. Kong, Y. M. Luo, Q. H. Ye, J. J. He, X. F. Guo and L. Chen, Mikrochim. Acta, 2016, 183, 1611–1618 CrossRef CAS.
- Y. X. Hou, Q. J. Lu, J. H. Deng, H. T. Li and Y. Y. Zhang, Anal. Chim. Acta, 2015, 866, 69–74 CrossRef CAS PubMed.
- J. Y. Hou, J. L. Li, J. C. Sun, S. Y. Ai and M. L. Wang, RSC Adv., 2014, 4, 37342–37348 RSC.
- X. Y. Qin, W. B. Lu and A. M. Asiri, et al., Sens. Actuators, B, 2013, 184, 156–162 CrossRef CAS.
- P. Zhang and W. Liu, Biomaterials, 2010, 31, 3087–3094 CrossRef CAS PubMed.
- T. M. Atkins, A. Thibert, D. S. Larsen, S. Dey, N. D. Browning and S. M. Kauzlarich, J. Am. Chem. Soc., 2011, 133, 20664–20667 CrossRef CAS PubMed.
- Y. Zhang, G. Hong, Y. Zhang, G. Chen, F. Li and H. Dai, et al., ACS Nano, 2012, 6, 3695–3702 CrossRef CAS PubMed.
- Y. M. Guo, Z. Wang, H. W. Shao and X. Y. Jiang, Carbon, 2013, 52, 583–589 CrossRef CAS.
- L. Zhou, Y. H. Lin, Z. Z. Huang, J. S. Ren and X. G. Qu, Chem. Commun., 2012, 48, 1147–1149 RSC.
- Y. Wang, S. H. Kim and L. Feng, Anal. Chim. Acta, 2015, 890, 134–142 CrossRef CAS PubMed.
- H. Huang, J. J. Lv, D. L. Zhou, N. Bao, Y. Xu and A. J. Wang, et al., RSC Adv., 2013, 3, 21691–21696 RSC.
- W. T. Wang, T. Kim, Z. F. Yan, G. S. Zhu, I. Cole, N. T. Nguyen and Q. Li, J. Colloid Interface Sci., 2015, 437, 28–34 CrossRef CAS PubMed.
- X. Cui, L. Zhu, J. Wu, Y. Hou, P. Wang, Z. Wang and M. Yang, Biosens. Bioelectron., 2015, 63, 506–512 CrossRef CAS PubMed.
- Y. D. Ruan, L. Wu and X. E. Jiang, Analyst, 2016, 141, 3313–3318 RSC.
- Z. S. Wu, M. K. Feng, X. X. Chen and X. J. Tang, J. Mater. Chem. B, 2016, 4, 2086–2089 RSC.
- Z. Y. Yan, X. C. Qu, Q. Q. Niu, C. Q. Tian, C. J. Fan and B. F. Ye, Anal. Methods, 2016, 8, 1565–1571 RSC.
- Z. Li, H. J. Yu, T. Bian, Y. F. Zhao, C. Zhou, L. Shang, Y. H. Liu, L. Z. Wu, C. H. Tung and T. R. Zhang, J. Mater. Chem. C, 2015, 3, 1922–1928 RSC.
- F. Chai, T. T. Wang, L. Li, H. Y. Liu, L. Y. Zhang and Z. M. Su, Nanoscale Res. Lett., 2010, 5, 1856–1860 CrossRef CAS PubMed.
- H. Wang, Y. X. Wang, J. Y. Jin and R. H. Yang, Anal. Chem., 2008, 80, 9021–9028 CrossRef CAS PubMed.
Footnotes |
| † Electronic supplementary information (ESI) available. See DOI: 10.1039/c6ra16357b |
| ‡ These authors have equal contributions. |
| This journal is © The Royal Society of Chemistry 2016 |

