Electrochromic/supercapacitive dual functional fibres†
Yang Zhou,
Yan Zhao,
Jian Fang and
Tong Lin*
Institute for Frontier Materials, Deakin University, Geelong, Victoria 3216, Australia. E-mail: tong.lin@deakin.edu.au
First published on 11th November 2016
Abstract
Wearable electronics have shown great potential to improve our lifestyle and health. Most of the wearable electronics developed so far are either yarn- or fabric-based. Single fibres integrated with electronic functions are highly desirable, but remain difficult to make. Here, we prove a single fibre, which has two electronic functions electrochromism and supercapacitor, with a novel device structure and its facile preparation. The device was prepared using a template method to generate two coil electrodes on the fibre surface, followed by electrochemical deposition of poly(3,4-ethylenedioxythiophene) on the electrode surface. An overlay of solid electrolyte was applied on the whole fibre. The fibre device showed a reversible electrochromic effect with fast response time (<5 s) at a potential of 0.6 V. It had a specific capacitance of 20.3 F g−1. The two functions happened simultaneously without interference with each other. Such an electronic fibre may find applications in wearable displays, personal power supplies and protective garments.
Introduction
Wearable electronics, which are clothing or fibre assemblies incorporated with electronic function, have exhibited great potential for applications in healthcare, personal electronics, communications, industry and defense.1–4 They are divided into two main categories such as aesthetic enhancement and performance oriented, with each of the categories having their own characteristics and application fields. Aesthetic enhancing wearables often have a colour changing or light emitting feature, designed to improve aesthetic appearance and visual impact.5–9 They are useful for making fashion clothing, decorations, information monitoring or personal devices where visual indication is needed.10–12 Performance oriented wearables focus on various electronic functions such as logic circuiting, computing, remote signal exchange, energy conversion or storage.13–21Considerable efforts have been devoted to incorporate an electronic component into a fibre assembly through physical attachment. It is highly desirable that the integration of electronic function can lead to intrinsically mutual reinforcement and multifunctional electronics largely add value to wearable electronics.22,23 For instance, the working state of a supercapacitor can be monitored through colour variation,24 and piezoelectric power can be stored through the addition of carbon-based supercapacitor.25
Wearable electronics are prepared based on three types of flexible electronic components: fibre, yarn and fabric. Fibres are considered as a promising material owing to the advantageous features, such as high aspect ratio (>50) and flexibility. Compared with yarn- or fabric-based electronics, fibre-based electronic devices have higher integration ability, versatility in forming multiple functions into a yarn or fabric through conventional braiding, weaving or knitting technique for instance. However, it remains difficult in the fabrication of fibre-shaped electronics owing to the delicate and fine nature.
Previous works on the development of fibre-shaped electronics have been mainly focused on either core–shell fibres or thread like electronic devices. The core–shell electronic fibres consist of a core electrode and a shell electrode, separated by an electroactive layer in between.25–30 They could suffer from low transparency and colour overlap caused by the opacity and coverage of shell electrode, which restricts their applications in display systems and solar cells. The thread like electronic devices are typically prepared by assembling different functional fibres into a yarn. For example, two conducting fibres were either wrapped onto another fibrous substrate or twisted together, and the assembly was then encapsulated with electrolyte.31–33 The main problems of these thread-like electronics are the vulnerability to physical deformation (e.g. untwisting, squeeze and friction between two fibre-shaped electrodes) and the possibility of short circuit during use.
In this study, we prove a single electronic fibre with a novel device structure and its facile preparation. The device was prepared by forming a coil electrode couple on single fibre using a template method. A layer of electroactive polymer was then deposited onto the electrode surface. Using poly(3,4-ethylenedioxythiophene) (PEDOT) as a electroactive substance model, we prove that the single fibre device can show dual electronic functions, electrochromism and supercapacitance. The fibre device showed a reversible electrochromic effect with fast response time (5 s) at a potential of 0.6 V. It has a specific capacitance of 20.3 mF mg−1. The as-prepared device exhibits high flexibility and it can be bent for many times without obvious loss of the performance. The two coil electrodes can be precisely arranged on fibre surface, and the dual functions can work simultaneously without interference with each other. PEDOT was selected owing to its good electrochromic properties such as fast response and comparatively lower bandgap.34,35 Meanwhile, PEDOT has been considered as an ideal candidate for electrochemical supercapacitor because of its doping/de-doping property and chemical stability.36,37
Experimental
Materials
3,4-Ethylenedioxythiophene (EDOT), poly(methyl methacrylate) (PMMA), propylene carbonate (PC), and lithium perchloride (LiClO4) were purchased from Sigma-Aldrich. PVC wires of 2 mm diameter were purchased from local electronics store (Jaycar electronics).Preparation of single fibre-based device
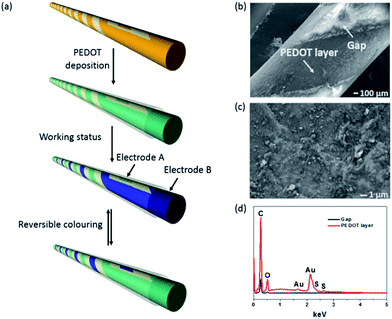
A template method was used to form two parallel coil electrodes on a single fibre. The procedure for producing the fibre based device is illustrated in Fig. 1a. In brief, four strips of adhesive tapes were closely wrapped onto the fibre substrate, followed by removing two of the strips from the fibre. A thin layer of gold was then sputter-coated onto the exposed fibre surface. To ensure deposition of gold on all the exposed surface, the sputter-coating was performed for a few times with the fibre rotated by a certain angle each time. After the rest adhesive tapes were removed off, the fibre with two parallel coil-shaped gold electrodes was ready for making a fibre device. PEDOT was coated on the gold electrodes through electrical polymerization in a three electrode cell. The PEDOT layer looked transparent blue itself, and its coating on gold electrode showed a mixture of bluish and golden colours. The electropolymerization was conducted in a PC solution containing 0.1 M LiClO4 and 0.04 M EDOT monomer, with the coil-structured gold electrode as working electrode, platinum plate (2 cm × 2 cm) as counter electrode and Ag/AgCl standard electrode as reference. A potential of 1.3 V was potentiostatically applied to generate a light blue polymer layer on gold electrode. After 20 s of electropolymerization, the fibre was rinsed with deionized water and ethanol three times to remove residues, and dried in a 50 °C vacuum oven for 12 hours. Finally, a thin layer of gel electrolyte containing 1 M LiClO4 in a mixture of PC and acetone (2![[thin space (1/6-em)]](https://www.rsc.org/images/entities/char_2009.gif) :
:![[thin space (1/6-em)]](https://www.rsc.org/images/entities/char_2009.gif) 3 in volume) was coated onto the whole fibre. After drying in a vacuum oven at room temperature for 24 hours, the fibre device was ready for testing.
3 in volume) was coated onto the whole fibre. After drying in a vacuum oven at room temperature for 24 hours, the fibre device was ready for testing.
Characterizations
Scanning electron microscopy (SEM) and energy dispersive X-ray (EDX) were performed with a Zeiss Supra 55VP scanning electron microscope. Cyclic voltammetry and galvanostatic charge–discharge characterizations were conducted on a CHI 660 electrochemical workstation. Ocean Optics USB4000 UV-visible spectrometer was employed to characterize electrochromic performance of as-prepared fibre device, where DH-2000-BAL deuterium–halogen (Mikropack) was used as a light source. Finite element method (FEM) modelling was performed by using COMSOL Multiphysics®. AC/DC module is used for electric potential simulation. The detailed parameters of materials and models are listed in ESI.†Results and discussion
Fig. 1b shows the surface morphology of the PEDOT-coated gold electrode and the uncoated gap between two gold electrodes. The enlarged SEM view in Fig. 1c shows that the PEDOT layer was rough and composed of some micro-particles on the surface. These micro-particles were absent from the gold coating surface (see Fig. S1 in ESI†). Fig. 1d shows the energy dispersive X-ray (EDX) spectra taken from the PEDOT-coated gold electrode and the gap between two electrodes. Element S appeared on the PEDOT coated Au electrode surface but not in the gap area, confirming that PEDOT was only coated on Au electrode. The PEDOT layer was also verified by FTIR and Raman measurement (see Fig. S2 in ESI†). Fig. 2a shows the colour change of the fibre device when the PEDOT-coated electrodes are connected to an external power supply. At 0 V, the electrodes showed natural gold colour. When the potential switched from 0 V to 0.6 V, the PEDOT coated on cathode turned dark blue, while the anode showed no change in colour. When the bias potential was switched to a reverse direction, the cathode electrode in dark blue restored the natural gold colour, while the other electrode in natural gold changed to dark blue. All these colour changes were reversible and can take place for many cycles. These results clearly indicate that the single fibre device has an electrochromic feature. It is noted that the above chromatic transitions happened even if the fibre device was bent.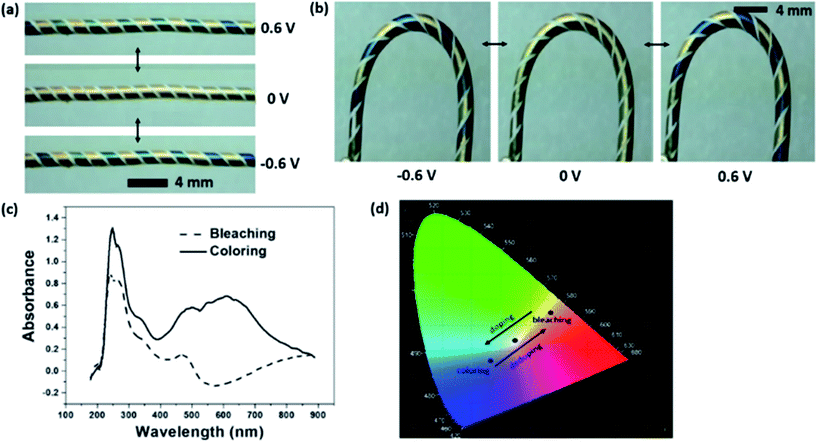 | ||
| Fig. 2 (a) Digital photos to show the single fibre device at colourized and decolourized states. (b) Electrochromic transition when the device at a bending state (videos of device under straight and bending states have been provided in ESI†). (c) Optical absorbance spectra of the single fibre device at the electrochromic colouration and decolouration states (d) coordination of colour at decolourized (0.46, 0.44) and coloured (0.28, 0.25) states (obtained through CIE1931 chromaticity diagram). | ||
Fig. 2b illustrates the electrochromic transition when the device was in a “U” shape, suggesting that the fibre device works flexibly in different shapes. Fig. 2c shows the optical absorbance spectra of the fibre device at the colouration and decolouration conditions. There appeared an absorption peak at 610 nm during colouration, which corresponds to the dark blue colour of the PEDOT layer.38 The chromaticity diagram (CIE 1931) based on the standard D65 illuminant was employed to measure the digital colours. As shown in Fig. 2d, the PEDOT coated gold electrode at normal state showed a natural gold appearance, and the coordination (x, y) was (0.28, 0.25) with a colour purity of 0.26. When the electrode was at colouration state, which is dark blue, the coordination and colour purity were (0.46, 0.44) and 0.71, respectively.
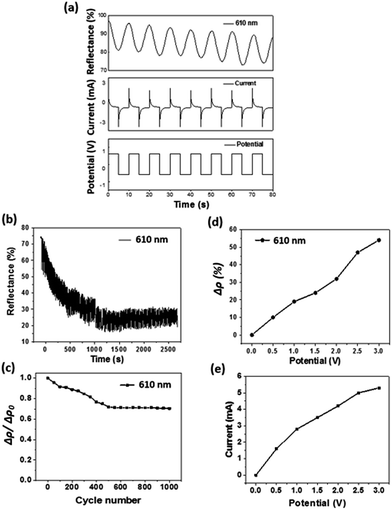
The electrochromic switching behaviour of the fibre device is depicted in Fig. 3a. When a square wave potential (±0.6 V) was applied at 5 seconds interval, the relative reflectance difference at wavelength of 610 nm (Δρ) reduced to approximately 25% of the decolour state. A current decrease at the inception was observed in the current–time curve. This was caused by the depletion of electroactive species, indicating the occurrence of redox reaction. The redox reaction reached an equilibrium when the current dropped to a constant level. The overall Δρ also reduced gradually with increasing the scan numbers.
The time required for the electrochromic device to achieve 90% of Δρ after switching from normal non-colour state to full colourized state, which is also referred to as “colouration time” can be calculated based on Fig. 3a as 3.6 s (Tcolouring (90%)). Similarly, the time required for restoring 90% of Δρ from the colourized to the non-colour state, also referred to as “bleaching time”, was calculated as 4.2 s (Tbleaching (90%)). The specific colouration efficiency (η, cm2 C−1) was calculated according to the equation:39
 | (1) |
The stability of electrochromic property is important for practical applications. Fig. 3b shows the optical reflectance change of the electrochromic device during repeated colourization–decolouration transition (±0.6 V square wave, 5 s for each direction). The overall reflectance reduced with increasing the numbers of electrochromic transition. After 250 cycles of the electrochromic transition, the overall reflectance difference dropped from 16 to 11.2%. Fig. 3c further shows the drop of Δρ after 1000 cycles of colouration and decolouration, being approximately 30%, indicating the reasonable stability of our device. The performance loss can be attributed to the repeating doping/de-doping process of the PEDOT layer, which causes degradation of PEDOT.42,43 The degradation of active layer also resulted in slight decrease in the current as well.
When conducting polymers undertake multicycles of redox reaction, two major changes could take place: (1) entrapping of dopant within polymer matrix, which blocks further redox reaction;44 (2) dimensional contrast between the doped and de-doped stated, which results in detachment from the metal substrate.45–47
To find out the performance loss in our fibre devices, we observed the morphology and element profile of the PEDOT layer before and after 1000 cycles of cyclic voltammetry scans. Indeed, some PEDOTs detached from PEDOT layer after the repeated scans, and element Cl appeared in the de-doped PEDOT (see Fig. S3 and S4 in the ESI†). These results suggest that the performance decay comes from both physical damage and entrapping of dopant within the PEDOT structure. Additionally, the volatilization of acetone used as a solvent in gel electrolyte also limits the ions transfer and increases the electric resistance as time goes on.
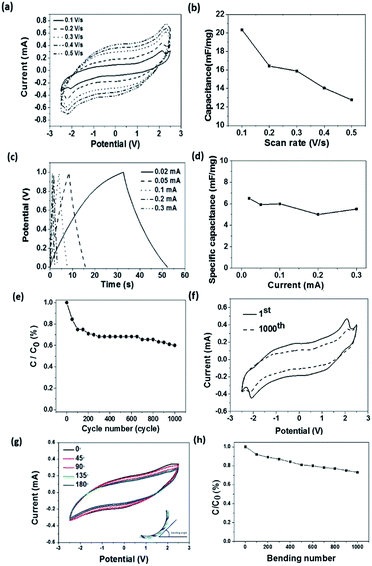
The applied potential showed an effect on the reflectance property. Here, the reflectance difference before and after colouration (Δρ) at the same wavelength was used to measure the colour change. With increasing the applied potential, the working current and the Δρ both increased (Fig. 3d). This can be explained as higher current facilitates the redox reactions. More PEDOT molecules participated in the redox reaction results in more intensive colour changes. Correspondingly, the current passed through also increased with increasing the applied potential (Fig. 3e). During the electrochromic transition, the fibre device also showed supercapacitance feature. Fig. 4a shows the cyclic voltammetry (CV) curves of the fibre-based device at scan rates in the range of 0.1–0.5 V s−1. The redox peaks were found at approximately −2.1 V and 2.2 V. It is noticeable that the potential window here is relatively wider when comparing with other PEDOT-based electrochromic devices and this might be caused by the lower ion mobility (10−2 S cm−1) of the gel electrolyte than that (10−3 S cm−1) of its liquid counterparts.48
Based on the CV curves, the specific capacitance (Cs, F g−1) of the device can be calculated by the equation:49
 | (2) |
 refers to the integration area of the positive and negative sweeps in a CV curve, v is the potential scan rate (V s−1), m is the total mass of electroactive materials over two electrodes, and ΔV is the potential difference. The corresponding specific capacitance at various scan rates is shown in Fig. 4b. The specific capacitance decreased with increasing the scan rate, from 0.1 V s−1 to 0.5 V s−1.
Fig. 4c shows the galvanostatic charge–discharge profile of the fibre-shaped device. The device was charged and discharged within a potential range from 0 to 1.0 V under five different current levels (i.e., 0.02, 0.05, 0.1, 0.2 and 0.3 mA). The specific capacitance (mF mg−1) of the device was calculated as follows:49
 | (3) |
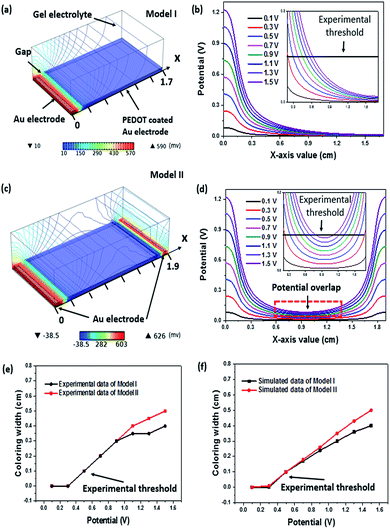
The supercapacitor stability was examined by repeating the charge–discharge scan for 1000 cycles. The corresponding capacitance loss was plotted in Fig. 4e, where a 30% capacitance loss after 1000 cycle times resulted, which is in agreement with the Δρ loss and this should be originated from the over-oxidation of the PEDOT layer during redox reaction. Despite the device capacitance loss after repeated scans, the redox peaks in the CV curve were still observable at −2.1 V and 2.2 V after 1000 cycles of charging and discharging (Fig. 4f). During charging–discharging process, the device simultaneously showed colour change. The stability of this electrochromic property during charging–discharging process was studied by recording the reflectance difference loss. Similar to the above mentioned result, over 80% Δρ was maintained after 1000 cycles of charging–discharging at 0.1 mA (see ESI, Fig. S5†). The bending test has been conducted to demonstrate the flexibility of the fibrous device. As shown in Fig. 4g, the CV curves of device were depicted when it was bent into various angles ranging from 0° to 180°. It can be clearly seen that the bending angle had little effect on its capacitance performance. The stability test result of the device is shown in Fig. 4h, which reveals that 73% of the capacitance could be maintained after 1000 bending cycles at a bending angle of 90°. It is believed that the capacitance loss was predominately attributed to the physical deformation of electrode materials caused by repeated bending. Electrochromic effect occurs only if the electric potential is above a critical value. Electrode geometry should affect the electric potential profile in the device. To calculate the electric potential distribution (i.e., 0.6 V), we used a finite element method (COMSOL Multiphysics) to analyse two models, model I and model II, as indicated in Fig. 5. In model I, a pair of metal strips were used as electrodes and the wider electrode was coated with PEDOT. An electrolyte gel layer was covered on the entire top of the electrodes and gap. The width of gap between the two electrodes, gold electrode and PEDOT coated electrode was set as 0.1 cm, 0.1 cm, or 1.5 cm, respectively. Fig. 5a shows the electric potential distribution profile over the PEDOT coated Au electrodes. Under an external voltage, the electric potential at the edge of the electrodes was significantly higher than that in the gap area and the middle part of the electrode. Fig. 5b also shows the potential distribution along the x axis (from x = 0 to x = 1.7 cm) when the potential applied on Au electrode varies from 0.1 V to 1.5 V. The inset shows an enlarged view of the PEDOT coated electrode from x = 0.2 to x = 1.6. Higher potential applied on the Au electrode results in larger area on PEDOT coated electrode that can reach a certain potential threshold. In model II, a double counter electrodes structure was used to analyse the potential distribution (Fig. 5c). Such an electrode structure is similar to the one that was used for making single fibre device. Fig. 5d shows the potential distribution along x-axis when a potential (0.1–1.5 V) is simultaneously applied on the two Au electrodes. It is worthy to note that potential overlap occurs on the PEDOT coated Au electrode, leading to higher potential when compared with model I.
We also conducted an experiment using models with dimensions which are identical to those of the model I and model II. The colouration width of the PEDOT coated Au electrode was recorded when applied potential (0.1–1.5 V) on Au electrode (Fig. 5e). According to our experiment, a potential threshold at 0.5 V was observed where electrochromism will occur when the potential applied on Au electrode is above that threshold, otherwise the device will remain unchanged. Assuming the threshold is still valid in our simulated models, a straight line that simulates the relationship between applied potential and colouration width can be plotted. Accordingly, any value of potential on PEDOT coated electrode above that threshold is able to drive the PEDOT to undergo a colouration transition. The x-axis values of intersection of potential curve and threshold can be regarded as the width of colouration area under different potentials. For instance, in Fig. 5b, the potential curve of 0.7 V intersects threshold at the point (x = 0.37, y = 0.1) suggesting that the colouring width of PEDOT coated electrode is 0.17 cm (after subtracting 0.1 cm Au electrode and 0.1 cm gap width). Based on above assumptions, the calculated colouring width in model I and II is plotted in Fig. 5f. These results agreed well with the experimental results in Fig. 5c. Both the simulated and experimental data curves are positively sloped and they show a similar trend. This relationship between potential and colouring width implies that we can maximize the colouration electrode and minimize the counter electrode simultaneously and therefore improve the visual effect of device.
Conclusion
We have prepared a single fibre device with electrochromic and energy storage functions. The two concurrent functions are both based on the redox property of PEDOT, but they do not interfere with each other. The fibre device shows colouring/bleaching time less than 5 s useful for making electrochromic fabrics or flexible electrochromic devices. When used as supercapacitors, the electrochromic feature functions like an indicator for the capacitive performance.Acknowledgements
Funding support from Australian Research Council (ARC) through a Discovery Project (ARC DP140100079) is acknowledged.Notes and references
- W. Zeng, L. Shu, Q. Li, S. Chen, F. Wang and X. M. Tao, Adv. Mater., 2014, 26, 5310–5336 CrossRef CAS PubMed.
- M. Stoppa and A. Chiolerio, Sensors, 2014, 14, 11957–11992 CrossRef CAS PubMed.
- Z. T. Zhang, K. P. Guo, Y. M. Li, X. Y. Li, G. Z. Guan, H. P. Li, Y. F. Luo, F. Y. Zhao, Q. Zhang, B. Wei, Q. B. Pei and H. S. Peng, Nat. Photonics, 2015, 9, 233–238 CrossRef CAS.
- S. Hong, H. Lee, J. Lee, J. Kwon, S. Han, Y. D. Suh, H. Cho, J. Shin, J. Yeo and S. H. Ko, Adv. Mater., 2015, 27, 4744–4751 CrossRef CAS PubMed.
- G. F. Wang, X. M. Tao and H. M. Huang, Color. Technol., 2005, 121, 132–138 CAS.
- C. Y. Yan, W. B. Kang, J. X. Wang, M. Q. Cui, X. Wang, C. Y. Foo, K. J. Chee and P. S. Lee, ACS Nano, 2014, 8, 316–322 CrossRef CAS PubMed.
- M. A. Invernale, Y. J. Ding and G. A. Sotzing, Color. Technol., 2011, 127, 167–172 CAS.
- G. X. Huang, L. M. Liu, R. Wang, J. Zhang, X. M. Sun and H. S. Peng, J. Mater. Chem. C, 2016, 4, 7589–7594 RSC.
- F. M. Kelly, L. Meunier, C. Cochrane and V. Koncar, Displays, 2013, 34, 1–7 CrossRef CAS.
- A. Gonzalez, N. Galvez, M. Clemente-Leon and J. M. Dominguez-Vera, Chem. Commun., 2015, 51, 10119–10122 RSC.
- M. Porcel-Valenzuela, J. Ballesta-Claver, I. de Orbe-Paya, F. Montilla and L. F. Capitan-Vallvey, J. Electroanal. Chem., 2015, 738, 162–169 CrossRef CAS.
- A. Laforgue, J. Mater. Chem., 2010, 20, 8233–8235 RSC.
- L. B. Qiu, S. S. He, J. H. Yang, F. Jin, J. Deng, H. Sun, X. L. Cheng, G. Z. Guan, X. M. Sun, H. B. Zhao and H. S. Peng, J. Mater. Chem. A, 2016, 4, 10105–10109 CAS.
- M. Hamedi, L. Herlogsson, X. Crispin, R. Marcilla, M. Berggren and O. Inganas, Adv. Mater., 2009, 21, 573–577 CrossRef CAS PubMed.
- M. Hamedi, R. Forchheimer and O. Inganas, Nat. Mater., 2007, 6, 357–362 CrossRef CAS PubMed.
- Y. Qin, X. D. Wang and Z. L. Wang, Nature, 2008, 451, 809–813 CrossRef CAS PubMed.
- Y. Zhang, Y. H. Wang, L. Wang, C. M. Lo, Y. Zhao, Y. D. Jiao, G. F. Zheng and H. S. Peng, J. Mater. Chem. A, 2016, 4, 9002–9008 CAS.
- X. Yu, J. Pan, J. Deng, J. Zhou, X. Sun and H. Peng, Adv. Mater., 2016 DOI:10.1002/adma.201603206.
- Y. N. Meng, Y. Zhao, C. G. Hu, H. H. Cheng, Y. Hu, Z. P. Zhang, G. Q. Shi and L. T. Qu, Adv. Mater., 2013, 25, 2326–2331 CrossRef CAS PubMed.
- S. H. Aboutalebi, R. Jalili, D. Esrafilzadeh, M. Salari, Z. Gholamvand, S. A. Yamini, K. Konstantinov, R. L. Shepherd, J. Chen, S. E. Moulton, P. C. Innis, A. I. Minett, J. M. Razal and G. G. Wallace, ACS Nano, 2014, 8, 2456–2466 CrossRef CAS PubMed.
- J. W. Zhong, Y. Zhang, Q. Z. Zhong, Q. Y. Hu, B. Hu, Z. L. Wang and J. Zhou, ACS Nano, 2014, 8, 6273–6280 CrossRef CAS PubMed.
- Y. H. Wang, K. Bian, C. G. Hu, Z. P. Zhang, N. Chen, H. M. Zhang and L. T. Qu, Electrochem. Commun., 2013, 35, 49–52 CrossRef CAS.
- D. Son, J. Lee, S. Qiao, R. Ghaffari, J. Kim, J. E. Lee, C. Song, S. J. Kim, D. J. Lee, S. W. Jun, S. Yang, M. Park, J. Shin, K. Do, M. Lee, K. Kang, C. S. Hwang, N. S. Lu, T. Hyeon and D. H. Kim, Nat. Nanotechnol., 2014, 9, 397–404 CrossRef CAS PubMed.
- X. Chen, H. Lin, J. Deng, Y. Zhang, X. Sun, P. Chen, X. Fang, Z. Zhang, G. Guan and H. Peng, Adv. Mater., 2014, 26, 8126–8132 CrossRef CAS PubMed.
- J. Bae, Y. J. Park, M. Lee, S. N. Cha, Y. J. Choi, C. S. Lee, J. M. Kim and Z. L. Wang, Adv. Mater., 2011, 23, 3446–3449 CrossRef CAS PubMed.
- C. F. Pan, Z. T. Li, W. X. Guo, J. Zhu and Z. L. Wang, Angew. Chem., Int. Ed., 2011, 50, 11192–11196 CrossRef CAS PubMed.
- T. Chen, L. B. Qiu, Z. B. Yang, Z. B. Cai, J. Ren, H. P. Li, H. J. Lin, X. M. Sun and H. S. Peng, Angew. Chem., Int. Ed., 2012, 51, 11977–11980 CrossRef CAS PubMed.
- L. B. Qiu, J. Deng, X. Lu, Z. B. Yang and H. S. Peng, Angew. Chem., Int. Ed., 2014, 53, 10425–10428 CrossRef CAS PubMed.
- D. Harrison, F. L. Qiu, J. Fyson, Y. M. Xu, P. Evans and D. Southee, Phys. Chem. Chem. Phys., 2013, 15, 12215–12219 RSC.
- G. J. Huang, C. Y. Hou, Y. L. Shao, B. J. Zhu, B. P. Jia, H. Z. Wang, Q. H. Zhang and Y. G. Li, Nano Energy, 2015, 12, 26–32 CrossRef CAS.
- T. Chen, L. B. Qiu, Z. B. Yang and H. S. Peng, Chem. Soc. Rev., 2013, 42, 5031–5041 RSC.
- H. Sun, X. You, J. Deng, X. L. Chen, Z. B. Yang, P. N. Chen, X. Fang and H. S. Peng, Angew. Chem., Int. Ed., 2014, 53, 6664–6668 CrossRef CAS PubMed.
- J. Bae, M. K. Song, Y. J. Park, J. M. Kim, M. L. Liu and Z. L. Wang, Angew. Chem., Int. Ed., 2011, 50, 1683–1687 CrossRef CAS PubMed.
- G. Sonmez, H. B. Sonmez, C. K. E. Shen and F. Wudl, Adv. Mater., 2004, 16, 1905–1908 CrossRef CAS.
- J. K. Xu, G. M. Nie, S. S. Zhang, X. J. Han, J. Hou and S. Z. Pu, J. Mater. Sci., 2005, 40, 2867–2873 CrossRef CAS.
- L. Ran, C. Seung II and L. Sang Bok, Nanotechnology, 2008, 19, 215710 CrossRef PubMed.
- A. Laforgue, J. Power Sources, 2011, 196, 559–564 CrossRef CAS.
- R. Pacios, R. Marcilla, C. Pozo-Gonzalo, J. A. Pomposo, H. Grande, J. Aizpurua and D. Mecerreyes, J. Nanosci. Nanotechnol., 2007, 7, 2938–2941 CrossRef CAS PubMed.
- C. L. Gaupp, D. M. Welsh, R. D. Rauh and J. R. Reynolds, Chem. Mater., 2002, 14, 3964–3970 CrossRef CAS.
- A. A. Argun, P.-H. Aubert, B. C. Thompson, I. Schwendeman, C. L. Gaupp, J. Hwang, N. J. Pinto, D. B. Tanner, A. G. MacDiarmid and J. R. Reynolds, Chem. Mater., 2004, 16, 4401–4412 CrossRef CAS.
- L. Groenendaal, G. Zotti, P. H. Aubert, S. M. Waybright and J. R. Reynolds, Adv. Mater., 2003, 15, 855–879 CrossRef CAS.
- K. Lota, V. Khomenko and E. Frackowiak, J. Phys. Chem. Solids, 2004, 65, 295–301 CrossRef CAS.
- U. Abaci, H. Y. Guney and U. Kadiroglu, Electrochim. Acta, 2013, 96, 214–224 CrossRef CAS.
- J. H. Huang, C. Y. Hsu, C. W. Hu, C. W. Chu and K. C. Ho, ACS Appl. Mater. Interfaces, 2010, 2, 351–359 CAS.
- J. Ding, D. Z. Zhou, G. Spinks, G. Wallace, S. Forsyth, M. Forsyth and D. R. MacFarlane, Chem. Mater., 2003, 15, 2392–2398 CrossRef CAS.
- P. Camurlu, E. Sahmetlioglu, E. Sahin, I. M. Akhmedov, C. Tanyeli and L. Toppare, Thin Solid Films, 2008, 516, 4139–4144 CrossRef CAS.
- D. E. Labaye, C. Jerome, V. M. Geskin, P. Louette, R. Lazzaroni, L. Martinot and R. Jerome, Langmuir, 2002, 18, 5222–5230 CrossRef CAS.
- M. Deepa, N. Sharma, S. A. Agnihotry, S. Singh, T. Lal and R. Chandra, Solid State Ionics, 2002, 152, 253–258 CrossRef.
- S. J. Shi, X. P. Zhuang, B. W. Cheng and X. Q. Wang, J. Mater. Chem. A, 2013, 1, 13779–13788 CAS.
Footnote |
| † Electronic supplementary information (ESI) available: Mass and surface area calculation of electroactive materials, Raman and FTIR spectra, COMSOL Multiphysics® parameters. See DOI: 10.1039/c6ra20729d |
| This journal is © The Royal Society of Chemistry 2016 |

