One-step preparation of carbon dot-grafted trisodium citrate dihydrate for tunable photoluminescence and white light-emitting diodes†
Jiangling He‡
,
Youling He‡,
Yonghao Chen ,
Bingfu Lei*,
Haoran Zhang,
Jianle Zhuang,
Mingtao Zheng and
Yingliang Liu*
Guangdong Provincial Engineering Technology Research Center for Optical Agricultural, College of Materials and Energy, South China Agricultural University, Guang Zhou, 510642, P. R. China. E-mail: tleibf@scau.edu.cn; tliuyl@scau.edu.cn
First published on 27th October 2016
Abstract
Here we introduce an approach to prepare air-stable blue-light-emitting carbon dots (B-CDs) grafted trisodium citrate dihydrate (SC) at 200 °C with yields up to 93.0%. After annealing for 20 minutes at 200 °C, these CDs/SC present yellow-light-emitting CDs/SC (Y-CDs/SC) under UV excitation. CDs grafted SC namely CDs/SC, which can be synthesized via one-step solvent thermal method. The luminescence origins of B-CDs/SCs and Y-CDs/SCs are from two different types of CDs, which can be embedded in solid matrices (SC) to realize solid state fluorescence of CD-based composites. By tuning the mass ratio of B-CDs/SC to Y-CDs/SC, the color of the luminescence can be systematically tailored from greenish-yellow (0.333, 0.358) to light-blue (0.243, 0.247), or by adjusting the excitation wavelength, the color of the luminescence can also be regulated. Moreover, both B-CDs/SC and Y-CDs/SC are favorably used in white light-emitting diodes (WLEDs).
1. Introduction
Stable and multicolor luminescent materials have attracted increasing attention due to their potential and wide applications in multiplexed biological labeling, flexible full-color displays, and next generation lighting sources. The use of these materials is aimed at generating of energy-saving light sources and low-cost.1 And it is of great benefit to achieve tunable color based on the same luminescent component with a single wavelength excitation. Recently, a variety of multicolor luminescent materials were reported, such as fluorescent organic dyes,2 rare-earth metal based nanoparticles,3 polymer dots,4 semiconductor quantum dots,5 and molecular nanomaterials.6 Nevertheless, poor water solubility, complicated preparation procedures, and potential for photobleaching have seriously hindered the practical applications of these nanomaterials.2–6 Meanwhile, high yield can effectively make them suitable for industrial production and brings great commercial profit. Therefore, it is still urgent to discover low-toxicity, environmentally friendly, and high yield materials with excellent properties for applications.Fluorescent carbon dots (CDs), which stand out as a fascinating member of fluorescence-based nanoparticles, have been dredged up as an outstanding substitute to traditional metal-based quantum dots (QDs) due to their excellent properties, such as their chemical inertness, high biocompatibility, low cytotoxicity, and attractive photoluminescence (PL) properties.7–11 However, until now, quite few reports have mentioned the pure CDs with efficient fluorescence in solid state. The realization of highly efficient solid-state light emissive nanomaterials still remains a challenge, because of the PL quenching of luminophores that are transferred from their parent colloidal solutions into the solid-state matrices, this is mainly due to the aggregation of CDs.12 A functional way to fix fluorescence is to embed fluorescent dopants in solid matrices such as starch,13 silica xerogel,14 and polymer.15 These assembled systems are constituted by previously prepared CDs and solid matrices.13–15 Thus, it is highly desirable to develop facile method for the fabrication of such systems.
LEDs (light-emitting diodes) have been recognized as one of the energy efficient technologies with high performance and long-term stability.16–19 And LEDs still attract keen research attention because of their long working life, compact size, and remarkable energy conservation.20 LEDs have been widely used in various fields, such as full-color displays, liquid crystal back lighting, traffic signals, and cell phones. And now fluorescent nanomaterials have become one of the most prospective candidates for these devices. In general, the white light is obtained easily via a combination of leaked blue emissions through the phosphor layers from the blue LED chip and the broad green-yellow emissions of yellow phosphors, or the combined multi-color emissions of green/red or green/amber/red phosphors.16,21–23 White LEDs (WLEDs) based on fluorescent materials as color converts deposited on blue or UV diode chips can easily acquire high color quality, these fluorescent nanomaterials, including nanocrystal quantum dots, carbon nanoparticles, graphene quantum dots, silicon quantum dots and organic–inorganic fluorescent nanocomposites. Most phosphors packaged in LED devices containing rare-earth element or semiconductor quantum dots, which are high-cost and not environment-friendly. In other words, to realize high efficiency of devices, it generally, however, complicates the process and then leads to high cost. Thus, it is unavoidable and valuable to find the perfect method for overcoming these difficulties.
In our work, one-step preparation process of CDs grafted environment-friendly fluorescent trisodium citrate dihydrate (SC) has been reported. CDs grafted SC can show obvious fluorescence under UV light. WLEDs can be successfully fabricated based on UV chip (395 nm), blue-light-emitting CDs/SC (B-CDs/SC) and yellow-light-emitting CDs/SC (Y-CDs/SC). On one hand, by adjusting the mass ratio of B-CDs/SC to Y-CDs/SC, the photoluminescent (PL) emitting color can be systematically tailored, especially white emission can be gained. WLEDs using an UV chip (395 nm) precoated with B-CDs/SC and Y-CDs/SC were fabricated and their PL properties were investigated. The proposed efficient one-step synthetic method is expected to open up a brand-new avenue to synthesize fluorescent nanomaterials, metal semiconductor, or other nanocrystals.
2. Experimental methods
2.1 Materials and chemical regents
N-(β-Aminoethyl)-γ-aminopropyl (AEAPMS, KH-602), which was purchased from Beijing Shenda Fine Chemical Co., Ltd (Beijing, China), was of industrial reagent grade. Trisodium citrate dehydrate (C6H5Na3O7·2H2O), ethylenediamine, and petroleum ether, which were of analytical reagent, were purchased from Aladdin Shanghai, China. And the deionized water, which was used in all experiments, was supplied by a Water Purifier Nano pure water system (Master-E, Hitech-sciencetool, Shanghai, China).2.2 Synthesis of B-CDs/SC
1.2 g of trisodium citrate dihydrate was added to 10 mL AEAPMS to form the transparent solution. The mixed solution was then transferred into a poly(para-phenol)-lined stainless steel autoclave and heated at 200 °C for 5 h, white precipitate existing in the obtained solution was collected through centrifugal separation at the speed of 15![[thin space (1/6-em)]](https://www.rsc.org/images/entities/char_2009.gif) 000 rpm for 15 min and then with vacuum filtration using oiliness film of 0.2 μm aperture. The collected white precipitate was washed three times with petroleum ether, dried at 60 °C for one day, and then ground into powders, which can show blue emission under UV light.
000 rpm for 15 min and then with vacuum filtration using oiliness film of 0.2 μm aperture. The collected white precipitate was washed three times with petroleum ether, dried at 60 °C for one day, and then ground into powders, which can show blue emission under UV light.
2.3 Synthesis of Y-CDs/SC
The prepared CDs/SC was annealed at 200 °C for 20 minutes, the obtained powder can successfully show yellow-light-emitting under UV light.2.4 Extraction of CDs solution
Solutions were obtained after B-CDs/SC and Y-CDs/SC dissolved in deionized water, which were light brown and transparent, then they were subjected to dialysis with a filter membrane with molecular weight cut off (MWCO: 1000) against water for two days to remove compounds. Then pure CDs solutions were obtained.2.5 Fabrication of (B-CDs/SC and Y-CDs/SC)-based LEDs
To fabricate the LEDs, B-CDs/SC and Y-CDs/SC were mixed first by grinding for 20 minutes, and then the mixed powders were blended with epoxy resin to be precoated on the LED chip. Then a drop of ethylenediamine was used to fix the whole devices.2.6 Characterizations
The X-ray diffraction (XRD) patterns were recorded using power X-ray diffraction (MSAL XD-2, Beijing, China) with Cu Kα (Kα1 = 0.15405 nm) irradiation and operating at 36 kV and 30 mA with a scanning step of 0.02° (2θ) and a scanning speed of 8° per min. The Fourier transform infrared spectroscopy (FTIR) spectra were taken on a Nicolet Avatar 360 FT-IR spectrophotometer. Transmission electron microscopy (TEM) images were recorded with a FEI Tecnai 12 transmission electron microscope. Fluorescence spectra and electroluminescence (EL) spectra were measured with fluorescence spectrophotometer (Hitachi Model F-7000) equipped with the 150 W xenon lamp as the excitation source and operated at the room temperature. High resolution TEM (HRTEM) measurements were performed on an electronic microscopy (Tecnai G2 F20S-TWIN 200 kV). X-ray photoelectron spectroscopy (XPS) was detected by employing an X-ray photoelectron spectroscope (AXIS ULTRA DLD, Kratos). The elemental compositions and morphologies were characterized by a field emission scanning electron microscope (FE-SEM, Quanta F400) equipped with an energy dispersive X-ray spectroscopy (EDX) detector.3. Results and discussion
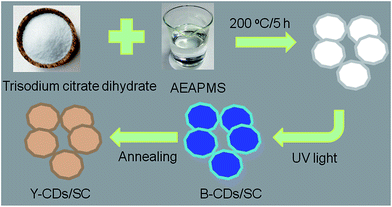
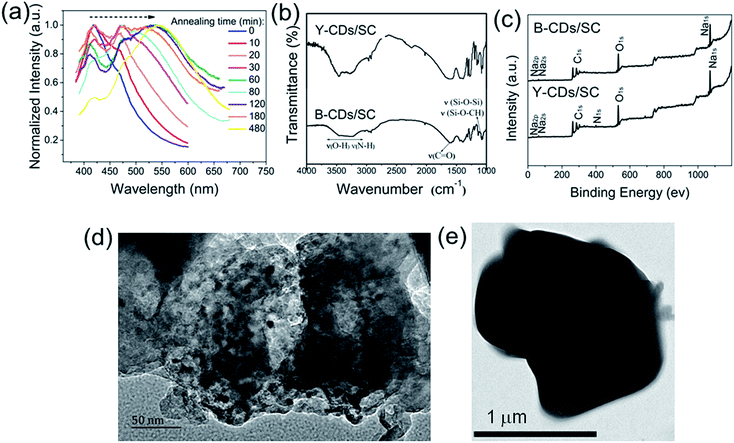
The formation mechanism of the B-CDs/SC and Y-CDs/SC is schematically illustrated in Fig. 1. After a series of experiments were done, the optimal reaction temperature, reaction time, and the ratio of reaction reagents have successfully been confirmed. As shown in Fig. S1, and S2 (ESI†), the best reaction temperature and the optimum reaction time are 200 °C and 5 h, respectively. When various amounts of trisodium citrate dihydrate reacted with 10 mL of AEAPMS, a great difference in the emission spectra can be observed, the fluorescence intensity reached to the maximum when the amount of trisodium citrate dihydrate is 1.2 g (Fig. S3, ESI†). The as-prepared nanomaterials can maintain excellent stability in multiple solvents (Fig. S4, ESI†).The fluorescent nanomaterials are currently of significant fundamental and technical interest because of their flexible chemical processability and unique size-dependent properties.24 And annealing can effectively change the size of the particles.25,26 A series of photoluminescent materials with various annealing time are obtained. The multiple emitting color can be easily controlled with different annealing time range from 0 to 480 min. These materials show obvious red shift changing from blue to yellow with the extension of annealing changing time (Fig. 2a). The FTIR spectra shown in Fig. 2b reveal that all B-CDs/SC and Y-CDs/SC samples possessed abundant hydrophilic groups on their surface including of O–H (3426 cm−1), N–H (3205 cm−1), which insure their good solubility in water.27 Abundant oxygen-containing groups including carbonyl (ν(C![[double bond, length as m-dash]](https://www.rsc.org/images/entities/char_e001.gif) O), 1630 cm−1), Si–O–Si and Si–O–CH (1062 cm−1) can also be found from the FTIR spectra. The XPS results are demonstrated in Fig. 2c. The N 1s peak is hardly observed, and only C 1s, O 1s, and Na 1s peaks can be clearly observed at 285 eV, 532 eV, and 1063 eV, respectively. Nearly no changes in the peak height of these three peaks, verifying again that the element contents are quite consistent.
O), 1630 cm−1), Si–O–Si and Si–O–CH (1062 cm−1) can also be found from the FTIR spectra. The XPS results are demonstrated in Fig. 2c. The N 1s peak is hardly observed, and only C 1s, O 1s, and Na 1s peaks can be clearly observed at 285 eV, 532 eV, and 1063 eV, respectively. Nearly no changes in the peak height of these three peaks, verifying again that the element contents are quite consistent.
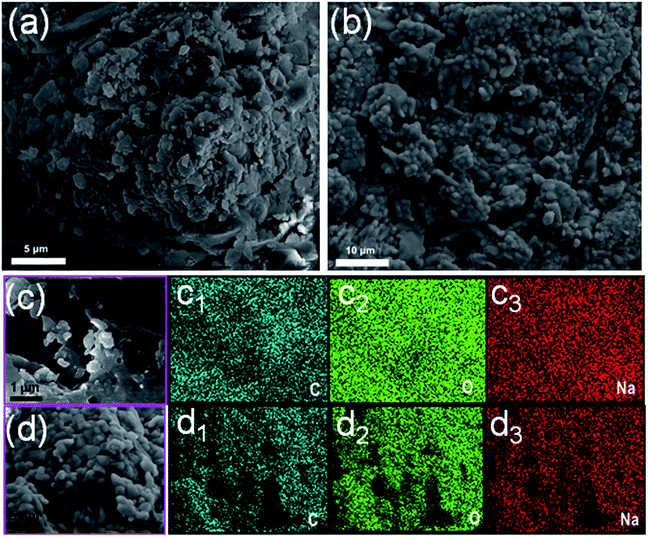
We further studied their morphologies in detail, Fig. 2d and e exhibit the TEM images of B-CDs/SC and Y-CDs/SC, respectively. It is clear that B-CDs/SC shows very similar narrow size distribution in the range of nanometer level, but diameter of Y-CDs/SC is nearly 1.5 μm. Typical SEM images of B-CDs/SC and Y-CDs/SC are presented in Fig. 3a and b, respectively. It can be clearly seen that the particle size is with great difference, and there is distinguishable morphological differences between them. SEM elemental mapping analysis was performed to attain detailed elemental distribution information. In the selected region (Fig. 3c), the carbon, oxygen, and sodium elemental maps (Fig. 3c1–c3, respectively) of B-CDs/SC prove that these three elements exist densely in this region. Meanwhile, elemental maps of Y-CDs/SC are also given in Fig. 3d1–d3, carbon, oxygen, and sodium elements are also with dense distribution. Table 1 detailedly presents the weight percent and atom percent of both B-CDs/SC and Y-CDs/SC samples. The amount of carbon, oxygen, and sodium elements between B-CDs/SC and Y-CDs/SC is almost the same. Both nitrogen and silicon are quite few, which is further agree with the results of XPS. And we can conclude that size effect plays a vital role in the PL properties.
| Element | Weight percent | Atom percent | ||
|---|---|---|---|---|
| B-CDs/SC | Y-CDs/SC | B-CDs/SC | Y-CDs/SC | |
| C | 27.71 | 27.16 | 36.07 | 35.37 |
| N | 1.40 | 1.84 | 1.56 | 2.06 |
| O | 48.02 | 48.56 | 46.92 | 47.48 |
| Na | 21.99 | 21.04 | 14.96 | 14.32 |
| Si | 0.88 | 1.40 | 0.49 | 0.78 |
As shown in Fig. S5 (ESI†), both XRD patterns of B-CDs/SC and Y-CDs/SC obviously exhibit that they are crystalline. And we have confirmed that products are consisted of CDs and SC. Both B-CDs/SC and Y-CDs/SC are with excellent water-solubility, so we collected pure CDs solution by removing the SC with the filter membrane (MWCO = 1000). Seen from Fig. S6 (ESI†), TEM images obviously indicate that CDs exist in the products with distribution around 5–8 nm. For peaks of both B-CDs/SC and Y-CDs/SC can be mainly indexed to trisodium citrate dihydrate (C6H5Na3O7·2H2O) (COD No. 2202624). Meanwhile, some peaks are indexed to silicon dioxide (SiO2) (JCPDS No. 51-1378), combining with the result of EDX shown in Table 1, content of silicon element is few, this is also can be confirmed from XPS results. And aqueous solutions of both B-CDs/SC and Y-CDs/SC are transparent and excellent water-solubility, we can conclude that there are rare SiO2 in B-CDs/SC and Y-CDs/SC, whose major solid state matrix is SC, SiO2 just acts as micro matrix. We could therefore conclude that CDs have successfully been embedded in solid matrix (SC) to realize solid state fluorescence.
Pang and co-workers ascribed that the red shift of PL to both size effects and surface state. The energy gap is governed by the size and surface properties of the nanomaterials leading to the various emission colors.28,29 Meanwhile, with the annealing temperature rising to 400 °C, as-prepared CDs/SC are all burned black after ten minutes, this is because surfaced fluorescent material is completely oxidized. Besides the size changed, with annealing for a period, CDs will gradually decompose from surface to internal.26,30 So CDs located on the surface of CDs/SC will gradually deposed to newly formed another kind of CDs, which were with different surface state. We further confirmed our deduction by designing another experiment, the B-CDs/SC and Y-CDs/SC are mainly consisted of CDs/SC, we dispersed both B-CDs/SC and Y-CDs/SC in deionized water, considering of their excellent water-solubility, then through dialyzing process for 2 days to collect pure CDs solution by removing the SC with a filter membrane (MWCO = 1000). Moreover, we studied the emission color of dialyzed solutions through CIE chromaticity coordinates as shown in Fig. S7 (ESI†). Dot A and dot B represent CIE coordinates of dialyzed solutions of B-CDs/SC, and Y-CDs/SC under UV light (360 nm), respectively. They are gained from B-CDs/SC and Y-CDs/SC respectively, it clearly shows that both of them located at blue emission region, with homologous color coordinates corresponding to A (0.187, 0.162) and B (0.198, 0.204). This phenomenon explained that original blue-light-emitting CDs particles (internal) can further be dispersed following after the surface materials (yellow-light-emitting), as with further dispersing in water under the influence of water molecules, internal blue emission particles can gradually dissolved thoroughly, due to the rare surfaced yellow-light-emitting particles, therefore the presented solution still shows blue emission. We can summarized that luminescence of solid B-CDs/SC is coming from CDs. And luminescence of Y-CDs/SC is from another kind of CDs, whose surfaces have been further oxidized.
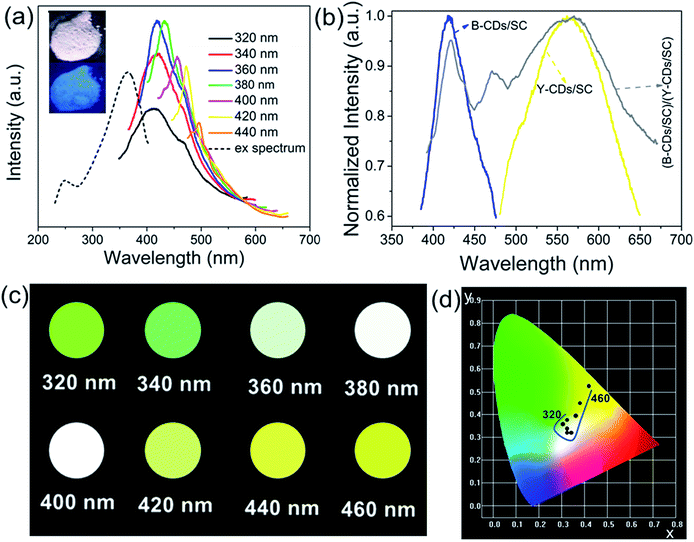
As demonstrated in Fig. 4a, the as-prepared CDs/SC show the strongest fluorescent intensity under excitation wavelength of 360 nm. When excited in the range of 320–440 nm, the B-CDs/SC exhibit obvious blue emission under UV light (inset of Fig. 4a). It also illustrated the excitation-wavelength-dependent PL spectra of B-CDs/SC. The excitation-wavelength-dependent PL property is the consequence of the lowered excitation energy, giving the multifarious higher emission energy levels difficult to accessible and increasing the associated energy level for the Stoke shift in the each case.12,26 Fig. 4b exhibits the normalized fluorescent spectra of B-CDs/SC, Y-CDs/SC, and (B-CDs/SC and Y-CDs/SC)-based composites (mass ratio: 1.343). B-CDs/SC presented an emission peak centred at 422 nm with a full width at half maximum (FWHM) so small as 55 nm. Emission peak of Y-CDs/SC was located at nearly 550 nm accompanied by a remarkable FWHM broadening about 120 nm, which is consistent with the previous report on nanomaterials.31 It is worth mentioning that size effect can bring the influence on the FWHM,26 so this aspect can also prove that the emission property is closely related to the particle size. As expected, the (B-CDs/SC and Y-CDs/SC)-based composites displayed both the characteristic peak of B-CDs/SC and that of Y-CDs/SC under the UV light of 365 nm. And the characteristic emission of B-CDs/SC was hereby showing red shift, which could be due to their self-absorption.32–34 And hence the emission from smaller particles was continuously absorbed and re-emitted by the bigger particles, furthermore, which can effectively cater to the TEM and SEM results. As shown in Fig. 4c, the characteristic emission color changed regularly when the excitation wavelength of B-CDs/SC was tuned from 320 to 460 nm in intervals of 20 nm. The emission color ranges from reseda (0.327, 0.367) to goldenrod (0.408, 0.529) across the white-light-emitting region, which is in accordance with CIE chromaticity coordinates shown in Fig. 4d. These findings can reveal that white-light-emitting could be easily achieved by tuning the excitation wavelength.
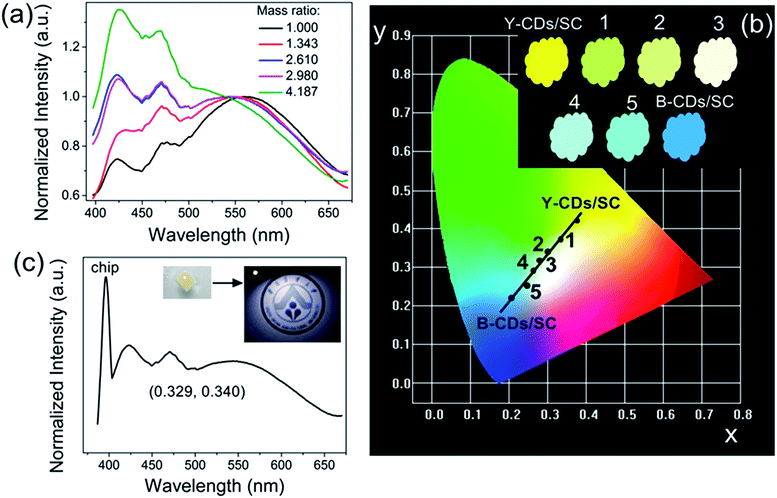
Moreover, we expected to realize the ratiometric PL making using of the emission differences between B-CDs/SC and Y-CDs/SC, namely to adjust the emission color by tuning the relative concentration of B-CDs/SC and Y-CDs/SC. Seeing from Fig. 5a, when excited at 365 nm, the (B-CDs/SC and Y-CDs/SC)-based composites with various concentrations (1.000, 1.343, 2.610, 2.980, 4.187) emitted the characteristic peaks of both B-CDs/SC and Y-CDs/SC. The PL intensity of the B-CDs/SC gradually increased along with the increasing relative concentration of B-CDs/SC to Y-CDs/SC. As shown in the normalized emission spectra, the blue emission region had extended significantly. Therefore, the PL colors of (B-CDs/SC and Y-CDs/SC)-based samples with different concentrations can successfully be tuned from yellow emission to blue emission across white-light region seen from Fig. 5b, the corresponding inset obviously exhibits the optical images of these composites, and their CIE chromaticity coordinates were collected in Table 2. Furthermore, white-light-emitting (B-CDs/SC and Y-CDs/SC)-based (mass ratio: 2.610) composites were used to fabricate the WLEDs accompanied by UV chip (395 nm) as shown in the inset of Fig. 5c, the corresponding EL spectrum and CIE chromaticity coordinate located at (0.329, 0.340) seen from Fig. 5c, which is closely to pure white emission (0.33, 0.33). We successfully fabricated (B-CDs/SC and Y-CDs/SC)-based epoxy resin composites in WLED devices at an optimized current of 50 mA (ca. 3.0 V). Blue LED and yellow LED can also be fabricated when the ratio of B-CDs/SC to Y-CDs/SC is 4.187 and 1.000, respectively seen from Fig. S8 (ESI†). Therefore, we can conclude that as-prepared CDs/SC are promising candidates for the LED fields.
| Samples | Concentration (mass ratio) | CIE (x, y) |
|---|---|---|
| Y-CDs/SC | 0 | (0.386, 0.407) |
| 1 | 1.000 | (0.333, 0.358) |
| 2 | 1.343 | (0.301, 0.337) |
| 3 | 2.610 | (0.293, 0.314) |
| 4 | 2.980 | (0.251, 0.287) |
| 5 | 4.187 | (0.243, 0.247) |
| B-CDs/SC | +∞ | (0.202, 0.218) |
4. Conclusions
In summary, a fast and efficient strategy for preparing carbon dots (CDs) grafted trisodium citrate dihydrate (SC) has been carried out, where the fabricated CDs/SC compounds are along with high yield up to 93.0%, and can be expected to be applied to industrial production. The blue-light-emitting CDs/SC (B-CDs/SC) can convert to yellow-light-emitting CDs/SC (Y-CDs/SC) under UV light after annealing for 480 min at 200 °C. The emission trajectory of (B-CDs/SC and Y-CDs/SC)-based composites can be tuned by gradually optimizing their relative concentration, or changing the excitation wavelength. The (B-CDs/SC and Y-CDs/SC)-based composites are excellent candidates for multicolor display, and also show great potential in LEDs. Furthermore, the (B-CDs/SC and Y-CDs/SC)-based composites may inspire researchers combining with many other disciplines for further study and emergent applications.Acknowledgements
The present work was supported by the National Natural Science Foundations of China (Grant No. 21571067, 51372091, 51203053, 21401028), Science and Technology Planning Project of Guangdong Province (2014A010105035, 2015B090903074) and the Teamwork Projects funded by the Guangdong Natural Science Foundation (Grant No. S2013030012842).Notes and references
- S. S. Babu, M. J. Hollamby, J. Aimi, H. Ozawa, A. Saeki, S. Seki, K. Kobayashi, K. Hagiwara, M. Yoshizawa, H. Möhwald and T. Nakanishi, Nat. Commun., 2013, 4, 1969 CrossRef PubMed.
- S. Ito, S. M. Zakeeruddin, R. Humphry-Baker, P. Liska, R. Charvet, P. Comte, M. K. Nazeeruddin, P. Péchy, M. Takata, H. Miura, S. Uchida and M. Grätzel, Adv. Mater., 2006, 18, 1202 CrossRef CAS.
- H. Sasai, T. Suzuki, S. Arai, T. Arai and M. Shibasaki, J. Am. Chem. Soc., 1992, 114, 4418 CrossRef CAS.
- S. Zhu, Y. Song, X. Zhao, J. Shao, J. Zhang and B. Yang, Nano Res., 2015, 8, 355 CrossRef CAS.
- X. Gao, Y. Cui, R. M. Levenson, L. W. K. Chung and S. Nie, Nat. Biotechnol., 2004, 22, 969 CrossRef CAS PubMed.
- W. Li, J. Yuan, X. Shen, S. Gomez-Mower, L. Xu, S. Sithambaram, M. Aindow and S. L. Suib, Adv. Funct. Mater., 2006, 16, 1247 CrossRef CAS.
- S. Karthik, B. Saha, S. K. Ghosh and N. P. Singh, Chem. Commun., 2013, 49, 10471 RSC.
- S. Zhu, Q. Meng, L. Wang, J. Zhang, Y. Song, H. Jin, K. Zhang, H. Sun, H. Wang and B. Yang, Angew. Chem., 2013, 125, 4045 CrossRef.
- S. K. Bhunia, A. Saha, A. R. Maity, S. C. Ray and N. R. Jana, Sci. Rep., 2013, 3, 1473 Search PubMed.
- X. Tan, Y. Li, X. Li, S. Zhou, L. Fan and S. Yang, Chem. Commun., 2015, 51, 2544 RSC.
- W. Wang, T. Kim, Z. Yan, G. Zhu, I. Cole, N. Nguyen and Q. Li, J. Colloid Interface Sci., 2015, 437, 28–34 CrossRef CAS PubMed.
- Y. Wang, S. Kalytchuk, Y. Zhang, H. Shi, S. V. Kershaw and A. L. Rogach, J. Phys. Chem. Lett., 2014, 5, 1412 CrossRef CAS PubMed.
- M. Sun, S. Qu, Z. Hao, W. Ji, P. Jing, H. Zhang, L. Zhang, J. Zhao and D. Shen, Nanoscale, 2014, 6, 13076 RSC.
- F. Wang, Z. Xie, H. Zhang, C. Liu and Y. Zhang, Adv. Funct. Mater., 2011, 21, 1027 CrossRef CAS.
- Y. Deng, X. Chen, F. Wang, X. Zhang, D. Zhao and D. Shen, Nanoscale, 2014, 6, 10388 RSC.
- H. Wu, X. Zhang, C. Guo, J. Xu, M. Wu and Q. Su, IEEE Photonics Technol. Lett., 2005, 17, 1160 CrossRef CAS.
- F. Kang, H. Zhang, L. Wondraczek, X. Yang, Y. Zhang, D. Y. Lei and M. Peng, Chem. Mater., 2016, 28, 2692 CrossRef CAS.
- Z. Xia, Z. Xu, M. Chen and Q. Liu, Dalton Trans., 2016, 45, 11214 RSC.
- M. Peng, X. Yin, P. A. Tanner, M. G. Brik and P. Li, Chem. Mater., 2015, 27, 2938 CrossRef.
- Y. Chen, M. Zheng, Y. Xiao, H. Dong, H. Zhang, J. Zhuang, H. Hu, B. Lei and Y. Liu, Adv. Mater., 2016, 28, 312 CrossRef CAS PubMed.
- W. Zhang, S. F. Yu, L. Fei, L. Jin, S. Pan and P. Lin, Carbon, 2015, 85, 344 CrossRef CAS.
- J. H. Oh, H. Kang, Y. J. Eo, H. K. Park and Y. R. Do, J. Mater. Chem. C, 2015, 3, 607 RSC.
- C. C. Tu, J. H. Hoo, K. F. Böhringer, L. Y. Lin and G. Cao, Opt. Express, 2014, 22, A276 CrossRef PubMed.
- Z. Xie, F. Wang and C. Liu, Adv. Mater., 2012, 24, 1716 CrossRef CAS PubMed.
- V. A. Lebedev, D. A. Kozlov, I. V. Kolesnik, A. S. Poluboyarinov, A. E. Becerikli, W. Grünert and A. V. Garshev, Appl. Catal., B, 2016, 195, 39 CrossRef CAS.
- J. R. Lakowicz, Principles of Fluorescence Spectroscopy, Springer Science & Business Media, Baltimore, Maryland, USA, 2007 Search PubMed.
- J. Peng, W. Gao, B. K. Gupta, Z. Liu, R. Romero-Aburto, L. Ge, L. Song, L. B. Alemany, X. Zhan, G. Gao, S. A. Vithayathil, B. A. Kaipparettu, A. A. Marti, T. Hayashi, J. Zhu and P. M. Ajayan, Nano Lett., 2012, 12, 844 CrossRef CAS PubMed.
- H. Ding, S. Yu, J. Wei and H. Xiong, ACS Nano, 2016, 10, 484 CrossRef CAS PubMed.
- L. Bao, C. Liu, Z. L. Zhang and D. W. Pang, Adv. Mater., 2015, 27, 1663 CrossRef CAS PubMed.
- S. Y. Lim, W. Shen and Z. Gao, Chem. Soc. Rev., 2015, 44, 362 RSC.
- X. Chen and S. S. Mao, Chem. Rev., 2007, 107, 2891 CrossRef CAS PubMed.
- E. R. Margine, M. L. Bocquet and X. Blase, Nano Lett., 2008, 8, 3315 CrossRef CAS PubMed.
- N. Masilela and T. Nyokong, J. Photochem. Photobiol., A, 2012, 247, 82 CrossRef CAS.
- H. Tao, X. Liao, C. Sun, X. Xie, F. Zhong, Z. Yi and Y. Huang, Spectrochim. Acta, Part A, 2015, 136, 1328 CrossRef CAS PubMed.
Footnotes |
| † Electronic supplementary information (ESI) available: Fluorescence spectra, and histogram. See DOI: 10.1039/c6ra21588b |
| ‡ These authors have contributed equally to this work. |
| This journal is © The Royal Society of Chemistry 2016 |

