Microwave-assisted sonochemical synthesis of Cu and Mn doped GSH–ZnS polypeptide quantum dots and their enhanced photoelectrochemical properties†
Jian-Jun Shi*ab,
Lei Gonga,
Yan-Hong Zhanga,
Ping Yanga and
Jie Hea
aSchool of Chemical Engineering, Anhui University of Science and Technology, Huainan, 232001, China. E-mail: jjshi@aust.edu.cn; Fax: +86 554 6668485; Tel: +86 554 6668485
bState Key Laboratory of Analytical Chemistry for Life Science, Collaborative Innovation Center of Chemistry for Life Sciences, School of Chemistry and Chemical Engineering, Nanjing University, Nanjing, 210093, People's Republic of China
First published on 10th November 2016
Abstract
A series of Cu and Mn doped glutathione (GSH)–ZnS polypeptide quantum dots (QDs) were successfully prepared by a facile one-pot microwave-assisted sonochemical synthesis approach. Herein, GSH acted as a sulfide source and dispersant, as well as a reducing agent to form polypeptide QDs. The products were characterized by high-resolution transmission electron microscope (HRTEM) and energy dispersive spectroscopy (EDS). Results show that the size of the polypeptides QDs was 2–3 nm. In Fourier transform infrared (FT-IR) spectra, the splitting of S–H bonds and substitution by S–Zn can be noticed. The bonding interaction between Cu, Mn and Zn ions toward S was further confirmed from X-ray photoelectron spectroscopy (XPS) analysis. The results confirmed the partial Cu(Mn) substitution of Zn. Fluorescence (FL) spectra and UV-vis absorption spectra were used to investigate the optical properties. It was found that the doping of Cu and Mn could decrease the band gap of GSH–ZnS from 3.67 eV to 2.86 eV. The photoelectrochemical (PEC) properties of GSH–ZnS were enhanced due to the doping of Cu and Mn which has excellent chemical stability. The possible photoelectrochemical reaction mechanism is discussed.
1 Introduction
Recently, photoelectric materials have been demonstrated to be promising candidates for the preparation of biosensors1 or solar cells2 due to their thermal and chemical stability in solution. Common photoelectric materials include TiO2,3 ZnO,4 CdS,5 CdSe,6 CdTe,7 polyaniline,8 bipyridyl,9 composites,10 etc. Among these materials, semiconductor QDs materials as sensitizers have been widely used for light harvesting in photoanodes due to their tunable band gap and can obtain high sunlight utilization efficiency.5 Semiconductor QDs comprise elements from the periodic groups II–VI or III–V, and are defined as particles with physical dimensions ranging from 1 to 10 nm.11 Unfortunately, traditionally used QDs are composed of toxic compounds (Cd, Pd, Hg, As, etc.), which are harmful to human beings and other creatures. Zinc sulfide (ZnS) stands out because it has no heavy metals and is particularly suitable to be used as a host for a large variety of metal ions. ZnS is one of the most important group II–VI semiconductors, having a typical wide band gap of 3.67 eV at room temperature.12 Therefore, researchers are interested in designing ZnS to obtain remarkable physical and chemical properties. But, the tuning of physical and chemical properties by changing the size and morphology has been limited by the reaction conditions.13 However, ZnS has a large energy gap and can be doped with metal ions to obtain remarkable optical properties. Undoped ZnS nanoparticles emit in the blue region with broad bandwidth. But doping ZnS with different metal ions (such as Cu,15 Ni,16 Mn,17,18 Cd19,20) can tune the luminescence properties to a large extent.14 Furthermore, traditional stabilising agents (e.g., silica,11 thioglycolic,18 L-cysteine21) were widely used to improve the water-solubility of the QDs. Recently, polypeptides were used as stabilising agents to design water-soluble QDs, such as bovine serum albumin22,23 and GSH.24 The polypeptides with excellent biocompatibility can provide an active site for the combine with other functional group or element. Besides, the amide bonds of polypeptides make the QDs much more electronegative, which lead to a better chemical stability.18 To the best of our knowledge, GSH used as a single sulfide source was seldom reported.There are many methods on the synthesis of QDs, such as wet chemical methods,25 metal–organic vapor chemical deposition,26 laser assisted catalytic,27 thermal evaporation,28 etc. However, these traditional synthesis methods require relatively high temperature. In addition, most of these methods are complex in the synthesis of QDs and also need toxic organometallic precursors to achieve the reaction condition. Ultrasonic irradiation provides unusual physical and chemical effects which derive from acoustic cavitation. Liquid treated with ultrasound can lead to the formation, growth, and collapse of a bubble, and localized hot spots will generate with extremely high pressures and temperatures, and rapid heating and cooling rates.29 Sonochemical method has been proven to be a powerful tool for the production of various nanomaterials, including graphene,30 metal31 and metal oxide catalysts,32 semiconductor,33 crystallization,34 and anisotropic materials.35 In recent years, many kinds of composite functional materials36 and polymers37 have also been successfully prepared by this method. In addition, sonochemistry combined with other techniques have also been received attention as promising synthesis methods, such as sonoelectrochemistry31 and sonophotocatalyst.38 Compared with the conventional heating, microwave can not only increase the reaction speed by several orders of magnitude, but also provide a relatively uniform environment so as to prevent side reactions and enhance the repeatability.39 Moreover, various nanocrystals (e.g., Au,40 Ag41) have been prepared via microwave method. Microwave-assisted sonochemical synthesis technology which combines microwave and ultrasonic technique, has been proven to be a fast, simple and effective route for the synthesis of nanoparticles (such as TiO2,42 CuO43 and LnVO4).44 Microwave-assisted sonochemical synthesis technology could provided a specific physical environment for the synthesis reaction, which is impossible or difficult to achieve in the general conditions.45
Herein, the GSH–CuxMnyZnS polypeptides QDs were prepared by a facile microwave-assisted sonochemical synthesis approach. The polypeptides are used as sulfide source, dispersant as well as reducing agent for synthesis relatively non-toxic QDs. The key parameters in synthesis procedure were identified and optimised to maximise FL emission intensity and the enhanced PEC activities. Furthermore, photoelectrochemical experiments were employed to demonstrated the enhanced PEC activities of Cu and Mn doped polypeptides QDs.
2 Experimental
2.1 Materials and reagents
All chemicals were of the analytically pure available and were used as received without further purification. Zinc sulfate heptahydrate [ZnSO4·7H2O, ≥99.5%], copper(II)acetate monohydrate [Cu(CH3COO)2·H2O, ≥98.0%], manganese(II)acetate tetrahydrate [Mn(CH3COO)2·4H2O, ≥99.0%] and ascorbic acid (AA, 99.7%) were purchased from Sinopharm Chemical Reagent Co., Ltd. Glutathione (GSH, 98.0%) were purchased from Aladdin. TiO2 powder (P25) was purchased from the Degussa Co. (Germany). Indium tin oxide (ITO) slices (JH52, 0.5 cm × 2 cm) were ordered from Nanjing Zhongjingkeyi Technology Co. Ltd. (China).2.2 Synthesis of Cu and Mn doped GSH–ZnS polypeptides QDs
Microwave-assisted sonochemical synthesis of the polypeptides QDs was carried out in a Nanjing Xian'ou microwave/ultrasonic (MW/US) device, consisting of a ultrasonic probe, a ultrasonic and microwave generator, and a reaction chamber. In details, first prepared were 0.3 mM ZnSO4·7H2O and 1.2 mM GSH in 100 mL of deionized water. The mixture solution was added to the MW/US device. Under continuous ultrasonic stirring, different molar amounts of Cu(CH3COO)2·H2O and Mn(CH3COO)2·4H2O in 20 mL of deionized water were added dropwise to the mixture solution. Then, the reaction solution was reacted at different reaction parameters. Finally, the reaction products were centrifuged (RCF 10![[thin space (1/6-em)]](https://www.rsc.org/images/entities/char_2009.gif) 270 × g) and washed by water and ethanol several times, and then dried at room temperature overnight.
270 × g) and washed by water and ethanol several times, and then dried at room temperature overnight.
2.3 Characterization techniques
The High Resolution Transmission Electron Microscopy (HRTEM), Energy Dispersive Spectrometer (EDS) and selected area electron diffraction (SAED) were recorded by JEM-2100 F (JEOL Co. Ltd., Tokyo, Japan). The UV-visible absorption spectroscopy were recorded on UV-2550 spectrophotometer (Shimadzu Co., Kyoto, Japan). Fluorescence spectra were measured at room temperature by F-4600 fluorescence spectrophotometer (Hitachi Co., Kyoto, Japan) excited at 367 nm. The FT-IR spectra were measured at room temperature by FTIR-850 (Tianjin, China) spectrometer from 400 to 4000 cm−1. XPS measurements were carried out using an escalab 250xi XPS (USA) instrument with monochromatic Al Kα (1486.6 eV) as excitation source. The photoelectrochemical performance were investigated in a conventional three-electrode system consisting of a ITO slice as working electrode, a saturated calomel electrode (SCE) as reference electrode and a platinum wire as counter electrode on an electrochemical workstation (CHI 660D). Electrochemical impedance spectroscopy (EIS) was performed on an electrochemical workstation (CHI 660D) with a three-electrode system in 0.1 M KCl solution containing 1.0 mM K3[Fe(CN)6]/K4[Fe(CN)6] (1![[thin space (1/6-em)]](https://www.rsc.org/images/entities/char_2009.gif) :
:![[thin space (1/6-em)]](https://www.rsc.org/images/entities/char_2009.gif) 1) mixture as a redox probe and recorded in the frequency range of 1 Hz to 100 kHz with an amplitude of 50 mV. The PEC properties and stability of Cu and Mn doped GSH–ZnS were detected in air-saturated 0.1 M pH 7.4 phosphate buffer (PBS) containing 0.1 M ascorbic acid under 500 W xenon lamp irradiation.
1) mixture as a redox probe and recorded in the frequency range of 1 Hz to 100 kHz with an amplitude of 50 mV. The PEC properties and stability of Cu and Mn doped GSH–ZnS were detected in air-saturated 0.1 M pH 7.4 phosphate buffer (PBS) containing 0.1 M ascorbic acid under 500 W xenon lamp irradiation.
2.4 Photoelectrochemical properties of the polypeptides QDs
GSH–CuxMnyZnS modified ITO/TiO2 PEC working electrode were fabricated as follows: first, the ITO slices were cleaned by ultrasonic treatment for 15 min in acetone, 1 M NaOH in a water/ethanol mixture (1![[thin space (1/6-em)]](https://www.rsc.org/images/entities/char_2009.gif) :
:![[thin space (1/6-em)]](https://www.rsc.org/images/entities/char_2009.gif) 1, v/v) and water in order, and then dried at 80 °C for 12 h. Next, 20 μL 1 mg mL−1 TiO2 was dropped on ITO conducting glass, and calcined at 450 °C for 30 min at a heating rate of 5 °C min−1 and followed by cooling down to the room temperature naturally. Finally, 20 μL 1 mg mL−1 undoped, Cu and Mn doped GSH–ZnS were dropped on the ITO/TiO2 to form functional interfaces, respectively. Then, the prepared electrode was dried at room temperature.
1, v/v) and water in order, and then dried at 80 °C for 12 h. Next, 20 μL 1 mg mL−1 TiO2 was dropped on ITO conducting glass, and calcined at 450 °C for 30 min at a heating rate of 5 °C min−1 and followed by cooling down to the room temperature naturally. Finally, 20 μL 1 mg mL−1 undoped, Cu and Mn doped GSH–ZnS were dropped on the ITO/TiO2 to form functional interfaces, respectively. Then, the prepared electrode was dried at room temperature.
3 Results and discussion
3.1 Characterization of the polypeptides QDs
The morphology of prepared undoped, Cu and Mn doped GSH–ZnS QDs are characterized by TEM and HRTEM. As seen in Fig. 1a, the size of GSH–ZnS is uniform with an average diameter around 5 nm. The planes are calculated from the difference in lattice fringes and marked in the HRTEM image (Fig. 1b). The distance (0.314 nm) between the adjacent lattice fringes is the interplanar distance of ZnS (111) plane (0.32 nm). The corresponding SAED pattern (Fig. 1c) exhibits rings, which are related to the diffraction arising from different planes of ZnS nanocrystallites. The major diffraction rings match well with the (111), (220) and (311) planes of the cubic lattice of ZnS phase (JCPDS Card no. 05-0566). To better understand the elements composition, EDS were performed. The EDS analyse (Fig. 1d) and its percentage ratio (Fig. 1e) clearly indicate that the S and Zn in GSH–ZnS are 2.97% and 2.64%, which indicates that the GSH act as sulfide source and dispersant. The C, N and O belong to GSH. The Cu (Fig. 1e) and Mo (Fig. 2e) come from copper grid and molybdenum grid, respectively. The Fe atoms are resulted from instruments. Furthermore, the size of Cu and Mn doped GSH–ZnS ranged from 2 to 3 nm (Fig. 2a). The planes (Fig. 2b) were also calculated and marked in the HRTEM image. The distance (0.314 nm) between the adjacent lattice fringes indicates that the doping of Cu and Mn almost has no influence on the cubic zinc blende phase structure. The corresponding SAED pattern (Fig. 2c) also exhibits rings instead of spots due to the random orientation of Cu and Mn doped GSH–ZnS similar to GSH–ZnS. In addition, no obvious change in the major diffraction planes (111), (220) and (311) was noticed. The EDS image (Fig. 2d) and its percentage ratio (Fig. 2e) indicated the formation of Cu and Mn doped GSH–ZnS.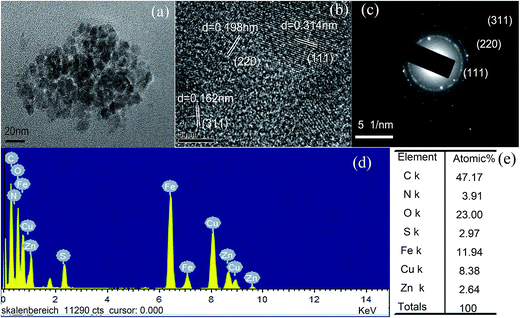 | ||
| Fig. 1 (a) Typical TEM image, (b) HRTEM image, (c) corresponding SAED pattern, (d) EDS spectrum and (e) atomic% of GSH–ZnS polypeptides QDs, respectively. | ||
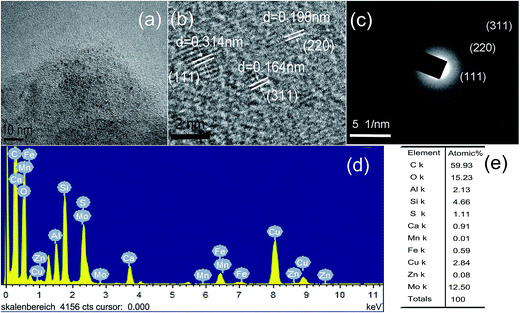 | ||
| Fig. 2 (a) Typical TEM image, (b) HRTEM image, (c) corresponding SAED pattern, (d) EDS spectrum and (e) atomic% of Cu and Mn doped GSH–ZnS polypeptides QDs, respectively. | ||
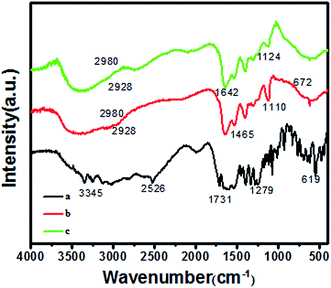
FT-IR spectrum of GSH is shown in Fig. 3a. The bands at 2526 and 3345 cm−1 can be assigned to –SH and –NH2, respectively. The band at 1731 cm−1 can be assigned to C![[double bond, length as m-dash]](https://www.rsc.org/images/entities/char_e001.gif) O symmetric of –COOH. Fig. 3b and c are FT-IR spectra of undoped GSH–ZnS, Cu and Mn doped GSH–ZnS. The broad band around 3000–3600 cm−1 is due to the OH stretching frequency (existence of water absorbed on the surface of polypeptides QDs). The bands at 1465 and 1642 cm−1 can be assigned to –CH2 and C
O symmetric of –COOH. Fig. 3b and c are FT-IR spectra of undoped GSH–ZnS, Cu and Mn doped GSH–ZnS. The broad band around 3000–3600 cm−1 is due to the OH stretching frequency (existence of water absorbed on the surface of polypeptides QDs). The bands at 1465 and 1642 cm−1 can be assigned to –CH2 and C![[double bond, length as m-dash]](https://www.rsc.org/images/entities/char_e001.gif) O of amido bond arising from GSH. Besides, the disappearing band at 2526 cm−1 (–SH) indicates the break of S–H. Furthermore, the characteristic ZnS vibration peaks can be noticed at 1110 and 672 cm−1.15 This indicates that the S–H can be partially substituted by S–Zn, which is agreement with the results of HRTEM images. In addition, it also indicates that only the S–H from GSH gets attached to Zn2+, the structure of GSH remains unchanged in the synthesis process. However, the FT-IR spectrum of Cu and Mn doped GSH–ZnS shows almost similar peaks with respect to the undoped GSH–ZnS and in addition noticeable new peak at 1124 cm−1 may be due to the difference in vibrational modes of Zn and Cu(Mn) sulfide ions. This indicates that the partial Cu(Mn) substitution of Zn ions as Cu(Mn)–S–Zn.
O of amido bond arising from GSH. Besides, the disappearing band at 2526 cm−1 (–SH) indicates the break of S–H. Furthermore, the characteristic ZnS vibration peaks can be noticed at 1110 and 672 cm−1.15 This indicates that the S–H can be partially substituted by S–Zn, which is agreement with the results of HRTEM images. In addition, it also indicates that only the S–H from GSH gets attached to Zn2+, the structure of GSH remains unchanged in the synthesis process. However, the FT-IR spectrum of Cu and Mn doped GSH–ZnS shows almost similar peaks with respect to the undoped GSH–ZnS and in addition noticeable new peak at 1124 cm−1 may be due to the difference in vibrational modes of Zn and Cu(Mn) sulfide ions. This indicates that the partial Cu(Mn) substitution of Zn ions as Cu(Mn)–S–Zn.
3.2 Optical properties of the polypeptides QDs
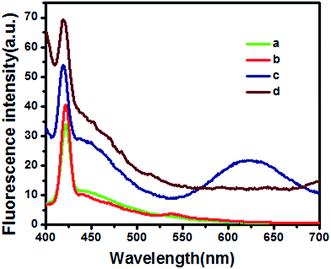
The fluorescence spectra of the undoped (a), Mn doped (b), Cu and Mn doped (c), Cu doped (d) GSH–ZnS are shown in Fig. 4. GSH–ZnS shows a peak at 420 nm. However, for the Mn doped GSH–ZnS, red-shifted peak is noticed at 540 nm. And for Cu doped GSH–ZnS, obvious FL enhance is noticed at 420 nm, but the red-shifted peak at 625 nm is not noticed. Furthermore, for Cu and Mn doped GSH–ZnS, broad and red-shifted peak is noticed at 625 nm. The FL intensity of Cu and Mn doped GSH–ZnS was stronger than the undoped or Mn doped GSH–ZnS, which could indirectly indicated the presence of more than one metal ion, probably Cu(Mn)–S–Zn. All in all, Cu and Mn doped benefit more in the FL property.UV-vis absorption of undoped (a), Cu doped (b), Mn doped (c), Cu and Mn doped (d) GSH–ZnS are demonstrated in Fig. 5. Compared with the undoped GSH–ZnS, the observed red shift of the absorption edge are noticed when Cu or Mn doped in the polypeptides QDs. Results show that Cu or Mn doping can moderately benefit the optical property, which is due to the substitution of Cu or Mn ions on Zn lattice sites.15 The calculated band gap using Tauc's relation46 decreases from 3.67 eV to 2.86 eV upon doping Cu and Mn into GSH–ZnS, which indicated that it could be used as a visible light response material for various applications.
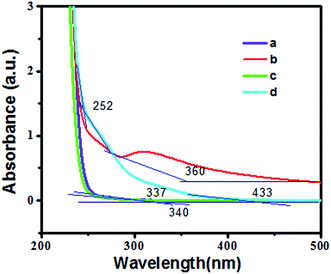 | ||
| Fig. 5 UV-vis absorption spectra of (a) undoped, (b) Cu doped, (c) Mn doped, (d) Cu and Mn doped GSH–ZnS. | ||
3.3 Influence of synthesis conditions
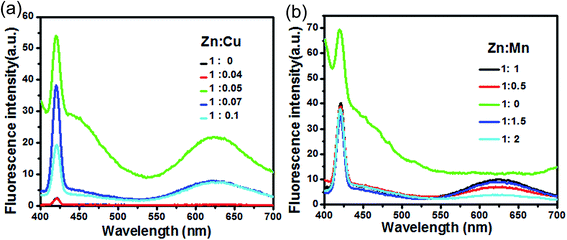
The key synthesis parameters are Zn![[thin space (1/6-em)]](https://www.rsc.org/images/entities/char_2009.gif) :
:![[thin space (1/6-em)]](https://www.rsc.org/images/entities/char_2009.gif) Cu and Zn
Cu and Zn![[thin space (1/6-em)]](https://www.rsc.org/images/entities/char_2009.gif) :
:![[thin space (1/6-em)]](https://www.rsc.org/images/entities/char_2009.gif) Mn reactant molar ratios. The fluorescence spectra of the prepared GSH–ZnS with different Zn
Mn reactant molar ratios. The fluorescence spectra of the prepared GSH–ZnS with different Zn![[thin space (1/6-em)]](https://www.rsc.org/images/entities/char_2009.gif) :
:![[thin space (1/6-em)]](https://www.rsc.org/images/entities/char_2009.gif) Cu ratios (a) and Zn
Cu ratios (a) and Zn![[thin space (1/6-em)]](https://www.rsc.org/images/entities/char_2009.gif) :
:![[thin space (1/6-em)]](https://www.rsc.org/images/entities/char_2009.gif) Mn ratios (b) are shown in Fig. 6. Cu, Mn doped shows a peak at 420 nm and a red-shifted peak at 625 nm. The emission intensity was found to show an increasing trend as Zn
Mn ratios (b) are shown in Fig. 6. Cu, Mn doped shows a peak at 420 nm and a red-shifted peak at 625 nm. The emission intensity was found to show an increasing trend as Zn![[thin space (1/6-em)]](https://www.rsc.org/images/entities/char_2009.gif) :
:![[thin space (1/6-em)]](https://www.rsc.org/images/entities/char_2009.gif) Mn ratios (Fig. 6a) increased from 1
Mn ratios (Fig. 6a) increased from 1![[thin space (1/6-em)]](https://www.rsc.org/images/entities/char_2009.gif) :
:![[thin space (1/6-em)]](https://www.rsc.org/images/entities/char_2009.gif) 0 to 1
0 to 1![[thin space (1/6-em)]](https://www.rsc.org/images/entities/char_2009.gif) :
:![[thin space (1/6-em)]](https://www.rsc.org/images/entities/char_2009.gif) 1 and Zn
1 and Zn![[thin space (1/6-em)]](https://www.rsc.org/images/entities/char_2009.gif) :
:![[thin space (1/6-em)]](https://www.rsc.org/images/entities/char_2009.gif) Cu ratios (Fig. 6b) increased from 1
Cu ratios (Fig. 6b) increased from 1![[thin space (1/6-em)]](https://www.rsc.org/images/entities/char_2009.gif) :
:![[thin space (1/6-em)]](https://www.rsc.org/images/entities/char_2009.gif) 0 to 1
0 to 1![[thin space (1/6-em)]](https://www.rsc.org/images/entities/char_2009.gif) :
:![[thin space (1/6-em)]](https://www.rsc.org/images/entities/char_2009.gif) 0.05. Beyond this optimum point, emission intensity decreased drastically. Thus, the Zn
0.05. Beyond this optimum point, emission intensity decreased drastically. Thus, the Zn![[thin space (1/6-em)]](https://www.rsc.org/images/entities/char_2009.gif) :
:![[thin space (1/6-em)]](https://www.rsc.org/images/entities/char_2009.gif) Mn ratio and Zn
Mn ratio and Zn![[thin space (1/6-em)]](https://www.rsc.org/images/entities/char_2009.gif) :
:![[thin space (1/6-em)]](https://www.rsc.org/images/entities/char_2009.gif) Cu ratio were optimised as 1
Cu ratio were optimised as 1![[thin space (1/6-em)]](https://www.rsc.org/images/entities/char_2009.gif) :
:![[thin space (1/6-em)]](https://www.rsc.org/images/entities/char_2009.gif) 1 and 1
1 and 1![[thin space (1/6-em)]](https://www.rsc.org/images/entities/char_2009.gif) :
:![[thin space (1/6-em)]](https://www.rsc.org/images/entities/char_2009.gif) 0.05, respectively.
0.05, respectively.
Ultrasonic power (Fig. 7a) and microwave power (Fig. 7b) have great influence on the size and shape of GSH–Cu0.05MnZnS polypeptides QDs due to the distinct cavitation and dispersion effects. Results show that the PL intensity increases with the increase of ultrasonic and microwave power but decreases when exceed 700 W and 500 W, respectively. It can be explained that the higher ultrasonic and microwave power lead to the rapider nucleation and growth process, which was beneficial to form the QDs that dramatically drop the PL intensity of QDs.29
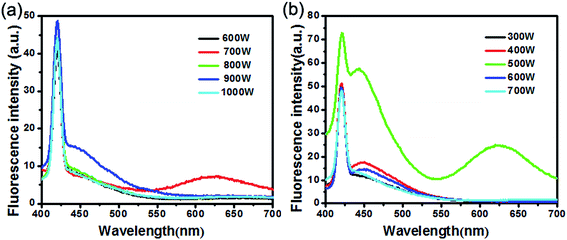 | ||
| Fig. 7 FL of GSH–ZnS QDs synthesized at different (a) ultrasonic and (b) microwave power reaction conditions. | ||
Reaction time (Fig. 8a), temperature (Fig. 8b), pH (Fig. 8c) and ultrasonic time interval (Fig. 8d) also have effect on the FL intensity of the polypeptides QDs. Thus, results show that under 40 °C, pH (5.0) and US on/off 0.5 s/1 s conditions reaction 20 min, the polypeptides QDs can obtain a higher FL intensity. All of them were found an increasing trend under the optimum point. Beyond this optimum, emission intensity decreased drastically.
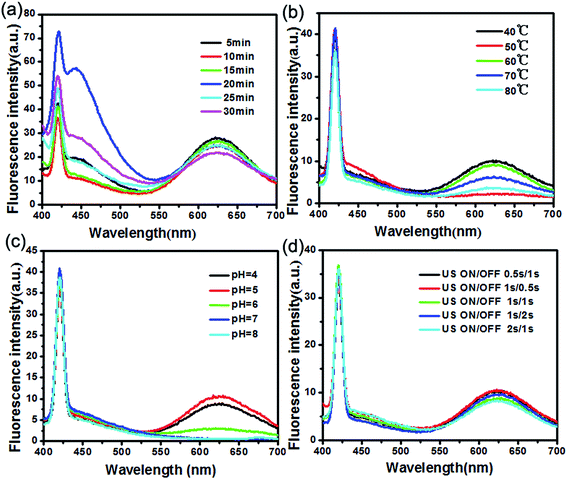 | ||
| Fig. 8 FL of GSH–Cu0.05MnZnS synthesized at different (a) reaction time, (b) temperature, (c) pH, (d) ultrasonic time interval. | ||
3.4 Photoelectrochemical properties of GSH–CuxMnyZnS
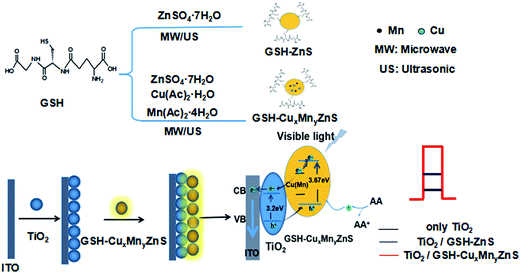
A mechanism of preparation of polypeptides QDs and its photoelectrochemical properties is proposed. As shown in Scheme 1, Cu and Mn doped ZnS QDs could form deep trap energy levels between the valence band (VB) and conduction band (CB) of GSH–ZnS. By absorbing the external energy (visible light), electrons are excited from the VB to CB, which are then relaxed at shallow defect levels formed by impurity ions.11 In GSH–ZnS, the activated electrons can recombine with holes left in the CB. While in Cu and Mn doped GSH–ZnS, the activated electrons can recombine with holes left in the CB or the holes transferred to Cu or Mn trap energy levels by irradiative transitions which give out more photoelectrons. Thus, the efficient charge transfer prevents the electron–hole recombination. Therefore, GSH–Cu0.05MnZnS can enhance the photocurrent signal. In addition, when GSH–CuxMnyZnS was immobilized on the surface, TiO2 (3.2 eV) acted as an excellent electron acceptor and transporter, which could be used to transport the photogenerated electrons to the surface of the ITO and extend the lifetime of the photogenerated carriers.As shown in Fig. 9, the bare ITO electrode presented the electron-transfer resistance (Ret) value is 160 Ω (curve a), indicated the characteristic of a diffuse limiting step of the electrochemical process. After the immobilization of TiO2 on the electrode surface, an increase of Ret (450 Ω) is observed (curve b), which was due to the incorporation of the TiO2. Furthermore, after undoped and Cu and Mn doped GSH–ZnS were immobilized on the ITO/TiO2, the Ret value increased up to 540 Ω (curve c) and 640 Ω (curve d). The fact is that most biological molecules are poor electrical conductors at low frequencies and cause hindrance to the electron transfer, and this was the direct evidence of successful binding of the GSH–Cu0.05MnZnS on the electrode surface.
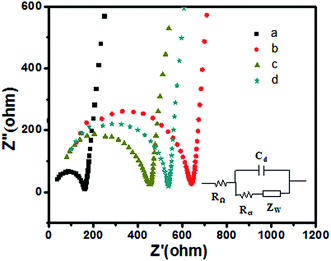 | ||
| Fig. 9 EIS of (a) bare ITO, (b) ITO/TiO2, (c) ITO/TiO2/GSH–ZnS and (d) ITO/TiO2/GSH–Cu0.05MnZnS in 0.1 M KCl containing 5 mM Fe(CN)63−/4−. | ||
The photoelectrochemical properties of GSH–Cu0.05MnZnS based on the ITO/TiO2 were investigated and measured at intervals of 10 seconds. AA was served as a sacrificial electron donor during measurement of the photocurrent. As shown in Fig. 10, the photocurrent signal of both the ITO/TiO2/GSH–ZnS (curve b) and ITO/TiO2/GSH–Cu0.05MnZnS (curve c) increased greatly than ITO/TiO2 (curve a). And the doping Cu and Mn into GSH–ZnS resulted in the significant increase of photocurrent signal by the comparation of curve b and c. Thus, a new polypeptides QDs based on ITO/TiO2 was designed for PEC analysis.
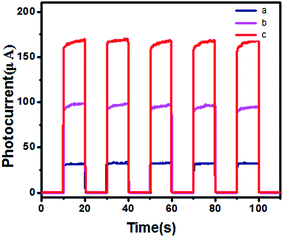 | ||
| Fig. 10 The photocurrent responses of (a) ITO/TiO2, (b) ITO/TiO2/GSH–ZnS and (c) ITO/TiO2/GSH–Cu0.05MnZnS in 0.1 M PBS (pH 7.4) containing 0.1 M ascorbic acid. | ||
In order to demonstrate the stability of ITO/TiO2/GSH–Cu0.05MnZnS, long term stability test of ITO/TiO2/GSH–Cu0.05MnZnS was investigated and measured at intervals of 20 seconds. As shown in Fig. S1 (ESI†), after 2 hours, the change of response value was not noticed obviously. The result shows that the polypeptides QDs have excellent stability.
To better understand the surface composition change induced by long-term positively biased condition, XPS analyses were performed and the results are shown in Fig. S2.† The XPS survey spectra of ITO/TiO2/GSH–Cu0.05MnZnS after stability testing shows almost similar peaks comparing with the ITO/TiO2/GSH–Cu0.05MnZnS previous. The peaks of S and Zn can be noticed in both survey spectra. The binding energies of S(2p3/2) and S(2p1/2) are found at 161.9 and 163.1 eV, which consists with the binding energy values as reported.15 The surface composition has no noticeable change after stability testing, which indicates that there was no oxidation of sulfide. The binding energies of Zn(2p3/2) and Zn(2p1/2) are found at 1022.1 and 1045.1 eV, which belongs to the Zn2+ oxidation state. In addition, for the dopant Cu and Mn, the binding energies of Cu(2p3/2) and Cu(2p1/2) are 932.6 and 952.5 eV and the binding energies of Mn(2p3/2) and Mn(2p1/2) are 641.2 and 652.9 eV, respectively. It can suggest that Cu and Mn species were either metallic or cationic.15 The detected Cu and Mn species may be cationic based on FT-IR studies. Hence, the results clearly support that there are bonding interactions occurring between Cu, Mn and Zn ions toward S as Cu(Mn)–S–Zn.
4 Conclusions
In summary, GSH–Cu0.05MnZnS polypeptides QDs with excellent photoelectrochemical properties were synthesized by a facile microwave-assisted sonochemical approach and a suitable mechanism is provided. In FT-IR spectra, the splitting of S–H bond and substitution by S–Zn can be noticed. The results of XPS analyses further confirmed the partial Cu(Mn) substitution of Zn. Microwave-assisted ultrasonic synthesis technology proved to be a simple, fast and controllable route for synthesis of polypeptides QDs due to its cavitation and dispersion effects. Under the reaction condition of 700 W ultrasonic power and 500 W microwave power, 40 °C, pH (5.0) and US on/off 0.5 s/1 s conditions reaction 20 min, the Cu and Mn doped polypeptides QDs can obtain higher FL intensity. Based on the energy level matched, Cu and Mn doped could form deep trap energy levels between the VB and the CB of GSH–ZnS. The photoelectrochemical experiments show that it can better enhance the PEC property. The polypeptides QDs have great potential to serve as photoelectric materials in the application for solar cells or biosensors.Acknowledgements
We greatly appreciate the support of the National Natural Science Foundation of China (21505001, 21271008), and State Key Laboratory of Analytical Chemistry for Life Science (SKLACLS1418).References
- X. X. Zeng, W. W. Tu, J. Li, J. C. Bao and Z. H. Dai, ACS Appl. Mater. Interfaces, 2014, 6, 16197–16203 CAS.
- A. Hagfeldt, G. Boschloo, L. C. Sun, L. Kloo and H. Pettersson, Chem. Rev., 2010, 110, 6595–6663 CrossRef CAS PubMed.
- S. W. Zhou, Y. Y. Wang, M. Zhao, L. P. Jiang and J. J. Zhu, ChemPhysChem, 2015, 16, 2826–2835 CrossRef CAS.
- R. Xu, Y. D. Jiang, L. Xia, T. X. Zhang, L. Xu, S. Zhang, D. L. Liu and H. W. Song, Biosens. Bioelectron., 2015, 74, 411–417 CrossRef CAS PubMed.
- T. Hou, L. F. Zhang, X. Z. Sun and F. Li, Biosens. Bioelectron., 2016, 75, 359–364 CrossRef CAS PubMed.
- J. Hensel, G. M. Wang, Y. Li and J. Z. Zhang, Nano Lett., 2010, 10, 478–483 CrossRef CAS PubMed.
- X. H. Pang, J. H. Pan, P. C. Gao, Y. Y. Wang, L. G. Wang, B. Du and Q. Wei, Biosens. Bioelectron., 2015, 74, 49–58 CrossRef CAS PubMed.
- S. Liu, X. R. Xing, J. H. Yu, W. J. Lian, J. Li, M. Cui and J. D. Huang, Biosens. Bioelectron., 2012, 36, 186–191 CrossRef CAS PubMed.
- B. T. Zhang and L. H. Guo, Biosens. Bioelectron., 2012, 37, 112–115 CrossRef CAS PubMed.
- G. C. Fan, H. Zhu, Q. M. Shen, L. Han, M. Zhao, J. R. Zhang and J. J. Zhu, Chem. Commun., 2015, 51, 7023–7026 RSC.
- B. H. Dong, L. X. Cao, G. Su, W. Liu, H. Qu and D. X. Jiang, J. Colloid Interface Sci., 2009, 339, 78–82 CrossRef CAS PubMed.
- Y. P. Zhu, J. Li, T. Y. Ma, Y. P. Liu, G. H. Du and Z. Y. Yuan, J. Mater. Chem. A, 2014, 2, 1093–1101 CAS.
- X. S. Fang, T. Y. Zhai, U. K. Gautam, L. Li, L. Wu, Y. Bando and D. Golberg, Prog. Mater. Sci., 2011, 56, 175–287 CrossRef CAS.
- R. S. Kumar, V. Veeravazhuthi, D. V. Shankar, N. Muthukumarasamy and M. Thambidurai, J. Sol-Gel Sci. Technol., 2014, 71, 152–158 CrossRef.
- G. J. Lee, S. Anandan, S. J. Masten and J. J. Wu, Ind. Eng. Chem. Res., 2014, 53, 8766–8772 CrossRef CAS.
- M. Molaei, F. Karimimaskon, A. Lotfiani, M. Samadpour and H. Liu, J. Lumin., 2013, 143, 649–652 CrossRef CAS.
- S. Sen, C. S. Solanki and P. Sharma, J. Lumin., 2014, 145, 669–675 CrossRef CAS.
- Y. B. Wang, X. H. Liang, X. A. Ma, Y. H. Hu, X. Y. Hu, X. H. Li and J. Fan, Appl. Surf. Sci., 2014, 316, 54–61 CrossRef CAS.
- J. Luo, S. Q. Zhao, P. P. Wu, K. Zhang, C. Peng and S. W. Zheng, J. Mater. Chem. C, 2015, 3, 3391–3398 RSC.
- J. J. Yan, K. Wang, Q. Liu, J. Qian, X. Y. Dong, W. Liu and B. J. Qiu, RSC Adv., 2013, 3, 14451–14457 RSC.
- X. Zhang, S. Yang, L. Q. Sun and A. Q. Luo, J. Mater. Sci., 2016, 51, 6075–6085 CrossRef CAS.
- C. L. Guo and J. Irudayaraj, Anal. Chem., 2011, 83, 2883–2889 CrossRef CAS PubMed.
- J. J. Li, J. J. Zhu and K. Xu, Trends Anal. Chem., 2014, 58, 90–98 CrossRef CAS.
- D. H. Hu, Z. H. Sheng, G. H. Gao, F. M. Siu, C. B. Liu, Q. Wan, P. Gong, H. R. Zheng, Y. F. Ma and L. T. Cai, Biomaterials, 2016, 93, 10–19 CrossRef CAS PubMed.
- K. F. Oguz, E. Ekdal, M. A. A. Aslani, A. Canimoglu, J. Garcia Guinea, N. Can and T. Karali, J. Alloys Compd., 2016, 683, 76–85 CrossRef CAS.
- W. G. Wang, J. Ma, M. X. Wang, Z. Li, X. J. Du, X. J. Feng, W. Zhao, H. S. Xu and C. Luan, Mater. Lett., 2015, 161, 9–12 CrossRef CAS.
- Y. D. Chen, J. Wang, C. Liu, Z. M. Li and G. Li, Nanoscale, 2016, 8, 10059–10065 RSC.
- L. Wang, X. Ma, R. Chen, Y. Q. Yu and L. B. Luo, J. Mater. Sci.: Mater. Electron., 2015, 26, 4290–4297 CrossRef CAS.
- J. Geng, L. P. Jiang and J. J. Zhu, Sci. China: Chem., 2012, 11, 2292–2310 CrossRef.
- H. X. Xu and K. S. Suslick, J. Am. Chem. Soc., 2011, 133, 9148–9151 CrossRef CAS PubMed.
- Q. M. Shen, Q. H. Min, J. J. Shi, L. P. Jiang, W. H. Hou and J. J. Zhu, Ultrason. Sonochem., 2011, 18, 231–237 CrossRef CAS PubMed.
- S. Anandan, G. J. Lee and J. J. Wu, Ultrason. Sonochem., 2012, 19, 682–686 CrossRef CAS PubMed.
- M. Jesionek, M. Nowak, P. Szperlich, D. Stróz, J. Szala, K. Jesionek and T. Rzychon, Ultrason. Sonochem., 2012, 19, 179–185 CrossRef CAS PubMed.
- B. W. Zeiger and K. S. Suslick, J. Am. Chem. Soc., 2011, 133, 14530–14533 CrossRef CAS PubMed.
- H. X. Xu, B. W. Zeiger and K. S. Suslick, Chem. Soc. Rev., 2013, 42, 2555–2567 RSC.
- G. H. Yang, Y. Z. Zhou, H. B. Pan, C. Z. Zhu, S. F. Fu, C. M. Wai, D. Du, J. J. Zhu and Y. H. Lin, Ultrason. Sonochem., 2016, 28, 192–198 CrossRef CAS PubMed.
- P. Sivakumar, P. K. Nayak, B. Markovsky, D. Aurbach and A. Gedanken, Ultrason. Sonochem., 2015, 26, 332–339 CrossRef CAS PubMed.
- L. R. Meng, J. J. Shi, M. Zhao and J. He, Bull. Korean Chem. Soc., 2014, 35, 3521–3526 CrossRef CAS.
- Y. Liu, G. F. Tian, X. W. He, W. Y. Li and Y. K. Zhang, J. Mater. Chem. B, 2016, 4, 1276–1283 RSC.
- J. H. Tian, L. Yan, A. H. Sang, H. Y. Yuan, B. Z. Zheng and D. Xiao, J. Chem. Educ., 2014, 91, 1715–1719 CrossRef CAS.
- M. Karimipour, M. Ebrahimi, Z. Abafat and M. Molaei, Opt. Mater., 2016, 57, 257–263 CrossRef CAS.
- Z. F. Zhu, Z. L. He, J. Q. Li, D. G. Liu and N. Wei, Mater. Res. Innovations, 2010, 14, 426–430 CrossRef CAS.
- C. Karunakaran, G. Manikandan and P. Gomathisankar, J. Alloys Compd., 2013, 580, 570–577 CrossRef CAS.
- J. Hu and Q. M. Wang, Mater. Lett., 2014, 120, 20–22 CrossRef CAS.
- X. M. Zhou, H. J. Du, H. Ma, L. Sun, R. Cao, H. S. Li and P. X. Zhang, J. Phys. Chem. Solids, 2015, 78, 1–7 CrossRef CAS.
- S. K. Maji, N. Mukherjee, A. Mondal, B. Adhikary, B. Karmakar and S. Dutta, Inorg. Chim. Acta, 2011, 371, 20–26 CrossRef CAS.
Footnote |
| † Electronic supplementary information (ESI) available. See DOI: 10.1039/c6ra22634e |
| This journal is © The Royal Society of Chemistry 2016 |

