
Polystyrene controlled growth of zerovalent nanoiron/magnetite on a sponge-like carbon matrix towards effective Cr(VI) removal from polluted water†
Hongbo Gu*a,
Han Loua,
Dong Linga,
Bo Xiang*a and
Zhanhu Guo *b
*b
aShanghai Key Lab of Chemical Assessment and Sustainability, School of Chemical Science and Engineering, Tongji University, Shanghai 200092, People's Republic of China. E-mail: hongbogu2014@tongji.edu.cn; bxiangbo@tongji.edu.cn; Fax: +86 021 65981097; Tel: +86 021 65983695
bIntegrated Composites Lab (ICL), Department of Chemical & Biomolecular Engineering, University of Tennessee, Knoxville, Tennessee 37966, USA. E-mail: zguo10@utk.edu
First published on 3rd November 2016
Abstract
In situ grown zerovalent nanoiron/magnetite on sponge-like carbon matrix (nZVI/Fe3O4@C) has been evaluated for the removal of toxic hexavalent chromium (Cr(VI)) from polluted water. This material is synthesized by calcination of the epoxide group-functionalized polystyrene (FPS) as the carbon source under a mixture of 5% hydrogen/argon (v/v) atmosphere. The nZVI/Fe3O4@C demonstrates a unique capability to remove Cr(VI) from polluted water over a wide pH range, and the optimal pH value for Cr(VI) removal is 5.0 at 298 K. In comparison, only Fe3O4@C is formed when the as-received PS is used as the carbon source under the same atmosphere conditions and exhibits a poor Cr(VI) removal performance (the removal percentage is around 50% relative to nZVI/Fe3O4@C). Various factors influencing the Cr(VI) removal efficiency, such as treatment time, initial Cr(VI) concentration and nZVI/Fe3O4@C dosage, have been systematically studied. The Cr(VI) removal mechanism is confirmed by X-ray photoelectron spectroscopy (XPS) and Raman tests. The results illustrate that the Cr(VI) is reduced to Cr(III) by nZVI with the simultaneous adsorption of Cr(III) via C–O–Fe bonds on nZVI/Fe3O4@C. The Cr(VI) removal kinetics is determined to follow pseudo-first-order behavior with calculated pseudo-first-order rate constants of 0.01582, 0.02555 and 0.03264 min−1 at 298, 308 and 318 K, respectively, at a pH of 5.0. The low value of the activation energy (28.621 kJ mol−1) indicates that the Cr(VI) reduction process on nZVI/Fe3O4@C is a fast process. The calculated thermodynamic parameters of this chemical reaction, including negative ΔG0, positive ΔH0 and positive ΔS0, suggest that the Cr(VI) reduction on nZVI/Fe3O4@C is spontaneous and endothermic, and more preferred at higher temperatures. Both the kinetics and thermodynamics show that the nZVI/Fe3O4@C is a promising material for highly fast and efficient removal of Cr(VI) from polluted water.
1. Introduction
Chromium (Cr) is a common contaminant in surface and ground water in the world due to its wide applications in electroplating, leather tanning, printing, and other metallurgy industries.1,2 Normally, Cr possesses various valence states varying from +6 to −4. However, only trivalent and hexavalent forms are stable in most natural environments.3 Hexavalent chromium Cr(VI) is 500 times more toxic and carcinogenic than trivalent chromium Cr(III).4 Cr(VI) is considered as a priority hazardous pollutant since it can cause severe diseases such as dermatitis and lung cancer.5 The US Environmental Protection Agency (EPA) has issued a maximum concentration of 100 μg L−1 for total Cr in drinking water according to the national primary drinking water regulations (NPDWRs);6 and according to the recommendation of The World Health Organization (WHO), the maximum allowable limit for Cr(VI) in drinking water is at the level of 0.05 mg L−1.7 Therefore, it is of prime importance to find rapid, efficient and economical technologies to stringently treat industrial wastewater and remove Cr(VI) from polluted water before its emission to water bodies in order to meet these limitations.A variety of technologies have been developed for environmental cleanup and remediation of Cr(VI) from waste or drinking water, such as electrochemical precipitation,8 reverse osmosis,9 ion exchange,10 photocatalytic degradation,11 chemical reduction12,13 and adsorption.14,15 Among all of these methods, chemical reduction is recognized as a common technology toward Cr(VI) removal from wastewater system.16 After reduction, the Cr(VI) is reduced to Cr(III). As documented, Cr(VI) is acutely toxic, highly soluble and mobile in the aqueous environment, whereas Cr(III) is relatively immobile because of its low redox potential (Eh = −0.74 V)17 and has a low water solubility (<10−5 M) over a wide pH range.18 Meanwhile, Cr(III) is an essential nutrient for the proper functioning of living organisms.19 Therefore, the combination of Cr(VI) reduction to Cr(III) and subsequent adsorption of Cr(III) has been demonstrated as an effective way for Cr(VI) removal.20,21
In the last two decades, nanoscale zerovalent iron (nZVI), as an excellent electron donor and reductant, has become one of the most promising and effective materials for Cr(VI) reduction due to its low cost and good environmental compatibility.22 Normally, nZVI has a smaller particle size and a larger specific surface area than microsized and bulk iron,23 which can provide nZVI with more effective subsurface dispersibility and higher reactivity for Cr(VI) reduction.24 However, nZVI is easily agglomerated and oxidized by the presence of water and/or oxygen in conventional conditions, which severely decreases its reactivity and limits its applications for the environmental remediation.25 Recently, porous structure materials, such as kaolinite,26 chitosan,27 pillared clay28 and pumice,22 have been reported to serve as supports to foster the dispersibility and the stability of nZVI nanoparticles for polluted water treatment. Meanwhile, it has also been found that the adding of silica29 and magnetite (Fe3O4)19 could significantly enhance the Cr(VI) reduction rate arising from the improved reactivity for electron transfer reactions. For example, the Cr(VI) reduction rate was increased about 48.6% with the adding of Fe3O4.19 Even though polystyrene (PS) is one of the most applied thermoplastic polymers in industry, new recycling and reuse technology is required to be developed to solve the ecological environmental problems by the disposal, and the difficult degradation of these plastic wastes.30 Therefore, as a new potential reuse technique, could PS serve as a carbon source to form the porous structure for support of nZVI nanoparticles? Could the different PS structures control the formation of nZVI nanoparticles and further control the Cr(VI) removal performance of the materials? While a few studies exist regarding PS controlled growth of nZVI on a porous carbon matrix toward Cr(VI) removal, the thermodynamics of the Cr(VI) reduction process has been rarely reported so far.30
In the present study, the in situ grown nZVI/magnetite on sponge-like carbon matrix (nZVI/Fe3O4@C) has been prepared via a simple annealing method using epoxide group functionalized polystyrene (FPS) as the carbon precursor for Cr(VI) removal from polluted water. The morphology and structure of nZVI/Fe3O4@C are characterized by scanning electron microscopy (SEM), high resolution transmission electron microscopy (HRTEM), X-ray diffraction (XRD), X-ray photoelectron spectroscopy (XPS), and Raman measurements. The Cr(VI) removal behaviors from polluted water by nZVI/Fe3O4@C were studied through different parameters including pH, dose of nZVI/Fe3O4@C and initial Cr(VI) concentration. Meanwhile, the Cr(VI) removal kinetics and thermodynamics by nZVI/Fe3O4@C have been systematically investigated. The Cr(VI) removal mechanism was explored by the XPS and Raman tests. In comparison, as-received PS was also used as a carbon source to prepare magnetic carbon nanocomposites, in which only Fe3O4@C is formed and exhibits a poorer Cr(VI) removal performance compared with nZVI/Fe3O4@C. This work provides a comprehensive understanding of the Cr(VI) reduction process, both from the kinetic and the thermodynamic aspects. This knowledge will facilitate the development of novel and efficient nanocomposites for environmental cleanup.
2. Experimental
2.1 Materials
Ferric nitrate (nonahydrate) (Fe(NO3)3·9H2O), potassium dichromate (K2Cr2O7), ethyl acetate (C4H8O2), acetone (C3H6O), cyclohexane (C6H12), ethanol (95%, v/v), epichlorohydrin (C3H5ClO), aluminum chloride anhydrous (AlCl3), sulfuric acid (98 wt%), nitric acid (HNO3, 65–68.0 wt%), hydrochloric acid (HCl, 36.0–38.0 wt%), sodium hydroxide (NaOH), and anhydrous ethanol were purchased from Sinopharm Chemical Reagent Co., Ltd. Polystyrene (PS, Mw ≈ 57![[thin space (1/6-em)]](https://www.rsc.org/images/entities/char_2009.gif) 700) was obtained from Taizhou Suosi education equipment Co., Ltd. All of the chemicals were used as-received.
700) was obtained from Taizhou Suosi education equipment Co., Ltd. All of the chemicals were used as-received.
2.2 Fabrication of epoxide FPS
PS solution (5.0 wt%) was acquired by dissolving a certain amount of PS granules in a mixed solvent (25.0 mL) composed of acetone, cyclohexane and ethyl acetate with a volume ratio of 5:9:11 at room temperature. Then, 11.0 wt% of AlCl3 (dissolved in 5.0 mL anhydrous ethanol) was added into the solution with magnetic stirring over 30 min. Then, epichlorohydrin (1.1 mL) was dropped into the above solution under magnetic stirring for a further 30 min reaction.
2.3 Preparation of the synthesized nanocomposites
The mixture containing Fe(NO3)3·9H2O (1.5 g) and anhydrous ethanol (1.5 mL) was poured into the above FPS solution. The mixed solution was mechanically stirred for 30 min at room temperature to make the Fe(NO3)3·9H2O be homogeneously dispersed within the FPS. The well-mixed solution was then placed into a fume hood to completely evaporate the mixed solvent. The residual solid (Fe(NO3)3/FPS) was loaded in a tube furnace and annealed at 500 °C for 30 min with a heating rate of 5 °C min−1 under 5% hydrogen/argon (v/v) conditions at a flow rate of 20 mL min−1. For convenient comparison with other materials, nZVI/Fe3O4@C was abbreviated as FH. In comparison, the same process was used to prepare the magnetic carbon nanocomposites derived directly from the as-received PS solution. Concisely, the Fe(NO3)3·9H2O-anhydrous ethanol mixture was poured into the PS solution for annealing under the same procedure as aforementioned. These magnetic carbon nanocomposites were named as UH. In addition, the carbon nanocomposites fabricated via the same procedure with the FH under a nitrogen atmosphere were indexed as FN.2.4 Characterization of synthesized nanocomposites
A field emission scanning electron microscope (FE-SEM, Hitachi S-4800 system) was used to obtain the morphologies of the synthesized nanocomposites and the samples were prepared by adhering the samples onto an aluminum plate. HRTEM was observed on a Tecnai G2 F20 S-TWIN. The crystalline structures of the resultant products were obtained by powder XRD analysis on a Bruker AXS D8 Discover diffractometer with GADDS (General Area Detector Diffraction System) operating with a Cu-Kα radiation source filtered with a graphite monochromator (λ = 1.5406 Å). Thermal gravimetric analysis (TGA) was conducted from ambient temperature to 850 °C in air at a heating rate of 20 °C min−1 using a SDT thermal-microbalance apparatus. The Raman spectra were measured using a Raman microscope (Invia, Renishaw) with 785 nm laser excitation at a 1.5 cm−1 resolution at room temperature. XPS was recorded by a Kratos AXIS Ultra DLD spectrometer using Al Kα (hν = 1486.6 eV) radiation as the excitation source under an anode voltage of 12 kV and an emission current of 10 mA. The C1s, Fe2p and Cr2p peaks were de-convoluted into the components consisting of a Gaussian line shape Lorentzian function (Gaussian = 80%, Lorentzian = 20%) on Shirley background. Brunauer–Emmett–Teller (BET) analysis was carried out to measure the specific surface area of the magnetic carbon nanocomposites. Nitrogen adsorption and desorption isotherms were achieved using a surface area analyzer (TriStar 3020, Micromeritics Instrument Ltd.). The pore size distribution of the nanocomposites was calculated by the Barrett–Joyner–Halenda (BJH) method using the nitrogen desorption isotherm. The samples (around 0.1 g) were weighed and put inside of the sample holder cell. The refrigerant was liquid nitrogen placed in a vacuum Dewar at about 77 K and the carrier gas was nitrogen. The magnetic properties were measured on a 9 Tesla Physical Properties Measurement System (PPMS, Quantum Design) at room temperature. The surface zeta potentials of the nanocomposites were determined by a DLS Particle Size analyzer (Zetasizer Nano-ZS, Malvern, U.K.). The samples (around 5 mg) were ultrasonically (model: SK 3200H) dispersed in 10 mL deionized water with different pH values of 3, 5, 7, 9 and 11. The injected balance time was set as 30 seconds. The reported values for each sample were the average of two measurements with a standard deviation of ±5%.2.5 Cr(VI) removal measurement
The K2Cr2O7 stock solution (1.0 g L−1) was prepared by dissolving 0.2829 g of K2Cr2O7 in deionized water to form a 100.0 mL of solution. The Cr(VI) standard solution was prepared by diluting a certain volume of K2Cr2O7 stock solution to 100.0 mL with deionized water. The Cr concentration in the solution was determined by inductively coupled plasma optical emission spectrometry (ICP-OES, 8300). The calibration curve of Cr was established using 4 points of calibration (blank, 1.0, 10.0 and 20.0 ppm). After the calibration, various quality control (QC) samples were used to analyze and determine the accuracy of the calibration. Then, the treatment materials were isolated by a permanent magnet and the supernatant liquids were taken out to determine the concentration of total Cr in the solution. The reported values for each sample were the average of three measurements with a standard deviation of ±5%.The Cr(VI) removal percentage (R%) is obtained by using eqn (1):
 | (1) |
 | (2) |
For the thermodynamic test, FH (1.0 g L−1) was used to treat different initial Cr(VI) concentrations at 6.0, 8.0, 10.0, 15.0, 20.0 and 30.0 mg L−1 and a pH of 5.0 with a treatment time of 30 min at different temperatures from 298 to 318 K. The supernatant was used for residual Cr concentration determination.
3. Results and discussion
3.1 Structure characterization of the as-prepared nanocomposites
Fig. 1 shows the SEM and HRTEM micrographs of UH and FH. Fig. S2† depicts the HRTEM image of FN. In Fig. 1A, the UH is observed to be particulate and have a bar-like morphology with an average diameter of about 30 nm. However, a sponge-like structure is obtained in the FH samples, Fig. 1B. The EDS mapping images of FH show the homogeneous distribution of iron, carbon and oxygen elements in the whole measured range (Fig. S1†). The HRTEM image for UH nanocomposites (Fig. 1C) reveals that the inside of the nanoparticles observed in the SEM image (Fig. 1A) is a crystallized structure and the outside is an amorphous structure. The clear lattice fringe indicates the formation of highly crystalline nanoparticles.31 The calculated lattice distance of 0.297 nm corresponds to the (2 2 0) crystallographic plane of Fe3O4 (PDF#65-3107). For the HRTEM image of FH samples, Fig. 1D, it is also observed that the FH comprises the crystallized structure inside and the amorphous structure outside. However, the calculated lattice distances of 0.213, 0.252 and 0.297 nm are attributed to Fe (1 0 0) (PDF#65-5099), Fe3O4 (3 1 1) and (2 2 0) (PDF#65-3107), respectively. This means that both of Fe3O4 and Fe contribute to the crystallized structure in FH, which is different from that of UH. These results demonstrate that the Fe(NO3)3 prefers to form both Fe3O4 and ZVI after mixing with epoxide functionalized FPS during the calcination in hydrogen/argon atmosphere; whereas only Fe3O4 exists in the mixture of Fe(NO3)3 with as-received PS after annealing in the same atmosphere. Meanwhile, for the FN sample, Fig. S2,† the amorphous carbon structure is observed to be distributed within the crystallized structures. This means that the different PS structures can control the Fe(NO3)3 to form different iron structures during calcination. | ||
| Fig. 1 SEM micrographs of (A) UH and (B) FH. HRTEM images of (C) UH and (D) FH. | ||
Fig. 2A and S3† illustrate the XRD curves from 10 to 70 degrees for UH, FH and FN, respectively. The diffraction peaks of these three materials located at around 30.1, 35.5, 43.2, 53.5, 56.9 and 62.6° correspond to the (2 0 0), (3 1 1), (4 0 0), (4 2 2), (5 1 1) and (4 4 0) crystallographic planes of the spinel phase of Fe3O4 (JCPDS no. 65-3107), respectively. Obviously, in both the UH and FN samples, both the high intensity and the sharp peaks show that Fe3+ from Fe(NO3)3 has been transformed to Fe3O4 at the carbonization temperature of 500 °C. This indicates that there are no other products generated during the process of calcination apart from ferroferric oxide. However, in the FH sample, the reflections at 43.2, 56.9 and 62.6° are not sharp peaks. It is found that the small peaks located around 43.0, 56.7 and 63.2° are attributed to the (1 0 0), (1 0 3) and (1 0 2) crystallographic planes of ZVI,32 which are consisted with the result obtained in HRTEM. Normally, this is typical for amorphous materials and ultrasmall crystalline materials where the diffraction peaks cannot be well resolved.33 Therefore, the small diffraction peaks of ZVI means that the crystalline size of ZVI in FH is very small. The average crystallite size of UH and FH can be quantified from the XRD pattern according to the Scherrer equation:34
|
β = kλ/Dcosθ
| (3) |
 | ||
| Fig. 2 (A) XRD patterns of (a) UH and (b) FH. (B) TGA curves of FH, UH, PS and FPS. (C) Raman spectra of (a) UH and (b) FH. (D) Nitrogen adsorption–desorption isotherms and pore size distributions of (a) UH and (b) FH. | ||
The TGA profiles shown in Fig. 2B depict the weight loss of UH, FH, PS and FPS within the temperature range from room temperature to 850 °C in an air atmosphere. Normally, the slight mass decrease before 150 °C is attributed to the loss of moisture in the samples. The major weight loss of PS and FPS is from 390 to 450 °C and 300 to 430 °C, respectively, which arises from the large scale thermal degradation of PS chains. However, the decomposition temperature for FH moves to the range of 400 to 550 °C. This result indicates that the functionalization of PS can significantly enhance the thermal stability of nZVI/Fe3O4@C. Moreover, the weight residues of UH and FH are around 81.2 and 69.7%, respectively. This demonstrates that the epoxide FPS can inhibit the degradation of PS chains and prefer to form a carbonaceous structure during the calcination process, resulting in the increased carbon content of FH.
The as-prepared FH and UH were also measured by Raman spectra and the results are shown in Fig. 2C. The D-band peak at around 1344 cm−1, due to the sp3 C–C bond, and the G-band peak at around 1597 cm−1, resulting from the C![[double bond, length as m-dash]](https://www.rsc.org/images/entities/char_e001.gif) C bond stretching vibrations,35 are observed in both FH and UH. However, for the FH sample, both the D-band peak and the G-band peak are shifted a little bit to a higher wavenumber (1349 and 1598 cm−1 (not obvious), respectively). Meanwhile, a broad peak located at about 1438 cm−1 appears and is attributed to the bond of C–O–Fe,36 which maybe formed from the epoxide group of FPS with the iron ion of Fe(NO3)3 during annealing.37 This further contributes to the increased carbon content in FH, as observed in TGA measurements.
C bond stretching vibrations,35 are observed in both FH and UH. However, for the FH sample, both the D-band peak and the G-band peak are shifted a little bit to a higher wavenumber (1349 and 1598 cm−1 (not obvious), respectively). Meanwhile, a broad peak located at about 1438 cm−1 appears and is attributed to the bond of C–O–Fe,36 which maybe formed from the epoxide group of FPS with the iron ion of Fe(NO3)3 during annealing.37 This further contributes to the increased carbon content in FH, as observed in TGA measurements.
The specific surface area and pore size distribution of the synthesized FH and UH are obtained by the nitrogen adsorption and desorption isotherms (Fig. 2D). The type-IV adsorption–desorption isotherm curves with the hysteresis loop demonstrate the mesoporous characteristics of UH and FH nanocomposites.38 The BET specific surface area of UH and FH are calculated to be 96 and 119 m2 g−1, respectively. The BJH pore size distribution obtained from the desorption branch is shown in the inset of Fig. 2D. It is seen that the wide pore diameter size distribution of UH ranges from 4 to 13 nm, and the highest pore volume of 0.00277 cm3 g−1 nm−1 corresponds with the pore diameter of 10.55 nm. However, for the FH, the highest pore volume of 0.00399 cm3 g−1 nm−1 corresponds to the pore diameter of 2.47 nm, and the pore size of FH is located at around 2.47 nm with a narrow size distribution. The narrow pore size distribution of FH probably resulted from the homogeneous distribution of iron ions from Fe(NO3)3 in the FPS solution before annealing.
The chemical elemental composition of UH, FH and FN was further investigated via XPS test. Fig. 3A and B and S4† show the deconvolution of the high-resolution Fe2p XPS spectra of UH, FH and FN, respectively. The Fe2p peak from the UH is de-convoluted into four major components with peaks at 709.6, 711.1, 722.7 and 724.2 eV. The peaks at 709.6 and 722.7 eV are attributed to Fe2+, and the peaks at 711.1 and 724.2 eV correspond to Fe3+.39 For the FN sample, Fig. S4,† the peaks at 710.2 and 723.8 eV correspond to Fe2p3/2 and Fe2p1/2, respectively, which correspond to the XPS of Fe3O4. This result is consistent with the XRD result. However, the Fe2p peaks from the FH are located at 707.3, 709.6, 715.2, 720.5, 722.9 and 730.3 eV. The peaks at 707.3 and 720.5 eV are assigned to ZVI,40 and the peaks at 715.2 and 730.3 eV, 709.6 and 722.9 eV are attributed to Fe3+ and Fe2+, respectively. This result confirms the presence of ZVI in FH, which is consistent with HRTEM and XRD results. According to the integral area, the contents of Fe and Fe3O4 are 44.13% and 55.87%, respectively. Based on the TGA result, the contents of Fe and Fe3O4 in FH are calculated to be 30.76% and 38.94%, respectively. Fig. 3C shows the deconvolution of the high-resolution C1s XPS spectra of FH. The C1s peak is de-convoluted into four major components with peaks at 284.7, 285.5, 286.6 and 289.2 eV, which are attributed to C–C, C–O–Fe, C–OH and CO bond, respectively.21,41–43 The presence of C–O–Fe is also observed in the Raman spectrum. Meanwhile, in the XPS quantification result, the carbon content of FH is 10% more than that of UH, which is accordant with the TGA curves.
 | ||
| Fig. 3 High resolution Fe2p XPS spectra of (A) UH, (B) FH, (C) C1s of FH and (D) magnetization curves of (a) UH and (b) FH. The top inset shows that FH can be attracted by a permanent magnet and the bottom inset shows the coercivity of FH and UH. | ||
The magnetization curves of UH and FH at room temperature are depicted in Fig. 3D. It shows that both UH and FH exhibit good magnetic properties. The FH performs saturation magnetization (Ms) of 14 emu g−1 in the measured magnetic field range. This value is enough for the immediate recycling of FH from the Cr(VI) solution by a permanent magnet, as shown in the top inset of Fig. 3D. This is an important factor for the separation of the magnetic nanocomposites after the purification of wastewater.44 However, the magnetization of UH has not reached saturation in the measured magnetic field range. Therefore, the Ms of UH is estimated from the extrapolated Ms obtained from the intercept of M–H−1 at a high magnetic field.45 The obtained Ms value of UH is 80 emu g−1, which is much higher than that of FH. The bottom inset of Fig. 3D shows that both FH and UH have a similar coercivity value of around 240 Oe, which indicates that both of these two nanocomposites are hard materials.34
Based on the above analysis, the results show that nZVI/Fe3O4@C can be obtained in the presence of both of FPS and hydrogen/argon. In the existence of as-received PS or in the nitrogen atmosphere, only the Fe3O4@C microstructure is formed. The formed products in the different conditions are shown in Scheme 1 in order to further understand the Cr(VI) removal performance differences of these samples.
 | ||
| Scheme 1 Schematic for the formed products under the different reaction conditions. | ||
3.2 Cr(VI) removal performance evaluation
Fig. 4A shows the Cr(VI) removal percentages by the different nanocomposites (1 g L−1) in the 2.0 mg L−1 Cr(VI) solution with an initial pH of 7.0 for a short treatment time of 5 min. The FH can completely remove 2.0 mg L−1 Cr(VI) within 5 min, while the FN nanocomposites only exhibit Cr(VI) removal from the aqueous solution with a low removal percentage of 59.13%. UH also shows a poor Cr(VI) removal percentage of 50.11%. This result illustrates the superior Cr(VI) removal performance of the synthesized FH over UH and FN. This may be from the different structures of these three samples, as in the aforementioned analysis.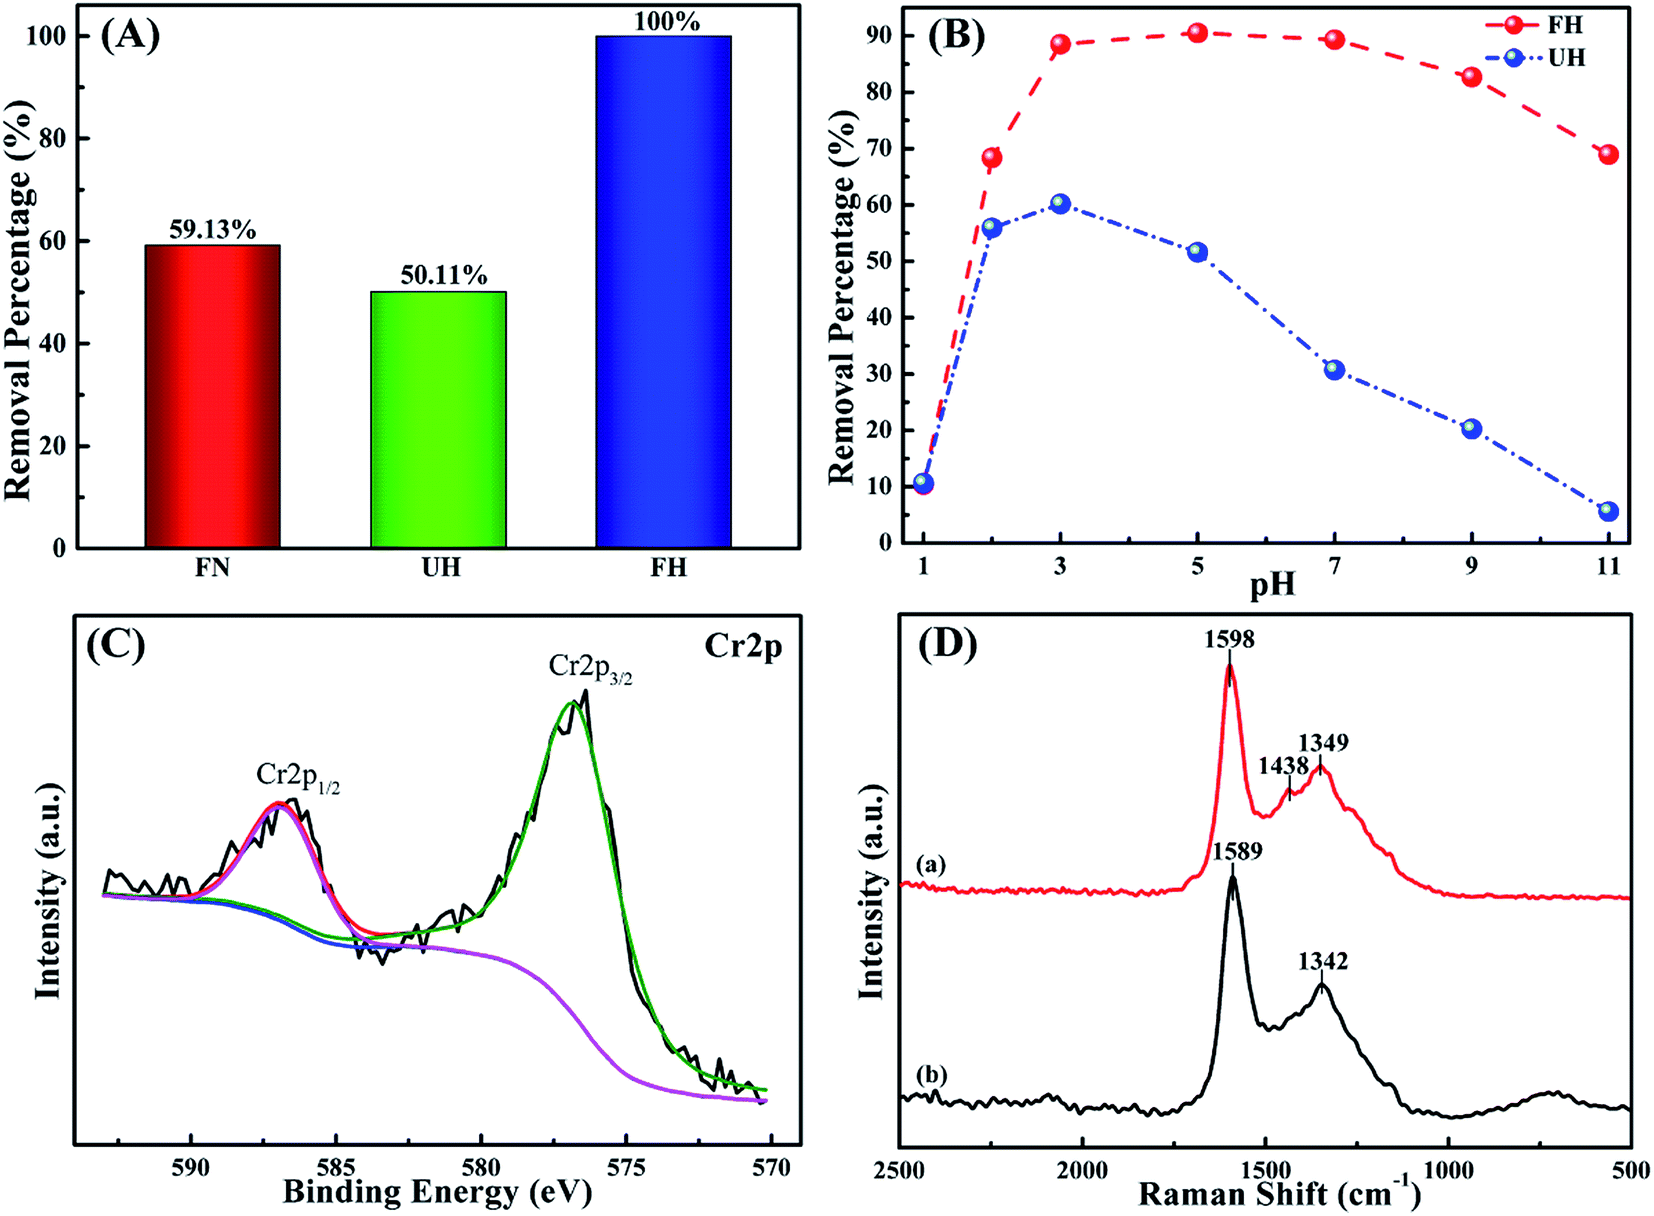 | ||
| Fig. 4 (A) Removal percentage comparison of 1.0 g L−1 FN, UH and FH nanoparticles treated with 20.0 mL Cr(VI) solution with an initial Cr(VI) concentration of 2.0 mg L−1 (5 min treatment time). (B) Removal percentage of 1.0 g L−1 UH and FH at different pH values of 20.0 mL Cr(VI) solutions with an initial concentration of 5.7 mg L−1 (5 min at room temperature). (C) High resolution Cr2p XPS spectra of FH after treatment with 10.0 mg L−1 Cr(VI) solution at pH = 5.0 (5 min at room temperature). (D) Raman spectra of FH before treatment (a) and after treatment (b) with 10.0 mg L−1 Cr(VI) solution at pH = 5.0 (5 min at room temperature). | ||
Fig. 4B illustrates the Cr(VI) removal percentage from the solutions with an initial Cr(VI) concentration of 5.7 mg L−1 and the pH values ranging from 1.0 to 11.0 after 5 min treatment with 1.0 g L−1 of FH and UH at room temperature, respectively. The Cr(VI) removal percentages by FH and UH are observed to be strongly dependent on the pH values of the solution. Normally, the pH-dependent heavy metal removal performance is associated with both the metal chemistry in the solution and the type of treatment material.46 For UH, the removal percentage first increases and then declines with increasing the solution pH. The highest removal percentage is obtained to be 60.18% at pH = 3.0. In comparison, FH exhibits a higher Cr(VI) removal percentage than the UH at each pH value within the whole measured pH range. As for FH, the removal percentage is from 10.38% for pH = 1.0 solution to 68.37% for pH = 2.0 solution and continuously increases to 88.51% and 90.52% for pH = 3.0 and 5.0 solutions, respectively. However, the removal percentage gradually decreases with further increasing the solution pH. The Cr(VI) removal percentages for pH = 7.0, 9.0 and 11.0 are 89.32, 82.67 and 68.93%, respectively. It is clear to see that the synthesized FH shows a unique Cr(VI) removal performance over a wide pH range.
Since the ICP-OES test cannot provide the chemical valence state of elements in the solution, the Cr(VI) concentrations remained in the same solutions with different pH values after treatment with FH were also measured by a colorimetric method,47 in which only Cr(VI) could be detected. The obtained results are listed in Table S1.† Only a small difference in Cr concentrations between ICP-OES and colorimetric method is found, indicating that the Cr concentrations measured by ICP-OES are dominated by Cr(VI) in this study.
As documented, the most important forms of Cr(VI) in aqueous solution are chromate (CrO42−), dichromate (Cr2O72−) and hydrogen chromate (HCrO4− and H2CrO4), and these ion forms are related to the solution pH and the total Cr concentration.47 HCrO4− is the dominant form when the pH is lower than 6.8, while CrO42− and Cr2O72− are stable when the pH is above 6.8.48 However, FH has an isoelectric point at around pH of 3.2 as depicted in Fig. S5,† which means the surface of FH is negatively charged at around pH of 5.0. According to the electrostatic interaction, a strong electrical repulsion force exists between FH and HCrO4−. Therefore, Cr(VI) removal by FH at the optimal pH of 5.0 is not because of electrostatic attraction.
In order to understand the Cr(VI) removal mechanism in different pH solutions, Raman and XPS measurements were performed. High resolution XPS was used to confirm the Cr element chemical state. Generally, for the high resolution XPS spectrum of Cr2p, the binding energy peaks at 577.0–578.0 eV and 586.0–588.0 eV correspond to Cr(III), and the binding energy peaks for Cr(VI) are at around 580.0–580.5 eV and 589.0–590.0 eV.49 Fig. 4C shows the Cr2p XPS spectra of FH treated with 20.0 mL of pH = 5.0 solution with an initial Cr(VI) concentration of 10.0 mg L−1 for 5 min at room temperature. After de-convolution, the binding energy peaks of Cr are located at 576.8 and 587.1 eV, indicating that the Cr adsorbed on the surface of the FH is in the form of Cr(III). The former peak arises from the Cr2p3/2 orbital and the latter from the Cr2p1/2 orbital.50 No Cr(VI) binding energy peaks were detected in the high resolution Cr2p XPS spectrum, indicating that the Cr(VI) removal mechanism by FH is due to a redox reaction in which the Cr(VI) has been reduced to Cr(III). Comparing the results from ICP-OES and the aforementioned colorimetric method, most of the remaining Cr after treatment is Cr(VI), which illustrates that the obtained Cr(III) after reduction is simultaneously adsorbed onto the FH. The EDS mapping image in Fig. S6E† shows the adsorbed Cr(III) distribution within FH. As shown in Fig. S7,† the Fe2p spectrum of the Cr(III)-adsorbed FH is de-convoluted into four major components with peaks at 710.1, 722.9, 711.5 and 724.9 eV, which are attributed to Fe2+ and Fe3+, respectively,51 without the binding energy peak of ZVI. This result indicates that nZVI has been oxidized to a higher chemical valence with the reduction of Cr(VI). Fig. 4D shows the Raman spectra of FH before and after treatment of Cr(VI). The peak for the C–O–Fe bond of FH has disappeared after removal of Cr(VI). The D-band peak of 1349 cm−1 and the G-band peak at around 1598 cm−1 have shifted to 1342 and 1589 cm−1, respectively. This phenomenon demonstrates that there is an interaction between the C–O–Fe bond of FH and the adsorbed Cr(III). Normally, the bond of C–O–Fe in FH is an electron-donating functional group, which is favorable to combine with the positively charged Cr(III) with a vacant orbital.52
Based on the aforementioned analysis, the Cr(VI) removal mechanism by the FH is schematically shown in Scheme 2. Normally, the ZVI is the direct electron donor for Cr(VI) reduction.53 The redox reaction occurs at the interface between the FH and the Cr(VI) species, and the Cr(VI) is reduced to Cr(III). Then, Cr(III) can be coordinated with C–O–Fe groups, leading to the simultaneous adsorption of Cr(III) on the surface of FH.48 The iron ion concentration in the solution with different pH values was detected via ICP-OES after treatment with FH and the results are shown in Table S2.† Increased Fe ion concentration in the pH = 1.0 solution was found (there was no Fe ion present before treatment), which means that there is a part of nZVI dissolved in the pH = 1.0 solution. Since the Cr(VI) removal by FH is mainly due to the presence of nZVI (as confirmed above), this explains the low removal percentage of Cr(VI) (10.38%) obtained in the pH = 1.0 solution.
 | ||
| Scheme 2 Schematic for the Cr(VI) removal mechanism by FH. | ||
The effect of the initial Cr(VI) concentration on the Cr(VI) removal percentage and removal capacity was investigated in the Cr(VI) solution with pH of 5.0 after treatment with FH for 5 min (Fig. 5A). The synthesized FH, with a dose of 1.0 g L−1, was able to treat a 20.0 mL Cr(VI) solution in the concentration range of 1.0–3.0 mg L−1 at 100% Cr(VI) removal. With increasing the initial Cr(VI) concentration, the Cr(VI) removal percentage decreased sharply with increasing initial Cr(VI) concentration from 3.0 to 10.0 mg L−1, and then decreased slightly with further higher initial Cr(VI) concentrations. In contrast, the Cr(VI) removal capacity increased from 1.00 to 7.78 mg g−1 (the normalized Cr(VI) removal capacity to nZVI is from 3.25 mg g−1 to 25.29 mg g−1) for solutions with an initial Cr(VI) concentration changing from 1.0 to 16.0 mg L−1, and then decreased to 7.66 mg g−1 (the normalized Cr(VI) removal capacity to nZVI is 24.90 mg g−1) for solutions with an initial Cr(VI) concentration of 18.0 mg L−1, which was due to the limited number of FH active sites for Cr(VI) reduction in the solutions with high Cr(VI) concentration.52
 | ||
| Fig. 5 (A) Removal percentage and removal capacity of 1.0 g L−1 FH for a 20.0 mL Cr(VI) solutions with different initial Cr(VI) concentrations after 5 min treatment time at a pH of 5.0 at room temperature. (B) Removal percentage and removal capacity of different FH doses for a 20.0 mL Cr(VI) solution with an initial concentration of 10.5 mg L−1 and pH of 5.0 after 5 min treatment time at room temperature. | ||
Fig. 5B depicts the Cr(VI) removal percentage and removal capacity with different FH doses in a 20.0 mL of solution with initial Cr(VI) concentration of 10.5 mg L−1 and pH of 5.0 after 5 min treatment at room temperature. The Cr(VI) removal percentage increased with increasing FH doses from 25.45% for a FH dose of 0.5 g L−1 to 100% for a FH dose of 2.5 g L−1 due to the increased number of FH active sites for reduction of Cr(VI). However, the Cr(VI) removal capacity firstly increased from 4.98 mg g−1 for a FH dose of 0.5 g L−1 to 5.86 mg g−1 with a FH dose of 1.5 g L−1, and then the Cr(VI) removal capacity declined gradually from 5.86 mg g−1 for a FH dose of 1.5 g L−1 to 4.17 mg g−1 with a FH dose of 2.5 g L−1. At a low FH dose, the reduction of FH active sites was well occupied by the Cr(VI), leading to an increase in the removal capacity. However, since the concentration of Cr(VI) in the aqueous solution was fixed, as the Cr(VI) in the aqueous solutions was reduced and the obtained Cr(III) simultaneously adsorbed on the FH, the number of the unsaturated sites grew, which would lead to a decrease in the removal capacity.
3.3 Cr(VI) treatment kinetics
The kinetics of Cr(VI) removal was studied and the Cr(VI) concentration change in the pH = 5.0 solution during different treatment periods is shown in Fig. 6. The Cr(VI) concentration in the solution during a 30 min treatment period decreases from 10.5 to 3.7 mg L−1 and after that it reaches the equilibrium, Fig. 6A. Compared to the 30 min equilibrium time for the FH, equilibration of nanocrystalline akaganeite (iron(III) oxide-hydroxide/chloride mineral) has been reported to require 1 h,54 active carbon required 3 h55 and oxidized multi-walled carbon nanotubes (MWNTs) required 280 h.56 Thus, the synthesized FH shows a fairly good performance for Cr(VI) removal. | ||
| Fig. 6 (A) Cr(VI) concentration change of 1.0 g L−1 FH after treatment with 20.0 mL Cr(VI) solution (pH = 5.0; 10.5 mg L−1) with different treatment periods at room temperature. Kinetic plots after treatment with 20.0 mL Cr(VI) solution of pH = 5.0, 10.5 mg L−1 of (B) 298 K, (C) 308 K and (D) 318 K. | ||
The representative kinetics (i.e. reduction rate of Cr(VI) by the FH) in the pH = 5.0 Cr(VI) solution is obtained, Fig. 6B. For the FH system, the reduction of Cr(VI) and the oxidation of Fe can be described by eqn (4).
| Cr(VI) (aq) + H+ (aq) + Fe (s) → Cr(III) (aq) + Fe2+(II) + H2O (l) | (4) |
From eqn (4), the reaction rate is related to these different species: Cr(VI), H+ and Fe. Accordingly, for the chemical reaction, the rate equation is mathematically expressed as eqn (5):
 | (5) |
 | (6) |
The kinetics in the Cr(VI) solutions with T = 308 and 318 K were also investigated to study the temperature effect on the reduction rate constant and the results are illustrated in Fig. 6C and D. It is observed that both reactions at these temperatures obey the pseudo-first-order kinetic behavior with a correlation coefficient R2 of 0.97782 and 0.98549 for T = 308 and 318 K, respectively. The typical values of the pseudo-first-order rate constants obtained from the slope are 0.02555 and 0.03264 min−1 for solutions at T = 308 and 318 K, respectively. The rate constants at three different temperatures obey the following decreasing relationship: k′318 > k′308 > k′298, which demonstrates that temperature can foster the Cr(VI) reduction process on FH. According to Arrhenius formula:
 | (7) |
The activation energy E and pre-exponential factor A were obtained from the slope and the intercept of the linear plot of −lnk vs. 1/T, as depicted in Fig. S8.† The obtained activation energy and pre-exponential factor were 28.621 kJ mol−1 and 1702.1 min−1, respectively. The results are listed in Table 1. Normally, the chemical reaction rate is very fast as the E < 40 kJ mol−1.63 Therefore, the Cr(VI) reduction process on FH is a fast process as determined from E.
| T (K) | k′ (min−1) | E (kJ mol−1) | A (min−1) |
|---|---|---|---|
| 298 | 0.01582 | 28.621 | 1702.1 |
| 308 | 0.02555 | ||
| 318 | 0.03264 |
3.4 Thermodynamic analysis
Normally, the thermodynamic analysis can provide information about the energy change in the chemical reaction process of Cr(VI) on FH through the thermodynamic equilibrium constant (Kθ), which is associated with the temperature.64 In pH 5.0 solution, the Cr(VI) reduction process on FH is described as eqn (8).| 2HCrO4− (aq) + 14H+ (aq) + 3Fe (s) → 2Cr3+ (aq) + 3Fe2+ (s) + 8H2O (l) | (8) |
According to eqn (8), Kθ is calculated from eqn (9).
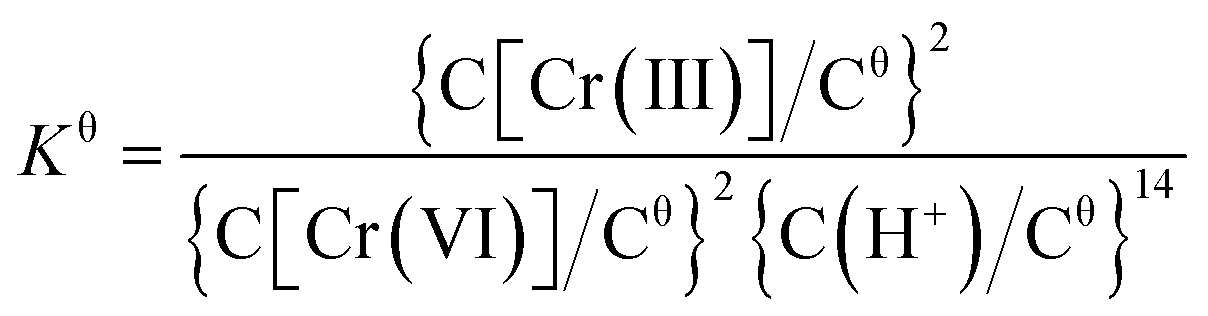 | (9) |
Three parameters, including standard Gibb's free energy change (ΔG0, kJ mol−1), standard enthalpy change (ΔH0, kJ mol−1) and standard entropy change (ΔS0, J mol−1 K−1), are used to describe the thermodynamic process of an chemical reaction.65 These parameters can be calculated by the following eqn (10) and (11):
 | (10) |
|
ΔG0 = −RTlnKθ
| (11) |
Kθ vs. 1/T.
As aforementioned, the Cr(VI) reduction equilibrium was achieved after 30 min treatment. Therefore, 30 min was chosen to make sure the equilibrium was reached for the investigation of Cr(VI) reduction thermodynamics on FH at different temperatures of T = 298, 308 and 318 K in pH 5.0 solution. Based on the experimental results and eqn (9), the calculated average lnKθ at different temperatures is listed in Table 2. ΔG0 at different temperatures were obtained based on the Kθ values from eqn (11) and also depicted in Table 2. The ΔG0 was negative at the measured temperature range. This means that the reduction process of Cr(VI) on FH was thermodynamically feasible and spontaneous.64 Meanwhile, it was observed that the ΔG0 values for different temperatures only have little differences (−169.406, −177.590 and −184.914 kJ mol−1 for 298, 308 and 318 K, respectively). The ΔH0 and ΔS0 were obtained from the slope and the intercept of the linear plot of lnKθ vs. 1/T, as depicted in Fig. S9,† and also listed in Table 2. It was shown that the ΔH0 was positive with the value of 61.763 kJ mol−1, which means that the Cr(VI) reduction by FH was an endothermic process.66 This is consistent with the results obtained from the kinetics studies showing that the Cr(VI) reduction rate constant increased with increasing temperature. The positive ΔS0 (776.190 J mol−1 K−1) depicts the increased randomness during the Cr(VI) reduction reaction on FH.67 The combination of positive ΔH0 and ΔS0 with a negative ΔG0 mean that the spontaneous process is more favorable at higher temperatures.68
| T (K) | lnKθ |
ΔG0 (kJ mol−1) | ΔH0 (kJ mol−1) | ΔS0 (J mol−1 K−1) |
|---|---|---|---|---|
| 298 | 68.376 | −169.406 | 61.763 | 776.190 |
| 308 | 69.352 | −177.590 | ||
| 318 | 69.941 | −184.914 |
4. Conclusions
The epoxide functionalized PS controlled nZVI/Fe3O4@C, with a large surface area of 119 m2 g−1, was fabricated through a calcination method, and its ability to remove Cr(VI) from polluted water was evaluated. In contrast, the Fe3O4@C derived from the as-received PS was prepared with the same method and showed a poorer Cr(VI) removal performance. The synthesized nZVI/Fe3O4@C shows an amazing removal performance of Cr(VI) over a wide pH range; and the optimal pH for Cr(VI) removal is around 5.0 at room temperature. 1.0 g L−1 of the nZVI/Fe3O4@C is able to completely remove Cr(VI) from a 20.0 mL solution with an initial Cr(VI) concentration of 3.0 mg L−1 after 5 min treatment time, which can satisfy the limitation of the US EPA requirement. The nZVI/Fe3O4@C dose of 2.25 g L−1 can remove 90.4% of Cr(VI) from 20.0 mL of 10.5 mg L−1 Cr(VI) solution at a pH of 5.0 with the normalized Cr(VI) removal capacity to nZVI being 25.29 mg g−1. The main mechanism for the Cr(VI) removal is disclosed as the reduction of Cr(VI) to Cr(III) by the oxidation of nZVI with the simultaneous adsorption of Cr(III) through C–O–Fe bonds on nZVI/Fe3O4@C, as confirmed by XPS and Raman tests. The kinetics of Cr(VI) removal with the nZVI/Fe3O4@C is observed to follow pseudo-first-order kinetics with an initial reaction rate of 0.01582, 0.02555 and 0.03264 min−1 for temperatures of 298, 308 and 318 K, respectively. The calculated activation energy of 28.621 kJ mol−1 confirms that the Cr(VI) reduction process by nZVI/Fe3O4@C is a fast process. The chemical reaction thermodynamic parameters of positive ΔH0 and ΔS0 with negative ΔG0 indicate that the Cr(VI) reduction by the nZVI/Fe3O4@C is spontaneous and endothermic. It will also take place more favorably at higher temperatures. Moreover, the nZVI/Fe3O4@C can be easily separated from solution using a permanent magnet after being treated with Cr(VI). All the results demonstrate that the nZVI/Fe3O4@C can behave as a promising material for Cr(VI) removal from polluted water.Acknowledgements
This work is supported by Shanghai Science and Technology Commission (14DZ2261100). H. Gu thanks the financial support from the Science and Technology Commission of Shanghai Municipality (No. 15YF1412700) and Program for Young Excellent Talents in Tongji University (No. 2014KJ028).References
- B. Qiu, Y. Wang, D. Sun, Q. Wang, X. Zhang, B. L. Weeks, R. O'Connor, X. Huang, S. Wei and Z. Guo, J. Mater. Chem. A, 2015, 3, 9817–9825 CAS.
- J. Gu, X. Yang, C. Li and K. Kou, Ind. Eng. Chem. Res., 2016, 55, 10941–10946 CrossRef CAS.
- A. Qian, P. Liao, S. Yuan and M. Luo, Water Res., 2014, 48, 326–334 CrossRef CAS PubMed.
- S. P. Dubey and K. Gopal, J. Hazard. Mater., 2007, 145, 465–470 CrossRef CAS PubMed.
- J. Kotaś and Z. Stasicka, Environ. Pollut., 2000, 107, 263–283 CrossRef.
- M. S. Sivakami, T. Gomathi, J. Venkatesan, H. S. Jeong, S. K. Kim and P. N. Sudha, Int. J. Biol. Macromol., 2013, 57, 204–212 CrossRef CAS PubMed.
- J. Zhou, Y. Wang, J. Wang, W. Qiao, D. Long and L. Ling, J. Colloid Interface Sci., 2016, 462, 200–207 CrossRef CAS PubMed.
- N. Kongsricharoern and C. Polprasert, Water Sci. Technol., 1996, 34, 109–116 CrossRef CAS.
- Z. Modrzejewska and W. Kaminski, Ind. Eng. Chem. Res., 1999, 38, 4946–4950 CrossRef CAS.
- S. Rengaraj, C. K. Joo, Y. Kim and J. Yi, J. Hazard. Mater., 2003, 102, 257–275 CrossRef CAS PubMed.
- W. Liu, J. Ni and X. Yin, Water Res., 2014, 53, 12–25 CrossRef CAS PubMed.
- S. T. Farrell and C. B. Breslin, Environ. Sci. Technol., 2004, 38, 4671–4676 CrossRef CAS PubMed.
- J. Gu, C. Liang, J. Dang, W. Dong and Q. Zhang, RSC Adv., 2016, 6, 35809–35814 RSC.
- J. Gu, X. Yang, Z. Lv, N. Li, C. Liang and Q. Zhang, Int. J. Heat Mass Transfer, 2016, 92, 15–22 CrossRef CAS.
- H. Gu, S. B. Rapole, Y. Huang, D. Cao, Z. Luo, S. Wei and Z. Guo, J. Mater. Chem. A, 2013, 1, 2011–2021 CAS.
- L. Alidokht, A. Khataee, A. Reyhanitabar and S. Oustan, Desalination, 2011, 270, 105–110 CrossRef CAS.
- B. Qiu, J. Guo, X. Zhang, D. Sun, H. Gu, Q. Wang, H. Wang, X. Wang, X. Zhang and B. L. Weeks, ACS Appl. Mater. Interfaces, 2014, 6, 19816–19824 CAS.
- G. Wang, Z. Xu, Y. Yu and J. Ji, Chem. Eng. Process., 2008, 47, 2131–2139 CrossRef CAS.
- Y. Wu, J. Zhang, Y. Tong and X. Xu, J. Hazard. Mater., 2009, 172, 1640–1645 CrossRef CAS PubMed.
- N. Melitas, O. Chuffe-Moscoso and J. Farrell, Environ. Sci. Technol., 2001, 35, 3948–3953 CrossRef CAS PubMed.
- H. Gu, S. B. Rapole, J. Sharma, Y. Huang, D. Cao, H. A. Colorado, Z. Luo, N. Haldolaarachchige, D. P. Young and B. Walters, RSC Adv., 2012, 2, 11007–11018 RSC.
- T. Liu, Z.-L. Wang, X. Yan and B. Zhang, Chem. Eng. J., 2014, 245, 34–40 CrossRef CAS.
- T. Scott, I. Popescu, R. Crane and C. Noubactep, J. Hazard. Mater., 2011, 186, 280–287 CrossRef CAS PubMed.
- R. Crane and T. Scott, J. Hazard. Mater., 2012, 211, 112–125 CrossRef PubMed.
- Z. Ai, Y. Cheng, L. Zhang and J. Qiu, Environ. Sci. Technol., 2008, 42, 6955–6960 CrossRef CAS PubMed.
- Ç. Üzüm, T. Shahwan, A. E. Eroğlu, K. R. Hallam, T. B. Scott and I. Lieberwirth, Appl. Clay Sci., 2009, 43, 172–181 CrossRef.
- T. Liu, L. Zhao, D. Sun and X. Tan, J. Hazard. Mater., 2010, 184, 724–730 CrossRef CAS PubMed.
- Y. Zhang, Y. Li, J. Li, L. Hu and X. Zheng, Chem. Eng. J., 2011, 171, 526–531 CrossRef CAS.
- Y. J. Oh, H. Song, W. S. Shin, S. J. Choi and Y.-H. Kim, Chemosphere, 2007, 66, 858–865 CrossRef CAS PubMed.
- H. Gu, H. Lou, J. Tian, S. Liu and Y. Tang, J. Mater. Chem. A, 2016, 4, 10174–10185 CAS.
- H. Gu, D. Ding, P. Sameer, J. Guo, N. Yerra, Y. Huang, Z. Luo, T. C. Ho, N. Haldolaarachchige, D. P. Young, A. Khasanov, Z. Guo and S. Wei, ECS Solid State Lett., 2013, 2, M65–M68 CrossRef CAS.
- I.-H. Yoon, K.-W. Kim, S. Bang and M. G. Kim, Appl. Catal., B, 2011, 104, 185–192 CrossRef CAS.
- S. Santra, R. Tapec, N. Theodoropoulou, J. Dobson, A. Hebard and W. Tan, Langmuir, 2001, 17, 2900–2906 CrossRef CAS.
- H. Gu, Y. Huang, X. Zhang, Q. Wang, J. Zhu, L. Shao, N. Haldolaarachchige, D. P. Young, S. Wei and Z. Guo, Polymer, 2012, 53, 801–809 CrossRef CAS.
- H. Wang, H. Yi, C. Zhu, X. Wang and H. J. Fan, Nano Energy, 2015, 13, 658–669 CrossRef CAS.
- M. C. D'Antonio, A. Wladimirsky, D. Palacios, L. Coggiolaa, A. C. González-Baró, E. J. Baran and R. C. Mercader, J. Braz. Chem. Soc., 2009, 20, 445–450 CrossRef.
- H. Yi, H. Wang, Y. Jing, T. Peng and X. Wang, J. Power Sources, 2015, 285, 281–290 CrossRef CAS.
- H. Gu, C. Ma, J. Gu, J. Guo, X. Yan, J. Huang, Q. Zhang and Z. Guo, J. Mater. Chem. C, 2016, 4, 5890–5906 RSC.
- P. C. Graat and M. A. Somers, Appl. Surf. Sci., 1996, 100, 36–40 CrossRef.
- S. Baek, J. Song and S. Lim, Phys. B, 2007, 399, 101–104 CrossRef CAS.
- X. Li, H. Gu, J. Liu, H. Wei, S. Qiu, Y. Fu, H. Lv, G. Lu, Y. Wang and Z. Guo, RSC Adv., 2015, 5, 7237–7244 RSC.
- J. Gu, N. Li, L. Tian, Z. Lv and Q. Zhang, RSC Adv., 2015, 5, 36334–36339 RSC.
- L. C. Lopez and D. W. Dwight, J. Appl. Polym. Sci., 1988, 36, 1401–1415 CrossRef CAS.
- S. Li, Y. Gong, Y. Yang, C. He, L. Hu, L. Zhu, L. Sun and D. Shu, Chem. Eng. J., 2015, 260, 231–239 CrossRef CAS.
- Y. Li, H. Zhu, H. Gu, H. Dai, Z. Fang, N. J. Weadock, Z. Guo and L. Hu, J. Mater. Chem. A, 2013, 1, 15278–15283 CAS.
- S. Mor, K. Ravindra and N. Bishnoi, Bioresour. Technol., 2007, 98, 954–957 CrossRef CAS PubMed.
- F. Gao, H. Gu, H. Wang, X. Wang, B. Xiang and Z. Guo, RSC Adv., 2015, 5, 60208–60219 RSC.
- B. Qiu, H. Gu, X. Yan, J. Guo, Y. Wang, D. Sun, Q. Wang, M. Khan, X. Zhang, B. L. Weeks, D. P. Young, Z. Guo and S. Wei, J. Mater. Chem. A, 2014, 2, 17454–17462 CAS.
- D. Park, Y.-S. Yun and J. M. Park, J. Colloid Interface Sci., 2008, 317, 54–61 CrossRef CAS PubMed.
- B. A. Manning, J. R. Kiser, H. Kwon and S. R. Kanel, Environ. Sci. Technol., 2007, 41, 586–592 CrossRef CAS PubMed.
- T.-C. Lin, G. Seshadri and J. A. Kelber, Appl. Surf. Sci., 1997, 119, 83–92 CrossRef CAS.
- J. Zhu, H. Gu, J. Guo, M. Chen, H. Wei, Z. Luo, H. A. Colorado, N. Yerra, D. Ding, T. C. Ho, N. Haldolaarachchige, J. Hopper, D. P. Young, Z. Guo and S. Wei, J. Mater. Chem. A, 2014, 2, 2256–2265 CAS.
- X. Sun, L. Yang, H. Xing, J. Zhao, X. Li, Y. Huang and H. Liu, Chem. Eng. J., 2013, 234, 338–345 CrossRef CAS.
- N. Lazaridis, D. Bakoyannakis and E. Deliyanni, Chemosphere, 2005, 58, 65–73 CrossRef CAS PubMed.
- S. Babel and T. A. Kurniawan, Chemosphere, 2004, 54, 951–967 CrossRef CAS PubMed.
- J. Hu, C. Chen, X. Zhu and X. Wang, J. Hazard. Mater., 2009, 162, 1542–1550 CrossRef CAS PubMed.
- R. M. Powell, R. W. Puls, S. K. Hightower and D. A. Sabatini, Environ. Sci. Technol., 1995, 29, 1913–1922 CrossRef CAS PubMed.
- R. Senthurchelvan, Y. Wang, S. Basak and K. Rajeshwar, J. Electrochem. Soc., 1996, 143, 44–51 CrossRef CAS.
- F. J. Rodríguez, S. Gutiérrez, J. G. Ibanez, J. L. Bravo and N. Batina, Environ. Sci. Technol., 2000, 34, 2018–2023 CrossRef.
- H. Gu, S. B. Rapole, J. Sharma, Y. Huang, D. Cao, H. A. Colorado, Z. Luo, N. Haldolaarachchige, D. P. Young, B. Walters, S. Wei and Z. Guo, RSC Adv., 2012, 2, 11007–11018 RSC.
- O. Duman and E. Ayranci, J. Hazard. Mater., 2005, 120, 173–181 CrossRef CAS PubMed.
- O. Duman and E. Ayranci, Sep. Sci. Technol., 2006, 41, 3673–3692 CrossRef CAS.
- C. Almeida, N. Debacher, A. Downs, L. Cottet and C. Mello, J. Colloid Interface Sci., 2009, 332, 46–53 CrossRef CAS PubMed.
- Y. Wu, H. Luo, H. Wang, C. Wang, J. Zhang and Z. Zhang, J. Colloid Interface Sci., 2013, 394, 183–191 CrossRef CAS PubMed.
- M. Asgher and H. N. Bhatti, Ecol. Eng., 2012, 38, 79–85 CrossRef.
- M. González, I. Pavlovic and C. Barriga, Chem. Eng. J., 2015, 269, 221–228 CrossRef.
- A. Gundogdu, C. Duran, H. B. Senturk, M. Soylak, D. Ozdes, H. Serencam and M. Imamoglu, J. Chem. Eng. Data, 2012, 57, 2733–2743 CrossRef CAS.
- E. Igberase, P. Osifo and A. Ofomaja, J. Environ. Chem. Eng., 2014, 2, 362–369 CrossRef CAS.
Footnote |
| † Electronic supplementary information (ESI) available. See DOI: 10.1039/c6ra22709k |
| This journal is © The Royal Society of Chemistry 2016 |