Thermolysis of 1,3-dioxin-4-ones: fast generation of kinetic data using in-line analysis under flow†
Thomas
Durand
a,
Cyril
Henry
a,
David
Bolien
a,
David C.
Harrowven
a,
Sally
Bloodworth
a,
Xavier
Franck
b and
Richard J.
Whitby
*a
aChemistry, Faculty of Natural and Environmental Sciences, University of Southampton, Southampton, SO17 1BJ, UK. E-mail: rjw1@soton.ac.uk
bNormandie Université, COBRA, UMR 6014 & FR 3038, Université de Rouen, INSA Rouen, CNRS, 1 rue Tesnière, 76821 Mont-Saint-Aignan Cedex, France
First published on 4th November 2015
Abstract
Rapid acquisition of kinetic data is demonstrated with a commercial meso-scale flow reactor, using a step-change in flow rate or ‘push-out’ from the flow line. For thermolysis of 1,3-dioxin-4-ones (1), we obtain excellent reproducibility in the activation energies measured from spectroscopic data collected by in-line UV or transmission FT-IR monitoring of the output during the transitional period between two flow rates (±3 kJ mol−1, 0.7 kcal mol−1). Analysis of multi-component UV and IR data is conducted using an orthogonal projection approach (multivariate curve resolution by alternating least squares) for complex spectra, or by calibration-less integration of non-overlapping peak absorbance. All analysis methods were validated using off-line 1H NMR analysis, and kinetic parameters obtained using the method of a flow rate step-change were validated against conventional steady-state measurements in which time-series data were acquired across multiple experiments. Thermal transfer and dispersion effects are addressed. The experimental methods described herein are valuable for accelerated reaction study and in process development.
Introduction
Kinetic studies of reactions conducted under continuous-flow conditions present several key advantages over classical ‘batch’ experiments, including low consumption of reagents, low production of waste,1 and convenient replication of experiments. In addition, rapid collection of data may be facilitated under flow conditions by in-line analysis, and examples employing UV,2 IR,3 Raman,4 fluorescence5 and NMR spectroscopy,6 as well as mass spectrometry7 and HPLC,8 have been reported for kinetic study of reactions conducted under steady-state continuous flow conditions. A drawback of using steady-state flow conditions for kinetic studies is that, except where it is feasible to vary the position of an analytical probe along the reactor pathway,9 a separate experiment is needed for each time point. An elegant method to overcome this drawback was introduced by Mozharov et al.,10 whereby collection of time-series data using in-line (Raman spectroscopic) monitoring of the output from a single flow experiment is enabled by introducing a step-change in flow rate. A variant upon this method was recently reported,11 in which a flow rate ramp was used to access multiple residence times within a single microreactor flow experiment (with in-line ATR-FTIR monitoring), rather than a step-change in flow rate between two steady states. A purpose-built system for uninterrupted flow-rate adjustment is required however, and the ramped method is therefore not possible with most current commercial flow platforms.The aim of our work was to demonstrate that widely available commercial flow reactors could be used for the rapid acquisition of kinetic data for reaction study and process development, enabling wider adoption of the stepped-rate method of ‘push-out’ from the flow line. The thermolysis of 1,3-dioxin-4-ones (1) was used to develop and illustrate the methods developed. We report the use of low-cost UV and transmission FTIR for in-line analysis, address the impact of dispersion (which could be reasonably neglected in the microflow reactor channels used in previous studies), and show that calibration-less multi-component analysis of the resulting spectra provides kinetic data with minimal operator intervention. The results are validated using both off-line 1H NMR analysis and against known kinetic parameters.
Results and discussion
Thermal decomposition of 1,3-dioxin-4-ones 1via [4 + 2] retro-cycloaddition,12 has been well-studied since trapping of intermediate acylketenes 3 with nucleophiles13 constitutes a synthetically useful acetoacetylation (R1 = Me), for example in the preparation of β-ketoesters 4 when the trapping nucleophile is an alcohol (Scheme 1).In particular, thermolysis of 2,2,6-trimethyl-4H-1,3-dioxin-4-one (1a, R1 = R2 = Me) in the presence of excess alcohol has been shown to be a first-order process14 in which the rate-determining pre-equilibrium of 1a and the acylketene (3a, R1 = Me) is followed by rapid trapping of 3a by an alcohol (k2[ROH] ≫ k−1[acetone])13a,15 such that the kinetic expression reduces as shown in eqn (1). Given the integrated rate law (eqn (2)), we first verified that the rate of reverse trapping of 3 with acetone (k−1) is not significant under flow conditions, by showing that the measured rate constant k does not vary with alcohol stoichiometry. Classical steady-state measurement (using off-line 1H NMR analysis) gave a consistent first-order rate constant of k = 1.85 × 10⁻³ s−1 ± 1% for thermolysis of 1a in acetonitrile at 120 °C in the presence of 1, 2 or 4 equiv. EtOH.†
 | (1) |
| ln[1a]t = − k1tr + ln[1a]0 | (2) |
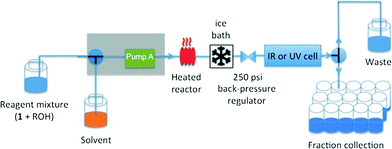
Our experiments under flow conditions were conducted using a Vapourtec R series (R2+/R4) system with 10 mL capacity stainless steel reactor of 1 mm internal diameter heated by an external oil bath (see below), flow-rate switching within a range of 0.02–10 mL min−1, and in-line IR or UV spectroscopic data collection. An alpha transmission FT-IR from Bruker was integrated into the flow system using a Harrick DLC2™ demountable liquid flow cell with sodium chloride windows and IR spectra were recorded with a 3.75 second interval. In-line UV measurements were recorded on an Ocean Optics DH-2000-BAL spectrometer integrated into the flow with a type 583-F Starna® fluorimeter flow cell (1 mm path length, 0.011 mL volume), enabling collection of UV spectra with a 1.2 second interval. The ability to switch either the described in-line UV or IR analysis into the reactor output flow line means that spectroscopic analysis across a reagent concentration range of 0.001–0.3 M is readily achieved. The system was further equipped with an automated sample collector for off-line product analysis (Fig. 1).
The method of kinetic data acquisition is described in Fig. 2; a typical concentration profile for [1a] obtained, in this example, through UV monitoring of the flow output is depicted in Fig. 2(a). At each given temperature, once the system has reached steady-state at low flow-rate (F1 = typically 1 mL min−1) a step-change to high flow-rate (F2 = typically 10 mL min−1) is applied, resulting in a second steady-state of correspondingly lower 1,3-dioxin-4-one reaction. The transitional period between steady-states gives spectroscopic information across a gradient of residence times within the reactor. The reaction time (tr) of individual data points is determined from the experimental time (τ) and inflection points τ1 and τ0 (eqn 3)10 with further correction for thermal expansion of solvent.17
 | (3) |
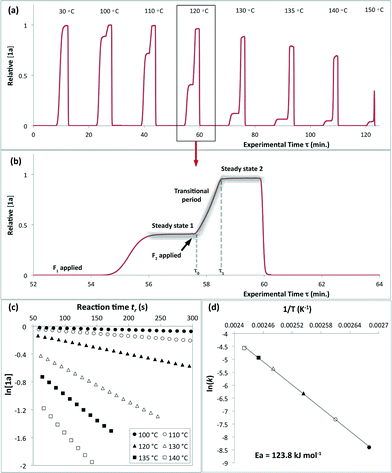 | ||
| Fig. 2 Representative data derived from a push-out experiment (this example is entry 1 of Table 1, vide infra). (a) Concentration profile of 2,2,6-trimethyl-4H-1,3-dioxin-4-one (1a) derived from OPA resolution of UV spectra obtained in situ from flow thermolysis in the presence of EtOH (4 equiv.) under stepped flow-rate (push-out) conditions at each of the temperatures indicated. (b) Detailed push-out profile for flow thermolysis of 1a at 120 °C. (c) First-order kinetics and (d) Arrhenius plots derived from relative [1a] data. | ||
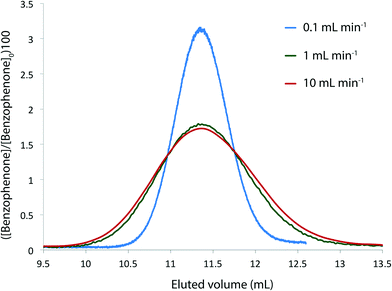
We needed to determine the likely maximum error which dispersion might cause in kinetic studies under push-out conditions. The situation is complicated since the RTD of the material leaving the reactor column at the moment when the step-change in flow rate is applied, is different to the RTD of material which leaves the reactor at the end of the push-out period (because the flow rates while passing through the column are different). Fig. 3 shows the observed dispersion of a 10 μL sample of a solution of benzophenone in MeCN, passed through a coiled tubular column of 10 mL capacity and 1 mm internal diameter at flow rates of 10, 1 and 0.1 mL min−1 at 30 °C. The dispersion is shown with respect to volume passing the observation point, rather than time. Dispersion is considerably reduced at higher temperatures and slower flow rates (see ESI†) such that the 10 mL min−1 case in Fig. 3 represents a worst case for our studies. It can be seen that the dispersion is significant with respect to the total passage of volume/time, for example the 90% peak width at 10 mL min−1 is around 0.2 min cf. a total spectroscopic sampling time of 1 min. Fortunately the dispersion at higher flow rates is much less than would be predicted from simple Taylor dispersion in a linear capillary due to transverse mixing induced by Dean circulation22,23 as a result of the curved nature of the reactor coil. For the two flow rates used in most of the push-out experiments described below (10 and 1 mL min−1) dispersion is very similar.
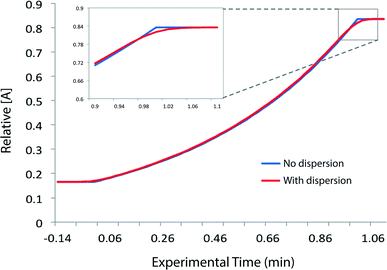
Provided that the RTD is symmetric, the average reaction time will be the same as the observed reaction time (i.e. that calculated from the residence time according to Mozharov et al.10). For dispersion profiles obtained at flow rates between 0.1 and 10 mL min−1, at both 30 °C and 120 °C, the difference between the weighted average retention time, and the retention time of the peak top was insignificant. The average conversion will thus be very close to that expected at this time point unless the conversion vs. time is highly non linear. Using the dispersion profile from the ‘worst case’ scenario (10 mL min−1, 30 °C) we simulated the effect of dispersion upon calculated kinetic parameters of 1st and 2nd order reactions under push-out conditions, choosing theoretical rate constants corresponding to 80% conversion at the longest reaction time. The effect of dispersion was found to be negligible in each case.† An effect is only seen at either end of the push-out period where spectroscopic data under each of the two steady-state flow rate conditions (e.g. 1 mL min−1 and 10 mL min−1) is averaged-in; apparent as a slight deviation at each end of a plot of [reagent] vs. experimental time (Fig. 4) and also by the very slight curvature at each end of the corresponding kinetic plots.† Discarding the first and last 10% of the data removes this dispersion effect, although in practice the effect of inclusion on the measured rate constants was negligible.
Thermal transfer was found to be inefficient using the air-heated flow reactor with which the Vapourtec platform is equipped. There was a discrepancy between the steady-state and push-out rate constants at high flow rates which we ascribe to slight cooling of the reactor caused by heat transfer from the air not being sufficient to warm the cold introduced solvent quickly enough in the former experiments. In addition, uneven heating across the double-coil reactor (under control of a single thermocouple) was evident from a kinetic plot of ln[1a] vs. reaction time, measured for thermolysis of 1a in acetonitrile at 130 °C under push-out conditions, in which two distinct slopes were apparent, corresponding to different measured rate constants in the outer and inner coil. Upon switching to oil-bath immersion of the reactor coil, thermal homogeneity was achieved for kinetic studies. Rate constants of consistent value within standard deviation were measured from linear first-order plots under both steady-state conditions (multiple experiments, each of fixed flow rate between 2 and 10 mL min−1, were used to access multiple residence times in the reactor) and using the push-out method. Data from these heat transfer experiments are given in ESI.†
The results of kinetic studies upon thermolysis of 2,2,6-trimethyl-4H-1,3-dioxin-4-one (1a) in the presence of 4 equiv. of trapping alcohol in acetonitrile are given in Table 1. Good consistency was obtained between the push-out method and conventional steady-state measurement of kinetic parameters in which time-series data was acquired across multiple experiments (entry 1 vs. 3 and 4 vs. 6). In addition, corroboration of results obtained through calibration-less processing using OPA (MCR-ALS) and using peak absorbance was good (entries 1 vs. 2 and 4 vs. 5). Relative integration of both IR and UV peaks with respect to a [1a]0 value determined by conducting flow throughput at 25 °C was possible since non-overlapping spectroscopic data were obtained in each case. There was good consistency between the results obtained using UV and IR monitoring (entries 1–3 vs. 4–6), and both were in agreement with the results obtained from manual calculation of [1a]/[1a]0 using off-line 1H NMR analysis (entry 10). The latter was repeated using BnOH (entry 11) instead of EtOH as the trap due to concerns about the volatility of the products, with similar results. Detailed data characterisation is given in ESI† although it is interesting to specifically note that, in accord with the clean resolution of mixed component UV spectra mentioned above, no evidence of competing condensation of acylketene intermediate 3a with acetone (2a), or of [4 + 2] self-cycloaddition of 3a, was apparent in the NMR spectra.
| Entrya | Kinetic methodb | Analysis method | Process methodc | F 1 | F 2 | ROH | k × 10−3 (s−1) | E a kJ mol−1 | |||||||
|---|---|---|---|---|---|---|---|---|---|---|---|---|---|---|---|
| mL min−1 | 100 | 110 | 115 | 120 | 125 | 130 | 135 | 140 | |||||||
| °C | |||||||||||||||
| a For entries 3, 6, 7, 10 and 11 rate constants were determined from an individual flow experiment; for ‘paired’ entries 1 + 2, 4 + 5 and 8 + 9 IR and UV data were collected from the same flow output. b ‘Push-out’ refers to the method of stepped flow-rate from F1 to F2 with time-series data acquisition across the transitional period within a single experiment, ‘steady-state’ refers to acquisition of time-series data across multiple experiments (typically five) in which a range of flow rates (each being constant within a given experiment) corresponds to a range of reaction times calculated from the reactor residence time upon correction for thermal expansion of solvent. c ‘OPA’ refers to orthogonal projection approach MCR-ALS analysis, ‘peak abs.’ refers to calibration-less calculation of [1a] by integration of non-overlapping peaks in the UV or IR spectrum with respect to 0% conversion. Off-line analysis of 1H NMR spectra was conducted manually (see ESI). | |||||||||||||||
| 1 | Push-out | In-line UV | OPA | 1 | 10 | EtOH | 0.23 | 0.66 | — | 1.81 | — | 4.70 | 7.17 | 10.44 | 123.8 |
| 2 | Push-out | In-line UV | Peak abs. | 1 | 10 | EtOH | 0.23 | 0.65 | — | 1.82 | — | 4.74 | 7.07 | 10.81 | 123.8 |
| 3 | Steady-state | In-line UV | OPA | — | — | EtOH | 0.24 | 0.68 | — | 1.89 | — | 4.92 | — | — | 126.7 |
| 4 | Push-out | In-line IR | OPA | 1 | 10 | EtOH | 0.27 | 0.71 | 1.17 | 1.92 | 3.16 | 5.06 | 7.97 | 11.58 | 123.5 |
| 5 | Push-out | In-line IR | Peak abs. | 1 | 10 | EtOH | 0.25 | 0.66 | 1.09 | 1.80 | 3.04 | 4.78 | 7.56 | 11.36 | 125.0 |
| 6 | Steady-state | In-line IR | OPA | — | — | EtOH | — | 0.72 | — | 1.83 | 3.15 | 5.11 | — | 11.96 | 124.4 |
| 7 | Reverse push-out | In-line UV | OPA | 10 | 1 | EtOH | — | 0.62 | 0.96 | 1.66 | 2.80 | 4.47 | — | — | 128.7 |
| 8 | Push-out | In-line IR | OPA | 1 | 2 | EtOH | — | 0.66 | 1.26 | 1.96 | 2.93 | 4.80 | — | — | 123.9 |
| 9 | Push-out | In-line UV | OPA | 1 | 2 | EtOH | — | — | 1.03 | 1.74 | 2.89 | 4.82 | — | 11.30 | 128.2 |
| 10 | Steady-state | Off-line NMR | — | — | — | EtOH | — | 0.65 | — | 1.89 | 2.97 | 5.13 | — | 12.52 | 129.9 |
| 11 | Steady-state | Off-line NMR | — | — | — | BnOH | — | 0.67 | — | 1.79 | 2.85 | 4.88 | 7.74 | — | 127.9 |
Excellent reproducibility in the calculated activation energy of cycloreversion of 1a was achieved overall, Ea = 126.7 ± 3.2 kJ mol−1 (cf. Ea = 130.1 ± 4.6 kJ mol−1 reported by Witzeman and Clemens14 for thermolysis of 1a in xylene), independent of the trapping nucleophile (compare entries 10 and 11) as expected. Consistent rate constants were determined regardless of the analysis or process method used and no loss of reproducibility in the push-out experiments was observed across the temperature range studied, suggesting that heat transfer from the heated oil bath to the reactor coil is efficient across this range, such that there is not significant cooling of the initial section of the reactor by entering solvent, even at the high flow rate F2.
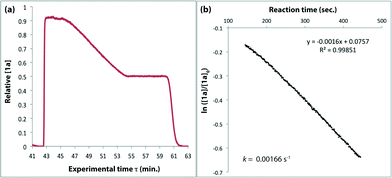
The short data acquisition time associated with the method of a step-change in flow rate has attracted the criticism that non-instantaneous flow rate adjustment limits the number of data points which can be acquired.11 The use of a ramped change in flow rate to address this issue is not available using most commercial flow systems. Fortunately a simple solution is to be found in a ‘reverse push-out’ method where a step-change from high to low flow rate effects access to time-series data within an (extended) transitional period of increasing reaction conversion (Fig. 5). Mozharov et al.10 have shown that the error associated with non-instantaneous flow-rate adjustment, can be minimised by reducing Δτ(F2/F1), where Δτ is the interval between consecutive spectroscopic measurements taken at the reactor output. Under our reverse push-out conditions of flow rate switching from 10 mL min−1 → 1 mL min−1, Δτ(F2/F1) = 0.12 (UV) or 0.375 (IR). In comparison, ‘standard’ push-out (i.e. flow rate switching of 1 ml min−1 → 10 mL min−1) involves a transitional period of ca. 50 s and correspondingly Δτ(F2/F1) = 12 (UV) or 37.5 (IR). Table 1 entry 7 demonstrates that the reverse push-out method gives the same result as the normal push-out method. Whilst greater consumption of reagent is required for equilibration of the flow platform to steady state at a high flow rate, the technique is useful when sampling rate is a limitation. An alternative approach is to use a smaller stepped rate-change of 1 mL min−1 → 2 mL min−1 equating to Δτ(F2/F1) = 2.4 (UV) or 7.5 (IR). Remarkably good kinetic results are obtained (Table 1, entries 8 and 9), but following a reaction through such a small conversion range is inadvisable since, for example, the linearity of the kinetic plots can no longer be taken to confirm 1st order behaviour.
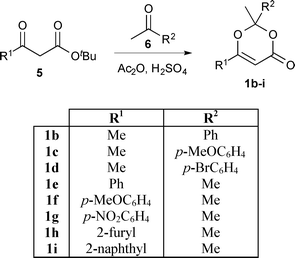
In order to exploit the fast generation of kinetic data for reaction study, we next sought to conduct a short exploration of substituent effects upon 1,3-dioxin-4-one thermolysis. A series of 1,3-dioxin-4-ones 1b–i, variably substituted (R1 ≠ R2 = Me, aryl) at the 2- and 6-positions, were prepared from condensation between a β-substituted-β-keto tert-butyl ester245 and ketone 6 under acidic conditions (Scheme 2).25 Activation energies for thermal cycloreversion of 1b–i were then determined, in the presence of 4 equiv. EtOH in acetonitrile, according to the methods already described (Table 2).
| Entrya | 1,3-Dioxin-4-one | Kinetic methodb | Analysis method | k × 10−3 (s−1) | E a kJ mol−1 | |||||||||
|---|---|---|---|---|---|---|---|---|---|---|---|---|---|---|
| 85 | 90 | 95 | 100 | 105 | 110 | 115 | 120 | 125 | 130 | |||||
| °C | ||||||||||||||
| a Each entry quotes rate constants determined from an individual flow experiment. b ‘Push-out’ refers to the method of stepped flow-rate from F1 = 1 mL min−1 to F2 = 10 mL min−1 with time-series data acquisition across the transitional period within a single experiment. ‘Steady-state’ refers to acquisition of time-series data across multiple experiments (typically five) in which a range of flow rates (each being constant within a given experiment) corresponds to a range of reaction times calculated from the reactor residence time upon correction for thermal expansion of solvent. All data was processed using orthogonal projection approach MCR-ALS analysis with the exception of analysis of 1H NMR spectra (entries 4 and 9) which was conducted manually (see ESI). c BnOH (4 equiv.) was used as the alcohol trap. | ||||||||||||||
| 1 | 1b | Push-out | In-line UV | — | 0.24 | 0.45 | 0.76 | 1.32 | 2.19 | 3.54 | 5.75 | — | — | 125.2 |
| 2 | 1b | Push-out | In-line IR | — | — | 0.48 | 0.74 | 1.27 | 2.08 | 3.55 | 5.84 | — | — | 121.4 |
| 3 | 1b | Steady-state | In-line UV | — | — | — | 0.80 | 1.31 | 2.30 | 3.70 | 6.16 | — | — | 124.9 |
| 4c | 1b | Steady-state | Off-line NMR | — | — | — | 0.79 | 1.24 | 2.33 | 3.29 | 6.26 | — | — | 124.6 |
| 5 | 1c | Push-out | In-line UV | 1.66 | 2.78 | 4.71 | 7.55 | 11.49 | 17.18 | — | — | — | — | 107.2 |
| 6 | 1c | Push-out | In-line IR | — | 2.65 | 4.52 | 7.15 | 11.11 | — | — | — | — | — | 108.6 |
| 7 | 1d | Push-out | In-line UV | — | — | — | 0.59 | 0.94 | 1.59 | 2.68 | 4.54 | 7.80 | — | 128.3 |
| 8 | 1d | Push-out | In-line IR | — | — | — | 0.56 | 1.06 | 1.82 | 2.91 | — | 7.47 | — | 126.6 |
| 9 | 1d | Push-out | Off-line NMR | — | — | — | 0.55 | 0.95 | 1.62 | 2.60 | — | 7.42 | — | 128.0 |
| 10 | 1e | Push-out | In-line UV | — | — | — | — | 0.32 | 0.55 | 0.93 | 1.56 | 2.58 | 4.04 | 128.6 |
| 11 | 1f | Push-out | In-line UV | — | — | — | — | — | 0.44 | 0.76 | 1.30 | — | 3.62 | 136.0 |
| 12 | 1g | Push-out | In-line UV | — | — | — | 0.57 | 0.91 | 1.53 | 2.47 | 4.15 | — | — | 120.9 |
| 13 | 1h | Push-out | In-line UV | — | 0.37 | 0.61 | 1.05 | 1.72 | 2.99 | 4.95 | — | — | — | 122.3 |
| 14 | 1i | Push-out | In-line UV | — | — | — | 0.21 | 0.34 | 0.59 | 0.96 | 1.60 | — | 3.98 | 124.0 |
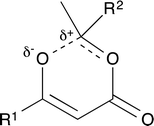
For thermal cycloreversion of 1b, kinetic parameters obtained using the push-out method were again substantiated by close correlation with those obtained from steady-state experiments (compare entries 1 and 3). For both 1b (entries 1–4) and 1c (entries 5–6), different methods of spectroscopic analysis and/or data processing were also found to give consistent values of activation energy. Retro-cycloaddition of 1d–i was therefore conducted solely using the push-out method with in-line UV analysis and OPA processing (entries 7 and 10–14; further scrutiny of the thermolysis of 1d reported in entries 8–9 was conducted subsequently vide infra). First-order rate constants for decomposition of 1a–i gave excellent linear Arrhenius plots (Fig. 6) allowing activation energies to be estimated. In general, the differences between activation energies obtained for 1a–i are too small for detailed interpretation. Nonetheless, the substantial decrease in activation energy observed when R2 = p-MeOC6H4, together with a significant increase when R1 = p-MeOC6H4, suggests a transition state in which the C2–O1 bond is substantially broken (Fig. 7). Moreover, the observation that, in several cases, similar rates are associated with different activation energies and vice versa, indicates that entropic effects are important. These are likely to be due to the reorganisation of solvent molecules around the sites of developing charge.
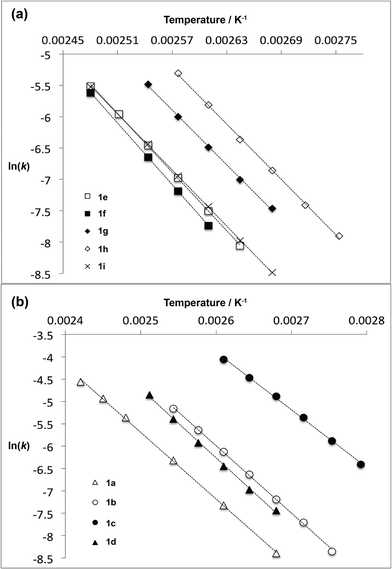 | ||
| Fig. 6 Arrhenius plots for thermal decomposition of (a) 1,3-dioxin-4-ones 1e–i with different 6-position substituent R1 and (b) 1,3-dioxin-4-ones 1a–d with different 2-position substituent R2. | ||
The use of OPA or related curve analysis methods is a substantial advance over following the intensity of single peaks in spectroscopic data, particularly in the case of UV monitoring where compounds are characterised by a few very broad, featureless peaks. In the case of 1b, c and d we were concerned that the strength of the UV absorptions of the aryl ketone 2 (Scheme 1) eliminated in the reaction, and their very substantial overlap with the absorption of the reagent 1,3-dioxin-4-ones, may cause difficulty. For these examples we also acquired the kinetic information using IR monitoring, with close results confirming the ability of the OPA method to distinguish between similar chromophores. For 1b we also confirmed the results using steady-state experiments with both UV and off-line NMR monitoring.
For compound 1d we also introduced the use of NMR to monitor a push-out experiment by using a fraction collector to split the output into 20 samples which were then analysed by off-line 1H NMR. The resulting Ea (Table 2 entry 9) was in excellent agreement with that obtained using in-line UV and IR analysis (cf. entries 7 and 8).
Conclusions
The ‘push-out’ technique using a stepped flow rate in a continuous flow reactor has been developed using a widely available commercial flow reactor, to rapidly obtain kinetic data of suitable quality for application in process development chemistry.Integration of in-line UV and transmission FT-IR provides a versatile breadth of spectroscopic methods for data collection, suitable for multiple reaction types. We have also demonstrated the use of orthogonal projection approach MCR-ALS for deconstruction of multi-component spectroscopic data collected in-line under push-out conditions, and validated these methods against off-line 1H NMR data collection with traditional manual analysis. We have shown that an extended period of data collection is readily accessible using a ‘reverse’ push-out of the flow line upon switching from high to low flow rate.
Overall, the methods presented offer great potential for wider adoption of the push-out method to obtain kinetic data, providing opportunities for accelerated reaction study and process development.
Acknowledgements
The authors thank the Engineering and Physical Sciences Research Council (EPSRC) (EP/G027986/1), GlaxoSmithKline (GSK), and European Regional Development Fund (ERDF) (AI-Chem Channel and IS:CE-Chem within the InterReg programme) for funding this work. We thank Andy Craven and Helen F. Sneddon from GSK for their interest and gratefully acknowledge use of the BORIS (Bristol Online Reaction Investigation Software) software, a result of collaboration between Bristol Chemometrics Group and the PAT&C, Strategic Technologies and Chemical Development group at GSK.Notes and references
- B. P. Mason, K. E. Price, J. L. Steinbacher, A. R. Bogdan and D. T. McQuade, Chem. Rev., 2007, 107, 2300–2318 CrossRef CAS PubMed.
- F. Benito-Lopez, W. Verboom, M. Kakuta, J. G. E. Gardeniers, R. J. M. Egberink, E. R. Oosterbroek, A. van den Berg and D. N. Reinhoudt, Chem. Commun., 2005, 2857–2859 RSC.
- (a) T. M. Floyd, M. A. Schmidt and K. F. Jensen, Ind. Eng. Chem. Res., 2005, 44, 2351–2358 CrossRef CAS; (b) R. Herzig-Marx, K. T. Queeney, R. J. Jackman, M. A. Schmidt and K. F. Jensen, Anal. Chem., 2004, 76, 6476–6483 CrossRef CAS PubMed; (c) C. B. Leng, J. Hiltner, H. Pham, J. Kelley, M. Mach, Y. H. Zhang and Y. Liu, Phys. Chem. Chem. Phys., 2014, 16, 4350–4360 RSC; (d) C. Henry, D. Bolien, B. Ibanescu, S. Bloodworth, D. C. Harrowven, X. L. Zhang, A. Craven, H. F. Sneddon and R. J. Whitby, Eur. J. Org. Chem., 2015, 1491–1499 CrossRef CAS PubMed.
- (a) G. Chaplain, S. J. Haswell, P. D. I. Fletcher, S. M. Kelly and A. Mansfield, Aust. J. Chem., 2013, 66, 208–212 CrossRef CAS; (b) In-line Raman spectroscopic analysis of reactor output under meso-scale continuous flow conditions has also been reported, see: T. A. Hamlin and N. E. Leadbeater, Beilstein J. Org. Chem., 2013, 9, 1843–1852 CrossRef PubMed, although kinetic studies were not conducted in this example.
- H. Song and R. F. Ismagilov, J. Am. Chem. Soc., 2003, 125, 14613–14619 CrossRef CAS PubMed.
- (a) M. D. Christianson, E. H. P. Tan and C. R. Landis, J. Am. Chem. Soc., 2010, 132, 11461–11463 CrossRef CAS PubMed; (b) H. Wensink, F. Benito-Lopez, D. C. Hermes, W. Verboom, H. J. G. E. Gardeniers, D. N. Reinhoudt and A. van den Berg, Lab Chip, 2005, 5, 280–284 RSC; (c) S. T. Xu, W. P. Zhang, X. C. Liu, X. W. Han and X. H. Bao, J. Am. Chem. Soc., 2009, 131, 13722–13727 CrossRef CAS PubMed; (d) V. Sans, L. Porwol, V. Dragone and L. Cronin, Chem. Sci., 2015, 6, 1258–1264 RSC.
- S. Singh, M. F. de Leon and Z. J. Li, J. Phys. Chem. A, 2013, 117, 10863–10872 CrossRef CAS PubMed.
- (a) J. P. McMullen and K. F. Jensen, Org. Process Res. Dev., 2011, 15, 398–407 CrossRef CAS; (b) B. J. Reizman and K. F. Jensen, Org. Process Res. Dev., 2012, 16, 1770–1782 CrossRef CAS.
- S. Mozharov, A. Nordon, J. M. Girkin and D. Littlejohn, Lab Chip, 2010, 10, 2101–2107 RSC.
- S. Mozharov, A. Nordon, D. Littlejohn, C. Wiles, P. Watts, P. Dallin and J. M. Girkin, J. Am. Chem. Soc., 2011, 133, 3601–3608 CrossRef CAS PubMed.
- J. S. Moore and K. F. Jensen, Angew. Chem., Int. Ed., 2014, 53, 470–473 CrossRef CAS PubMed.
- S. W. E. Eisenberg, M. J. Kurth and W. H. Fink, J. Org. Chem., 1995, 60, 3736–3742 CrossRef CAS.
- (a) R. J. Clemens and J. A. Hyatt, J. Org. Chem., 1985, 50, 2431–2435 CrossRef CAS; (b) M. Sato, H. Ogasawara, S. Komatsu and T. Kato, Chem. Pharm. Bull., 1984, 32, 3848–3856 CrossRef CAS.
- R. J. Clemens and J. S. Witzeman, J. Am. Chem. Soc., 1989, 111, 2186–2193 CrossRef CAS.
- D. M. Birney, X. L. Xu, S. Ham and X. M. Huang, J. Org. Chem., 1997, 62, 7114–7120 CrossRef CAS PubMed.
- M. Sato, H. Ogasawara, K. Kato, M. Sakai and T. Kato, Chem. Pharm. Bull., 1983, 31, 4300–4305 CrossRef CAS.
- Dispersion leads to the τ0 and τ1 inflection points being difficult to assign exactly. We found the most reliable method was to estimate τ0, then calculate τ1 from the flow rate corrected for thermal expansion of solvent using (τ1 − τ0) = V/F2(1 + αΔT). Where V is the volume of the reactor and α = the expansion coefficient of solvent. The derived 1st order rate constant showed very little sensitivity to the precise point chosen for τ0 within reasonable uncertainty (±5 seconds in τ0 led to a maximum of ±5% in the corresponding rate constant).
- (a) A. R. Carvalho, R. G. Brereton, T. J. Thurston and R. E. A. Escott, Chemom. Intell. Lab. Syst., 2004, 71, 47–60 CrossRef CAS; (b) T. J. Thurston and R. G. Brereton, Analyst, 2002, 127, 659–668 RSC; (c) R. G. Brereton, Chemometrics: Data Analysis for the Laboratory and Chemical Plant, Wiley, Chichester, 2003 Search PubMed.
- (a) R. Tauler, B. Kowalski and S. Fleming, Anal. Chem., 1993, 65, 2040–2047 CrossRef CAS; For recent examples of multivariate curve resolution applied to quantitative analysis of multicomponent UV spectra in reaction study see: (b) M. De Luca, S. Mas, G. Ioele, F. Oliverio, G. Ragno and R. Tauler, Int. J. Pharm., 2010, 386, 99–107 CrossRef CAS PubMed; (c) B. Hemmateenejad, K. Javidnia and M. Saeidi-Boroujeni, J. Pharm. Biomed. Anal., 2008, 47, 625–630 CrossRef CAS PubMed; (d) X. T. Zheng, X. C. Gong, Q. Li and H. B. Qu, Ind. Eng. Chem. Res., 2012, 51, 3238–3245 CrossRef CAS.
- (a) S. Gourvenec and D. L. Massart, Anal. Bioanal. Chem., 2004, 380, 373–375 CrossRef CAS PubMed; (b) F. C. Sanchez, J. Toft, B. vandenBogaert and D. L. Massart, Anal. Chem., 1996, 68, 79–85 CrossRef CAS PubMed.
- G. I. Taylor, Proc. R. Soc. London, Ser. A, 1953, 186–203 CrossRef CAS.
- (a) D. M. Ruthven, Chem. Eng. Sci., 1971, 26, 1113–1121 CrossRef CAS; (b) J. H. M. Vandenberg and R. S. Deelder, Chem. Eng. Sci., 1979, 34, 1345–1347 CrossRef CAS.
- Vandenberg and Deelder22b observed that Dean circulation starts when DnSc1/2 > 12 (where Dn is the Dean number and Sc is the Schmidt number) and follows the empirical relationship κ = −5.6(DnSc1/2)−0.68 where κ is the ratio of observed dispersion coefficient to that predicted for a linear system, though their maximum value of DnSc1/2 was 500. In our system DnSc1/2 is 13.8, 138 and 1380 for flow rates of 0.1, 1 and 10 mL min−1 respectively, in acetonitrile at 30 °C. At 0.1 mL min−1 dispersion is close to that predicted for a linear capillary, and at 1 mL min−1 it is in good agreement with the prediction of Vanderberg and Deelder. The dispersion at 10 mL min−1 is considerably less than predicted by the empirical equation but is also well outside the range for which it was validated.
- S. N. Huckin and L. Weiler, J. Am. Chem. Soc., 1974, 96, 1082–1087 CrossRef CAS.
- (a) A. Boulangé, P. A. Peixoto and X. Franck, Chem. – Eur. J., 2011, 17, 10241–10245 CrossRef PubMed; (b) N. Haddad, I. Rukhman and Z. Abramovich, J. Org. Chem., 1997, 62, 7629–7636 CrossRef CAS; (c) K. E. Henegar and J. D. Winkler, Tetrahedron Lett., 1987, 28, 1051–1054 CrossRef CAS; (d) P. A. Peixoto, A. Boulangé, S. Leleu and X. Franck, Eur. J. Org. Chem., 2013, 3316–3327 CrossRef CAS; (e) A. Boulangé, J. Parraga, A. Galán, N. Cabedo, S. Leleu, M. J. Sanz, D. Cortes and X. Franck, Bioorg. Med. Chem., 2015, 23, 3618–3628 CrossRef PubMed; (f) P. A. Peixoto, A. Boulangé, M. Ball, B. Naudin, T. Alle, P. Cosette, P. Karuso and X. Franck, J. Am. Chem. Soc., 2014, 136, 15248–15256 CrossRef CAS PubMed.
Footnote |
| † Electronic supplementary information (ESI) available. See DOI: 10.1039/c5re00007f |
| This journal is © The Royal Society of Chemistry 2016 |


