In situ FTIR spectroscopic monitoring of electrochemically controlled organic reactions in a recycle reactor†
Alexander G.
O'Brien‡
,
Oana R.
Luca
,
Phil S.
Baran
and
Donna G.
Blackmond
*
Department of Chemistry, The Scripps Research Institute, La Jolla, CA 92037, USA. E-mail: blackmond@scripps.edu
First published on 8th December 2015
Abstract
An electrochemical cell coupled with a recycle loop through a transmission FTIR cell is employed in studies of two free radical organic reactions, the oxidation of allylic alcohols and the trifluoromethylation of heteroarenes. Rapid mixing through the recycle loop allows continuous monitoring of reaction progress. Electrochemical generation of free radicals allows their controlled mediation into the reaction mixture for more efficient reaction. Kinetic profiles provide mechanistic insight into reactions under electrochemical control.
Introduction
Electrochemical methods are currently underutilized in organic synthesis for pharmaceuticals and fine chemicals but are beginning to gain importance as a tool for a wide variety of organic transformations.1 Because electrochemical reactions involve the direct introduction and removal of electrons from molecules, they offer a number of potentially key advantages over more traditional reaction methods, including fine control of electron energy, atom economy/waste reduction, predictable selectivity and substrate group tolerance. The increased current emphasis on sustainable chemistry suggests that expanding the use of these methods in pharmaceutical and agrochemical manufacture is an important goal.2–4Continuous monitoring of reaction progress to obtain kinetic data has been shown to be a powerful tool in mechanistic analysis in complex liquid and multi-phase organic reactions.5 Typical methods include the use of FTIR spectroscopy, NMR spectroscopy, and reaction calorimetry under batch reaction conditions. The complexity of an electrochemical cell provides additional challenges to such in situ methodology. We recently developed a reaction system comprised of an electrochemical reactor with recycle flow through a transmission FTIR cell that allows virtually continuous reaction monitoring without perturbation of the electrochemical cell.4 We describe this system in the context of two relevant electrochemical transformations.
Results and discussion
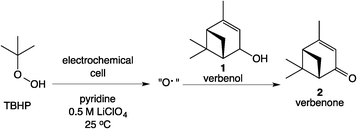
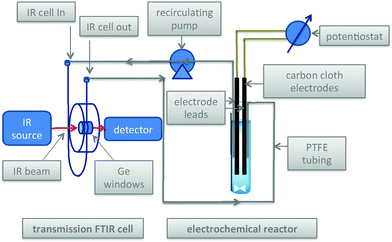
The Scheme 1 shows the oxidation of allylic alcohols mediated by tert-butyl hydrogen peroxide (TBHP) in an electrochemical cell, proposed to proceed via electrochemical initiation of free radicals from the oxidant. The trifluoromethylation of heteroarenes has also been demonstrated to proceed via electrochemical activation (Scheme 2). The role of the free radicals produced at the electrode differs in the two cases shown in Schemes 1 and 2. In the first reaction, the free radical formed from TBHP aids in oxidizing the substrate verbenol 1 to the reaction product verbenone 2, while in the second reaction, the CF3˙ radicals produced from Zn sulfinate react with the imidazole substrate 3, with incorporation of the trifluoromethyl group into reaction product 4. Here we describe a recycle reactor system for in situ monitoring of the electrochemical reactions of both Schemes 1 and 2.Scheme 3 and Fig. 1 show the electrochemical reaction schematic, including the FTIR flow cell, the electrochemical reaction cell, and the recycle system. Reaction mixtures were pumped from the electrochemical cell through the FTIR flow cell and back to the electrochemical cell typically at different flow rates. The lag time between the reaction cell and the FTIR cell was tested by switching the reactant inlet between pure solvent and a solution of 40 mM verbenone 2 for discrete periods of time, as shown in Fig. 2. A dual syringe pump allowed smooth infusion and withdrawal of the mixture to produce a steady flow rate. Optimization of the flow rate allowed a well-mixed composition to be observed in the FTIR spectrum with a lag time of less than one minute between the electrochemical reactor and the FTIR cell. These results demonstrate that the recycle reactor configuration coupled to the FTIR cell provides an accurate method for real-time monitoring of reaction progress in the electrochemical cell.
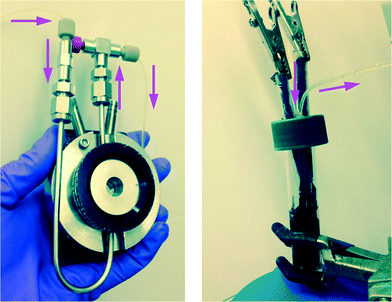 | ||
| Fig. 1 Left: Flow-through FTIR cell for transmission FTIR spectroscopic monitoring of the electrochemical reactions of Schemes 1 and 2; Right: electrochemical cell with carbon cloth electrodes. Total solution volume = 8.2 ml; lines and syringes = 2.5 ml; syringe infusion/withdrawal volume = 1 ml. Working solution volume in reactor during recycle flow = 5.7 ml. | ||
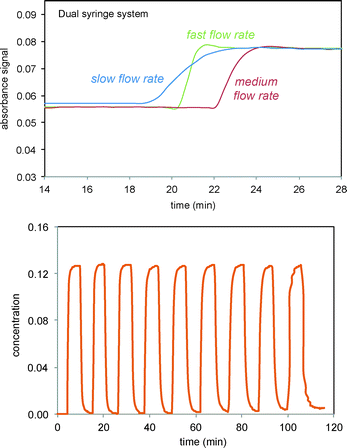 | ||
| Fig. 2 FTIR monitoring of injections of the verbenone 2 signal (1680 cm−1) into solvent in recycle flow through the electrochemical cell and the FTIR flow cell system as shown in Scheme 3 and Fig. 1. Top: Three different flow rates for infusion/withdrawal in the syringe system (in ml min−1). Slow = 4/6; medium = 5/7; fast = 6/8. Bottom: Consecutive fast switching between streams of solvent and verbenone 2. | ||
We next set out to study the reaction profiles of the systems in Schemes 1 and 2 in order to understand the parameters required for efficient electrochemical operation. Fig. 3 shows a “waterfall” plot of the FTIR spectrum of the reaction of Scheme 1 as a function of time. Kinetic analysis is carried out by calibrating pure reactant and product spectra at known concentrations with the reaction traces. We first confirmed that the in situ FTIR reaction traces provide a quantitative description of the reaction profile by comparing the in situ FTIR data to sample aliquots extracted and analysed by a previously calibrated method. Fig. 4 illustrates this for the electrochemical reaction of Scheme 2, where the product composition was analysed by 19F NMR spectroscopy. The excellent agreement between the two methods validates the FTIR approach to monitoring reaction progress.
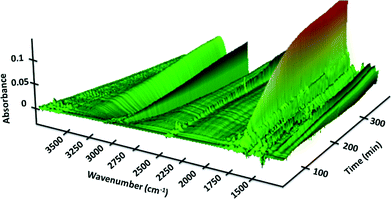 | ||
| Fig. 3 FTIR spectra of the reaction of Scheme 1 as a function of wavenumber and reaction time carried out in the recycle reactor flowing through the FTIR transmission cell. Verbenone product 2 at 1680 cm−1. [1]0 = 40 mM; [TBHP]0 = 200 mM. | ||
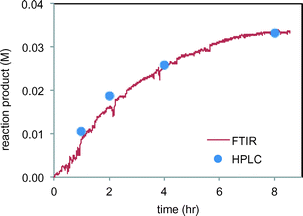 | ||
| Fig. 4 Comparison of FTIR product 4 profile (peak at 1145 m−1) with product 4 analysis by HPLC of sample aliquots in the reaction of Scheme 2. | ||
In the reactions of Schemes 1 and 2, the electrode serves a catalytic function in producing free radicals to deliver to the substrate. The catalytic power of the electrode should thus be proportional to the electrode surface area. Fig. 5 confirms this proportional relationship between product formation rate and electrode surface area for the reaction in Scheme 1.
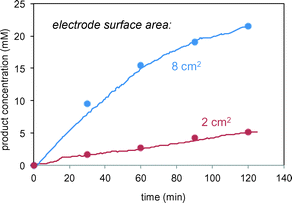 | ||
| Fig. 5 Reaction of Scheme 1 carried out using different surface area carbon electrodes. Lines represent in situ FTIR data; symbols represent sample aliquots analysed by HPLC. | ||
We next turned to probe the effect of current on the reactions of Schemes 1 and 2 carried out under electrochemical conditions. The verbenol oxidation reaction of Scheme 1 required both the oxidant TBHP and the electrochemical conditions for product turnover to occur. Fig. 6 (top) shows that the reaction of 1 fails to proceed either in the absence of TBHP under electrochemical conditions or in the presence of TBHP with no current. Thus the electrochemical conditions are clearly required to initiate free radicals from TBHP, but it is also clear that the substrate cannot be oxidized directly from the electrochemical interaction in the absence of TBHP. This is in agreement with cyclic voltammety measurements showing that verbenol does not exhibit oxidation potentials in the voltage range of these experiments.
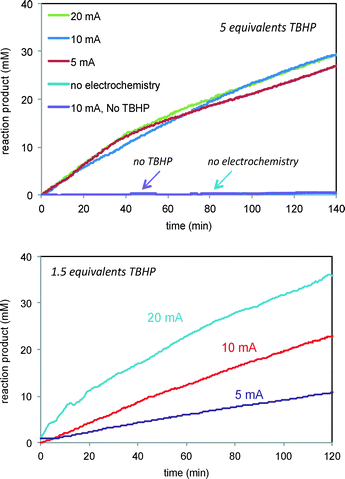 | ||
| Fig. 6 Reaction of Scheme 1 carried out at different currents and TBHP concentrations. Top: 5 equivalents TBHP and 5, 10 20 mA current. Control experiments employing either no TBHP or no current are also shown. Bottom: 1.5 equivalents TBHP and 5, 10, and 20 mA current. | ||
Fig. 6 also shows that, interestingly, the product formation rate does not show a dependence on the current when the concentration of the oxidant TBHP is in large excess (Fig. 6, top). At lower concentrations of TBHP, product formation is directly proportional to the current applied (Fig. 6, bottom). Under high excess of TBHP, the higher density of free radicals produced at the electrode may cause them to encounter other free radicals and engage in unproductive reactions more quickly than they can diffuse away from the electrode and encounter the allylic alcohol substrate, masking the dependence of free radical production on current. When the oxidant and substrate concentrations are similar, the reaction of free radicals with the substrate is more sensitive to the current producing the free radicals.
The effect of current was also studied in the reaction of Scheme 2, where CF3˙ radicals produced from Zn sulfinate at the electrode then add to substrate 3 in solution, forming product 4 in a C–H functionalization reaction. Fig. 7 shows that while the rate of formation of product 4 in the reaction of Scheme 2 is unaffected by current at levels above 12.5 mA (Fig. 7, top), the ultimate conversion attained in the reaction is directly related to the current applied, with lower currents giving higher conversions to product. In this case we are also able to follow the Zn sulfinate concentration by FTIR spectroscopy, shown in Fig. 7, bottom, which provides insight into the role of electrode current. Consumption of the Zn sulfinate, which is employed in excess to the arene substrate 3, is directly proportional to the current employed. Lower current helps to mediate the production of CF3˙ radicals so that a larger fraction is engaged in productive reaction. More rapid consumption at higher currents effectively stops formation of product 4 at the point in time where the Zn sulfinate is fully consumed (see arrows and dashed lines in Fig. 7).4
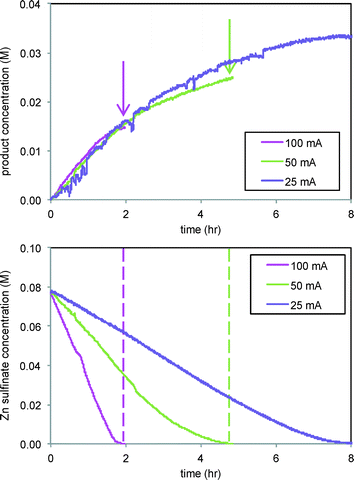 | ||
| Fig. 7 Reaction of Scheme 2 carried out at different electrode currents. Top: Product 4 formation (1145 cm−1). Bottom: Consumption of Zn sulfinate (1722 cm−1). 3 equivalents of Zn sulfinate were employed compared to substrate 3. | ||
Concentration dependences in the reactions of Schemes 1 and 2 were probed by reaction progress kinetic analysis using the “same excess” and “different excess” protocols.5 The excess is defined as the difference between the initial concentrations of substrate and free radical species as given in eqn (1) and (2).
| [excess]Scheme 1 = [TBHP]0 − [1]0 | (1) |
| [excess]Scheme 2 = [Zn(SO2CF3)2]0 − [3]0 | (2) |
The parameter excess has units of concentration and can be positive, negative, or zero. Two reactions carried out with different values of [excess] are sufficient to provide the concentration dependences of both substrates. Two reactions carried out at the same value of [excess] allow probing of the robustness of the reaction. Table 1 lists the reaction conditions for kinetic analysis of the reaction in Scheme 1.
| Entry | [1]0 (mM) | [TBHP]0 | [excess] (mM) |
|---|---|---|---|
| 1 | 40 | 60 | 20 |
| 2 | 20 | 60 | 40 |
| 3 | 40 | 80 | 40 |
Fig. 8 plots the two “same excess” experiments (entries 2 and 3) as substrate 1 concentration vs. time. The substrate concentration is calculated from the measured product concentration2 as a function of time using the reaction stoichiometry, as shown in eqn (3).
| [1] = [1]0 − [3] | (3) |
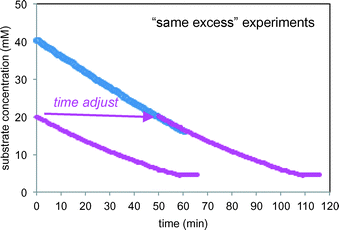 | ||
| Fig. 8 Kinetic profiles of the two “same excess” reactions of Scheme 1 carried out under the conditions of Table 1 (entries 2 and 3) including the “time-adjusted” run from entry 2. | ||
The initial conditions of the reaction of entry 2 are identical to the reaction conditions of entry 3 at 50% conversion, and from that point onward, the two reactions exhibit identical conditions. The “time-adjusted” entry 2 curve perfectly overlays the profile from the reaction of entry 3, indicating that the two reactions exhibit the same rate from this timepoint onward. At the point of the time-adjust, the electrodes for the reaction of entry 3 have been operating for nearly an hour, while the electrodes are fresh for the reaction of entry 2. This confirms that the electrochemical system is robust.
Fig. 9 compares product formation profiles for “different excess” conditions from the reaction of Scheme 1. The three reactions appear to exhibit similar initial rates regardless of the initial concentrations of either TBHP or 1. that the reaction exhibits zero order kinetics in [1] and positive order kinetics in concentration of TBHP. Overlay between the profiles for the runs of entries 1 and 2, where the initial concentration of 1 was different but [TBHP]0 was the same, indicates that the reaction exhibits zero order kinetics in [1]. Reactions initiated with higher [TBHP] (entry 3) maintained the constant initial rate for longer than reactions with lower TBHP concentrations. The overall zero order kinetics of the profile of this reaction at higher [TBHP] suggests the reaction may become limited by the decreasing driving force to produce free radicals at the electrode as TBHP is consumed. The oxidant must be present in a large enough excess to account for its reactivity in unproductive reactions as well as in interactions with the alcohol substrate 1.
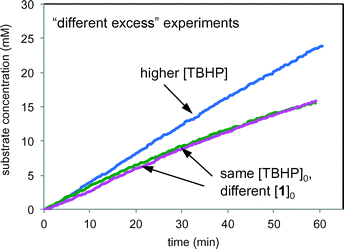 | ||
| Fig. 9 Product formation profiles for the reaction of Scheme 1 carried out under the conditions of Table 1. Green: entry 1; magenta: entry 2; blue: entry 3. | ||
RPKA analysis was carried out on the reaction of Scheme 2, with [excess] defined as in eqn (2). Table 2 lists the reaction conditions for kinetic analysis of the reaction in Scheme 2.
| Entry | [3]0 (mM) | [Zn(SO2CF3)2]0 | [excess] (mM) |
|---|---|---|---|
| 1 | 55 | 77 | 22 |
| 2 | 110 | 77 | −33 |
| 3 | 55 | 154 | 99 |
Fig. 10 shows that the reaction rate is independent of the concentration of the trifluoromethylating reagent and exhibits positive order kinetics in the imidazole substrate 3. This is in contrast to the reaction of Scheme 1, where the free radical reaction partner appeared to be a positive driving force while the organic substrate was not. However, these results are in accordance with those in Fig. 7 showing that the rate of product 4 formation was independent of the rate of Zn sulfinate decomposition. The electrochemical reaction mediates a steady concentration of CF3˙ radicals to react with the substrate. For the reaction of Scheme 1, rate appears to be controlled by free radical production at the electrode or by subsequent physical processes delivering the free radical to the substrate 1. Chemical reaction between the free radical and the substrate proceeds faster than these processes and thus occurs after the rate-controlling step in the overall process.
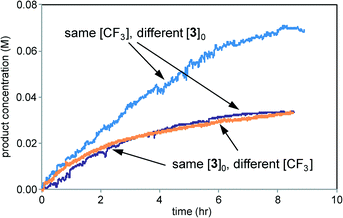 | ||
| Fig. 10 Kinetic profiles of three reactions of Scheme 2 carried out under the conditions of Table 2. Purple: entry 1; blue: entry 2; orange: entry 3. | ||
Conclusions
A system for monitoring reaction progress in electrochemical organic synthesis is described based on an electrochemical reactor using carbon cloth electrodes equipped with a recycle flow stream through a transmission FTIR cell. Two model reactions are studied to demonstrate the potential of this system for virtually continuous monitoring of electrochemical transformations. The TBHP-mediated oxidation of the allylic alcohol verbenol 1 helped to demonstrate the catalytic robustness of the carbon cloth electrodes over many turnovers. The trifluoromethylation of imidazole 3 using Zn sulfinate revealed the ability to mediate the introduction of free radicals to the reaction mixture. Reaction progress kinetic analysis of both reactions revealed the key driving forces for reaction optimization.These results highlight some of the critical features and potential advantages of electrochemical organic synthesis, including robust operation along with better control of the reaction rate, better efficiency of reagents, and potentially implications for reaction selectivity. An understanding of the physical rate processes occurring at the electrode in conjunction with the free radical reaction mechanism is critical for developing and optimizing these electrochemical transformations.
Acknowledgements
DGB and PSB acknowledge funding from NIH/NIGMS (GM-106210).References
- S. Waldvogel and B. Janza, Angew. Chem., Int. Ed., 2014, 53, 7122 CrossRef CAS PubMed.
- For recent reviews in electrochemistry, see: (a) K. D. Moeller, Tetrahedron, 2000, 56, 9527 CrossRef CAS; (b) A. P. Tomilov, V. V. Turygin and L. V. Kaabak, Russ. J. Electrochem., 2007, 43, 1106 CrossRef CAS.
- B. R. Rosen, E. W. Werner, A. G. O'Brien and P. S. Baran, J. Am. Chem. Soc., 2014, 136, 5571 CrossRef CAS PubMed.
- A. G. O'Brien, A. Maruyama, Y. Inokuma, M. Fujita, P. S. Baran and D. G. Blackmond, Angew. Chem., Int. Ed., 2014, 53, 12062 CrossRef.
- (a) D. G. Blackmond, Angew. Chem., Int. Ed., 2005, 44, 4302 CrossRef CAS PubMed; (b) J. S. Mathew, M. Klussmann, H. Iwamura, F. Valera, A. Futran, E. A. C. Emanuelsson and D. G. Blackmond, J. Org. Chem., 2006, 71, 4711 CrossRef CAS PubMed; (c) D. G. Blackmond, J. Am. Chem. Soc., 2015, 137, 10852 CrossRef CAS PubMed.
Footnotes |
| † Electronic supplementary information (ESI) available. See DOI: 10.1039/c5re00050e |
| ‡ Present address: GSK, King of Prussia, Pennsylvania, 19406 USA. |
| This journal is © The Royal Society of Chemistry 2016 |

