The catalytic activity and chemical structure of nano MoS2 synthesized in a controlled environment
H. P.
Zhang
a,
H. F.
Lin
a,
Y.
Zheng
*ac,
Y. F.
Hu
b and
A.
MacLennan
b
aUniversity of New Brunswick, 15 Dineen Dr. Fredericton, NB E3B 5A3, Canada. E-mail: yzheng@unb.ca
bCanadian Lightsource Inc., 44 Innovation Blvd, Saskatoon, SK S7N 2V3, Canada
cUniversity of Edinburgh, Mayfield Road, Edinburgh, EH9 3DW, UK. E-mail: y.zheng@ed.ac.uk
First published on 8th January 2016
Abstract
A novel hydrothermal method for the preparation of nano MoS2 for hydrodesulfurization (HDS) with MoO3 as a precursor is presented. The redox reaction mechanism is, for the first time, revealed. It is shown to involve the oxidation of S2− to SO42− while hexavalent Mo is reduced to quadrivalent Mo to form MoS2. The HS− group is identified to play a key role in the reduction of MoO3. The interaction between Na2S and the HS− group and the yield of the resulting MoS2 are controlled via the pH of the synthesis solution. Various characterization methods, e.g. XRD, TEM, SEM, BET, TPR, XPS, XANES, EXAFS, etc., are employed for the characterization of the synthesized MoS2. The results show that high purity MoS2 is obtained. The ratio of precursors, MoO3 and Na2S, influences the crystal structure and catalytic activity. A slightly less amount of sulfur than the stoichiometric ratio of S/Mo produces defect sites, which promote catalyst activities in the hydrodesulfurization of real light cycle oil (LCO).
Introduction
Nano-scaled molybdenum disulfide (MoS2) has a layered structure with individual sheets strongly covalently bonded within but held together through weak van der Waals interactions. This results in two distinct surfaces of MoS2: basal and edge planes. Within a layer, each Mo(IV) center is bonded to six sulfur atoms forming a trigonal prismatic coordination while every sulfur atom is connected with three Mo forming pyramidal interstices.1,2 The unique structure and chemical properties make MoS2 widely applied as a functional material in diverse fields such as lubrication, electronic transistors, batteries, photovoltaics, catalysis, and sensing.3 MoS2 also shows high activity in the hydrodesulfurization reaction.4There are different methods for the synthesis of nano MoS2 including solid–gas sulfidation, thermal decomposition, and solution reactions.5 The hydrothermal method is an alternative route to prepare nano MoS2 with MoO3 as a precursor.6 Compared to thiomolybdate, MoO3 is an attractive precursor as it is cost-effective. MoO3 has been used as a precursor to synthesize nano MoS2 of different morphologies, e.g. nanosheets,4 nanowires,7 nanotubes and nanorods.8 Our previous study discussed the effect of temperature on the nucleation and growth processes.6 A relationship has been established between the crystallization process and the MoS2 structure. Successful production of nano MoS2 through the hydrothermal route is associated with a number of synthesis parameters such as the pH of solvent, precursor concentration, and temperature. However the reaction mechanisms for the formation of MoS2 are poorly understood.
This work tends to address this deficiency. In particular, the role of the reducing agent in the transformation of hexavalent Mo to quadrivalent Mo to form MoS2 will be studied. The reaction mechanism of the nano MoS2 formation is discussed. Appropriate synthesis conditions result in a high yield of highly dispersed nano MoS2 crystallites that have high hydrodesulfurization activity. The textural and chemical structures of the synthesized catalysts were extensively characterized by various techniques, e.g. TEM, BET, XRD, XPS, TPR and XAFS, etc. The hydrodesulfurization (HDS) and hydrodenitrogenation (HDN) activities were evaluated using a real diesel fraction – the light cycle oil (LCO).
Experimental section
Preparation of MoS2 catalysts
A series of molybdenum sulfide catalysts were synthesized using MoO3 (STEM Scientific) and Na2S·9H2O (Fisher Scientific) as precursors.6 14.4 grams of MoO3 was used in the synthesis. Different molar ratios of Na2S to MoO3 were employed and are listed in Table 1. Na2S·9H2O and MoO3 were gradually dissolved in deionized water and 4 M HCl was added dropwise to adjust the pH of the solution. The mixture was then transferred into an autoclave and reacted for 2 h at 320 °C at 500 rpm under nitrogen or hydrogen atmospheres. The resultant black solid was filtered, washed with deionized water and ethanol, and then dried under nitrogen protection at 150 °C for 4 h. The catalyst recovery rate was calculated based on the theoretical MoS2 yield (eqn (1)). The prepared MoS2 catalysts at various Na2S to MoO3 molar ratios were denoted as CAT-x (where x stands for the molar ratio of Na2S to MoO3). The pH values of the initial synthesis solution and the final filtrate were determined using a pH meter (AB 15, Fisher Scientific). The concentrations of sulfur anions S2O32− and SO42− in the filtrate were determined by using an ion chromatograph (DIONEX, DX-120). The reference MoS2 was purchased from SPI Supplies. | (1) |
| Entry | Reaction conditions | Products | |||||
|---|---|---|---|---|---|---|---|
| Na2S/MoO3 molar ratio | HCl/MoO3 ratio | Gas atmosphere (psi) | Initial pH | Filtrate pH | Solid product | Solid recovery (%) | |
| 1 | 2.50 | 0 | N2 (15) | 12.59 | 13.29 | Little solid | — |
| 2 | 2.50 | 2.25 | N2 (15) | 10.61 | 12.92 | Amorphous MoSx (x > 2) | <1 |
| 3 | 2.50 | 4.50 | N2 (15) | 5.70 | 2.61 | Nanocrystalline MoS2 | 96 |
| 4 | 2.00 | 4.50 | N2 (15) | 0.95 | — | MoO2, MoS2 MoSx (x ≪ 2) | — |
| 5 | 3.75 | 7.00 | N2 (15) | 4.07 | 3.02 | Nanocrystalline MoS2 | 95 |
| 6 | 2.50 | 4.50 | N2 (200) | 5.70 | 2.53 | Nanocrystalline MoS2 | ∼100 |
| 7 | 2.50 | 4.50 | H2 (200) | 5.70 | 9.85 | MoO2 | — |
Catalyst characterization
The transmission electron microscopy (TEM) images were recorded on a JEOL 2011 STEM (JEOL Ltd., Tokyo, Japan) operated under high-resolution mode and 200 keV of electrical energy. The average length and thickness of MoS2 crystals calculated using eqn (2) and (3) were the expected values. At least 200 images of different MoS2 particles (a particle refers to one MoS2 crystallite) were used. The morphology of the catalysts was also observed by scanning electron microscopy (JEOL JSM6400 SEM). | (2) |
 | (3) |
 is the expected value of the particle thickness and
  is the expected value of the particle length. It is assumed that all i-th layered particles have the same thickness (Ti). The length of i-th layered particles, Li, is the average length of the particles that have the same numbers of layers (i). Ni denotes the number of i-th layered particles and N represents the total number of particles.
The measurement of the nitrogen adsorption–desorption isotherm was conducted on an Autosorb-1 (Quantachrome Instruments). The specific surface area of the catalyst was determined using the Brunauer–Emmett–Teller (BET) method. The total pore volume was calculated from the volume of nitrogen adsorbed at the relative pressure p/p0 of 0.995. Pore size distribution was analyzed from the isotherms by the Barrett–Joyner–Halenda (BJH) method.
The synthesized products were identified from the X-ray diffraction (XRD) pattern, which were recorded on a diffractometer (Bruker AXS D8 XRD) using CuKα radiation with a 2θ range of 5–85° and a scan speed of 1° min−1.
The elemental analysis for molybdenum and sulfur was conducted on a JEOL-733 Superprobe, operating at 15 keV and 100 nA.
Temperature programmed reduction (TPR) was conducted on an Autosorb-1 (Quantachrome Instruments). 100 mg of catalyst was added in a quartz tube and heated to 700 °C at a rate of 10 °C min−1, under a 50 ml min−1 flow of 2% H2 in Ar. The consumption of H2 and production of H2S were monitored by a mass spectrometer (RGA 200 Stanford Research Systems, Inc.).
The XPS measurements were performed on an AXIS 165 spectrometer (Kratos Analytical, University of Alberta). The base pressure in the analytical chamber was lower than 3 × 10⁻⁸ Pa. A monochromatic Al Kα source (hν = 1486.6 eV) was used at a power of 210 W. The analysis spot was 400 × 700 μm. The resolution of the instrument is 0.55 eV for Ag 3d and 0.70 eV for the Au 4f peaks. The survey scans were collected for the binding energy extending from 1100 eV to 0 eV with a pass energy of 160 eV and a step of 0.4 eV. 20 eV with a step of 0.1 eV was used for the pass energy for the high-resolution spectra. The number of scans varied from 3 to 30 to ensure a good signal to noise ratio.
The X-ray absorption near edge structure (XANES) spectra were obtained at the Soft X-ray Microanalysis Beamline (SXRMB) of the Canadian Light Source (CLS; Saskatoon, SK, Canada) equipped with a Si (1 1 1) double crystal monochromator. CLS, a 2.9 GeV, third generation storage ring, presently operates with an injection current of 250 mA. Samples were sulfided at 280 °C in H2 with dimethyl disulfide (DMDS) for 2 h prior to measurement. Catalyst powders were uniformly dispersed on double-sided conducting carbon tape under a dry nitrogen atmosphere. The measurements of the S K-edge and Mo L3-edge were made in total electron yield by recording the sample drain current. Data analysis of the XANES spectra was performed using the Athena software. Mo K-edge EXAFS spectra were recorded in the transmission mode at room temperature. Fourier transformation of the k/f(k) weighted EXAFS data for Δk = 14 Å−1(3 < k < 17) was performed to obtain the radial distribution function around Mo. The detailed procedure was described elsewhere.9
Hydrodesulfurization evaluation
A batch reactor (Parker Autoclave Engineers) was employed in this experiment. A light cycle oil (LCO) with 1.46% S and 156 ppm N provided by a local refinery was used as feedstock. When the reactor was heated to 375 °C, LCO was introduced into the reactor. The weight ratio of the catalyst to oil is 1![[thin space (1/6-em)]](https://www.rsc.org/images/entities/char_2009.gif) :
:![[thin space (1/6-em)]](https://www.rsc.org/images/entities/char_2009.gif) 200. The hydrodesulfurization (HDS) and hydrodenitrogenation (HDN) took place at 375 °C under a H2 gas pressure of 1400–1500 psi and 1000 rpm.
200. The hydrodesulfurization (HDS) and hydrodenitrogenation (HDN) took place at 375 °C under a H2 gas pressure of 1400–1500 psi and 1000 rpm.
The total sulfur and nitrogen concentrations of the feedstock and the hydrotreated products were measured by a Sulfur/Nitrogen analyzer (9000 series, Antek Instruments Inc.). The sulfur species were analyzed by a gas chromatograph (GC) equipped with a non-polar VF-1 ms capillary column (15 m × 0.25 mm × 0.25 μm, max temperature: 325 °C) and a PFPD detector (Varian 450). The following temperature profile was used: 2 min at 120 °C, followed by a linear increase at 6 °C min−1 to 170 °C and a further increase at 20 °C min−1 to 290 °C, kept for 2 min. The density of the liquid oil was measured by using a portable density meter (DMA 35N, Anton Paar GmbH, Graz, Austria) following ASTM 4052. The HDS/HDN conversion was calculated by subtracting the sulfur/nitrogen in the feed from the product and dividing by the sulfur/nitrogen in the feed. The calculation of the rate constant k was based on the pseudo-first order reaction.
Results and discussion
Synthesis of MoS2 in a controlled medium
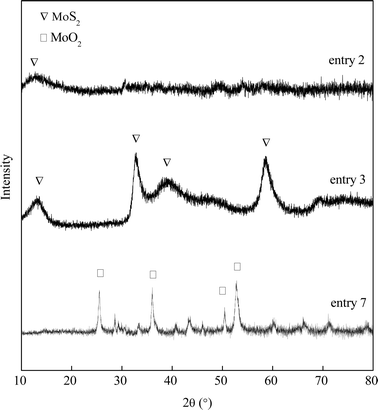
A series of MoS2 were synthesized in a medium of controlled pH values. The experimental parameters are shown in Table 1. MoO3 and Na2S serve as the molybdenum and sulfur sources, respectively. Without the addition of HCl, the Na2S precursor is first mixed in deionized water. Then MoO3 powders were slowly stirred in and completely dissolved in the basic solution. A clear yellow liquid with pH = 12.59 formed and the liquid was then transferred to an autoclave for a 2 hour hydrothermal reaction at 320 °C. No solid catalyst was produced (entry 1). HCl was used to adjust the pH of the resulted liquid mixture for all other entries. The clear yellow liquid turns to dark red or brown once HCl was dropped in. After slightly reducing the initial pH of the Na2S–MoO3 solution from 12.59 to 10.61, a small amount of dark solid product was detected after the 2 hour synthesis (entry 2). The single (0 0 2) diffraction peak shown in the XRD pattern (Fig. 1) confirmed that the solid product was amorphous MoSx. Continuous adjustment of the pH of the Na2S–MoO3 solution to pH = 5.70 (entry 3) leads to a satisfactory result. The yield of MoS2 reached as high as 96% of its theoretical value. The obtained MoS2 also shows satisfactory crystallinity as indicated by the XRD pattern (Fig. 1). Further acidification of the Na2S–MoO3 solution to pH = 0.95 led to an unsuccessful synthesis (entry 4) with a significant amount of MoO2 identified. This finding suggests that the initial pH of the synthesis solution plays a key role in the formation of nano crystalline MoS2.The gaseous environment is also a factor that influences the conversion from MoO3 to MoS2. With an inert gas (nitrogen) filled in the reaction chamber, Na2S (S2−) acted as the reducing agent and crystallized MoS2 was successfully synthesized (entries 3, 5 and 6). However, a reductive gas, e.g. hydrogen gas, can replace Na2S, which function as a reducing agent during the synthesis, reducing MoO3 to MoO2 instead of forming MoS2 (Fig. 1). Compared to entries 5 & 6, entry 7 has a very high pH of filtrate, which suggests little consumption of Na2S during the synthesis (Table 1). A reductive gas atmosphere has a negative impact on the formation of crystallized MoS2.
| S2 + H2O ↔ HS− + OH− | (1) |
| HS− + H2O ↔ H2S + OH− | (2) |
| MoO3 + 2OH− ↔ MoO42− + H2O | (3) |
| MoO42− + nH+ + nHS− ↔ MoO4−nSn2− + nH2O (n = 1 − 4) | (4) |
| MoS42− + H+ ↔ MoS3 ↓ + HS− | (5) |
 | (6) |
 | (7) |
 | (8) |
Synthesis reactions: identification of the key role of H+ and HS−
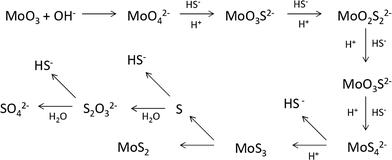
In the hydrothermal synthesis, crystalline MoS2 is formed from the redox reaction of MoO3 and Na2S, where Mo is reduced from Mo6+ to Mo4+. Sodium sulfide is hydrolyzed in water to give strong alkaline solutions, as shown in reaction 1 and reaction 2. Due to its acidic nature, MoO3 is easily dissolved in a basic solution to give MoO42− (reaction 3), forming a clear yellow solution, as seen in entry 1 of Table 1. Unfortunately, the MoO42− group is not directly responsible for the precipitation of solid MoS2.Addition of a few drops of HCl darkens the solution. Continuous titration with acids leads to precipitation of solids (entry 2), which is confirmed to be molybdenum sulfides (amorphous). H+ appears to be a likely mechanistic requirement for the solid precipitation. It is known that MoO42− could react with H+ and HS− to form tetrahedral sulfido–molybdenum complexes such as MoOS32−, MoO2S22−, MoO3S2− and MoS42−.10 This is a [H+]-dependent process and a high [H+] is beneficial for O removal. The HS− was confirmed to be an effective incoming nucleophile to interact with O2− on Mo(VI).10 Sufficient [H+] and [HS−] then led to initial precipitation of MoSx at room temperature,5 which is the seed for the production of crystal MoS2.7Reaction 4 and reaction 5 are proposed to describe the process.
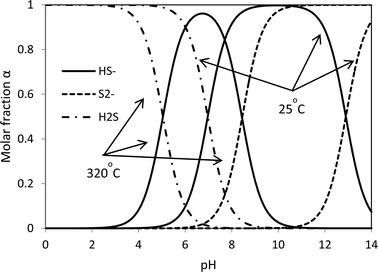
The HS− group plays a key role in the redox reaction. The hydrolysis of a sulfide ion gives three species: S2−, HS− and H2S. Given the ΔH and ΔG,16 the rate constants can be calculated and then the molar concentrations of the three species at different pH values can be determined. The theoretical acid–base behaviours of the S2−, HS− and H2S as a function of pH are shown in Fig. 2. In strong alkaline solutions, a sulfide ion is present in the deprotonated form as the sulfide dianion, S2−, while in a strong acid environment, it exists in the form of H2S. HS− becomes inadequate in both strong acid and strong alkaline synthesis solutions. Without sufficient HS−, reaction 4 most likely stops and thus the formation of intermediate complexes MoO4−nSn2− becomes limited. The presence of S2− in a strong alkaline solution cannot facilitate reaction 4 to proceed (entry 2). This suggests that S2− plays no role in the formation of MoS2. With a strong acid solution, a large amount of H2S is produced and remains in the gaseous phase due to its poor solubility in an acidic solution. A certain amount of MoO2 is formed (entry 4). On the other hand, HS− is produced in a mild acid solution (entries 3, 5 and 6) and good yields of MoS2 are obtained. Therefore, the formation and the production yield of crystalline MoS2 are highly associated with [H+] and [HS−]. Both insufficient [H+] and overdose [H+] generate inappropriate pH of the synthesis solution, which results in unsatisfactory concentration of HS− and then little MoS2 can be produced. Species HS− is present in neutral and basic solutions at room temperature. The pH for the HS− group shifts to lower values at the hydrothermal synthesis temperature, 320 °C, with the optimal range falling between 6 and 8. It is fair to comment that the formation of MoS2 is a [H+] and [HS−] dependent process. Up to this point, it seems that both weak acid and basic initial solutions are suitable for MoS2 synthesis. Further discussion is presented below to interpret whether a mild acid or mild basic solution is optimal for the production of MoS2.
At the synthesis temperature, 320 °C, the precipitated solid MoS3 from reaction 5 is reduced to MoS2 accompanied by the production of elemental sulfur in reaction 6 (elemental sulfur was observed in the synthesis). The elemental sulfur reacts with water to form S2O32−, which may be further oxidized to SO42−. Reactions 7 and 8 are proposed. It is worth mentioning that H+ and HS− are released in both redox reactions. Generation of HS− directly enhances the precipitation of MoS3 that is further reduced to MoS2. Produced H+ lowers the pH value of the final filtrate than its initial solution. Apparently, complete oxidization of sulfur to SO42− favors high yield of MoS2. S2O32− is more stable in a basic aqueous solution than in an acid solution. S2O32− tends to be oxidized to SO42− in an acidic solution. Two catalysts, named CAT-2.5 and CAT-3.0 (Table 2), were synthesized using the weak acid and weak basic initial solutions. 96.2% and 55.1% of the theoretical yield were obtained, respectively. The concentration of SO42− in the filtrates directly corresponds to the MoS2 yield. This demonstrates that the initial synthesis solution must be a weak acid to achieve an optimal yield of MoS2. A reaction scheme for the hydrothermal synthesis of MoS2 using MoO3 and Na2S as precursors is summarized and shown in Scheme 1. The overall reactions are shown in reaction 9 and reaction 10 with S2O32− and SO42− as the main oxidized product, respectively.
| 4MoO3 + 9Na2S + 16HCl → 4MoS2 + Na2SO4 + 16NaCl + 8H2O | (9) |
| 4MoO3 + 10Na2S + 18HCl → 4MoS2 + Na2S2O3 + 18NaCl + 9H2O | (10) |
| Catalyst name | Initial S/Mo | S/Mo in final MoS2 | Filtrate color | MoS2 yield (%) | S2O32− conc. (g L−1) | SO42− conc. (g L−1) |
|---|---|---|---|---|---|---|
| CAT-2.0 | 2.00 | — | Colourless | Little | ||
| CAT-2.5 | 2.50 | 1.85 | Colourless | 96.2 | 0.13 | 3.1 |
| CAT-3.0 | 3.00 | 2.05 | Yellow | 55.1 | 1.74 | 1.28 |
| CAT-3.75 | 3.75 | 2.10 | Orange | 25.6 | 1.53 | 0.31 |
| CAT-4.5 | 4.50 | 1.95 | Red | 11.8 | 1.23 | 0.05 |
| CAT-5.0 | 5.00 | — | Grey | <1.0 | 0.18 | 0 |
Adjustment of the S/Mo ratio
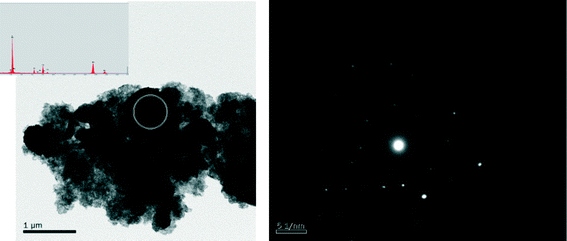
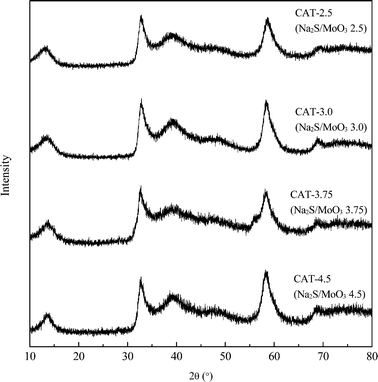
Six atomic ratios of sulfur to molybdenum of the precursors, ranging from 2 to 5, are prepared and the results are shown in Table 2. The stoichimetric S/Mo molar ratio in MoS2 is 2. Since a portion of Na2S acts as a redox mediator during the synthesis, the S/Mo ratios of the obtained MoS2 are inevitably lower than the corresponding S/Mo ratios of the precursors. Under-dosed Na2S inevitably leads to excessive MoO3 in the synthesis, e.g. CAT-2.0. Molybdenum-dominant solid particles are generated and embedded between the layered MoS2, resulting in poor uniformity of MoS2 (Fig. 3). On the other hand, excessive Na2S results in a strong alkaline synthesis solution and thus a scarce solid catalyst is formed, e.g. CAT-5.0. The XRD patterns and electron diffraction rings of the four catalysts, as shown (Fig. 4 and 5), confirm the successful synthesis of MoS2.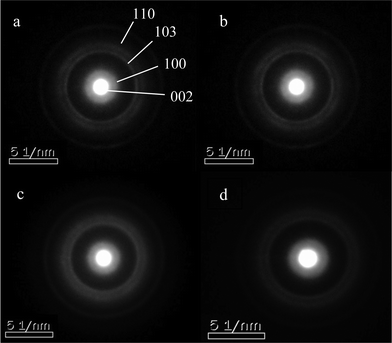 | ||
| Fig. 5 Diffraction rings of MoS2 at different Na2S/MoO3 ratios. a: CAT-2.5; b: CAT-3.0; c: CAT-3.75; d: CAT-4.5. | ||
Determination of the MoS2 chemical structure
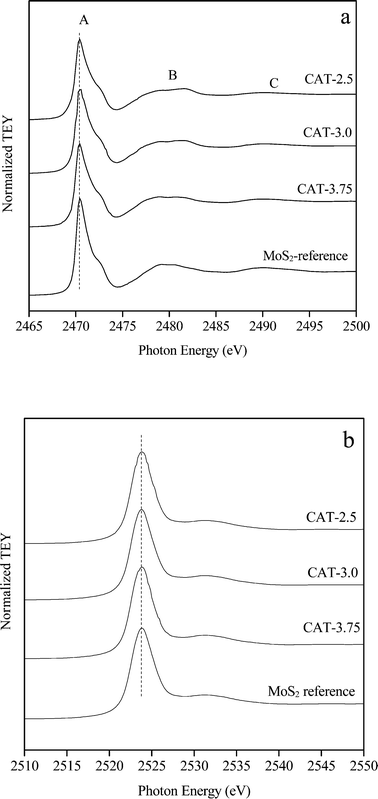
The S/Mo ratios of the three catalysts, CAT-2.5, CAT-3.0, and CAT-3.75, determined by microprobe analysis are 1.85, 2.05 and 2.10, respectively (Table 3). The bulk and surface chemical states of the catalysts are identified by XANES and XP spectroscopy. The S K-edge (a) and Mo L3-edge (b) XANES spectra are displayed in Fig. 6. The spectra acquired simultaneously in total electron yield (TEY) with an estimated 100 nm in probing depth are more bulk sensitive. The peak (whiteline) at 2471 eV (peak A) is due to the S 1 s to 3p dominated transitions of S in the −2 oxidation state.11 According to the typical periodic slab model,12 two types of S coordination are noticed on the MoS2 surface. Thus, the two broad peaks (B and C) located at 2478–2484 eV and 2489–2495 eV may be attributed to the S pyramidal coordination on the basal planes and the S hexagonal structure, respectively. The Mo L3-edge (whiteline) observed at 2524 eV with the shoulder peak (2532 eV) is associated with the electron transition from Mo 2p3/2 to vacant 4d (ref. 13 and 14) and the trigonal prismatic coordination of Mo atoms, respectively.13,15 Apparently, all spectra exhibit an identical vacancy state with the reference, indicating a high purity of MoS2.| Catalysts | S/Mo ratio | Average slab length (nm) | Average slab thickness (nm) | BET surface area (m2 g−1) | Total pore volume (m3 g−1) |
|---|---|---|---|---|---|
| CAT-2.5 | 1.85 | 17.4 | 2.3 | 231.1 | 2.3 |
| CAT-3.0 | 2.05 | 15.8 | 2.6 | 262.2 | 1.6 |
| CAT-3.75 | 2.1 | 17.9 | 2.5 | 198.9 | 0.9 |
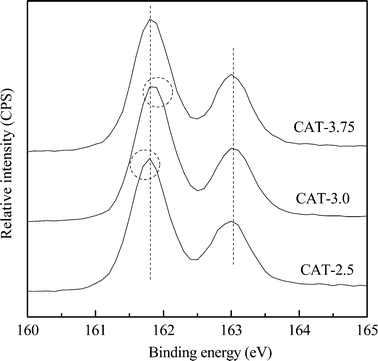
The typical XPS spectra of the S 2p core level region of the as-prepared MoS2 catalysts are shown in Fig. 7. All the spectra exhibit typical profiles of pure MoS2 with strong S and Mo peaks. The S 2p spectra contain a S 2p3/2 (161.8 eV) and S 2p1/2 (163.0 eV) spin–orbit doublet with an intensity ratio of around 2![[thin space (1/6-em)]](https://www.rsc.org/images/entities/char_2009.gif) :
:![[thin space (1/6-em)]](https://www.rsc.org/images/entities/char_2009.gif) 1, which are indexed to a typical spectrum of a sulfide S2− ion.17 Small but unmistakable differences in the chemical shift are also observed among the catalysts. The S 2p3/2 peak of CAT-2.5 slightly shifts to a lower energy, whereas the peak of CAT-3.0 shifts to a higher energy (circled), giving the electron binding energy order of CAT-2.5 < CAT-3.75 < CAT-3.0.
1, which are indexed to a typical spectrum of a sulfide S2− ion.17 Small but unmistakable differences in the chemical shift are also observed among the catalysts. The S 2p3/2 peak of CAT-2.5 slightly shifts to a lower energy, whereas the peak of CAT-3.0 shifts to a higher energy (circled), giving the electron binding energy order of CAT-2.5 < CAT-3.75 < CAT-3.0.
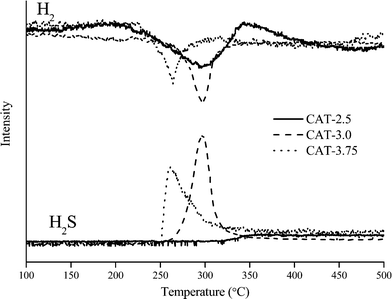
The TPR traces of the sulfide catalysts are shown in Fig. 8, illustrating the consumption of H2 and the production of H2S in the temperature range of 100–500 °C. For H2 consumption, typical peaks for weakly bonded sulfur are observed in the low temperature range of 200–370 °C. It is commonly accepted that the consumption of H2 can reflect the number of weakly bonded sulfur on the surface of catalysts.12,18 H2 is firstly dissociatively adsorbed on two sulfur dimers which are bonded on adjacent Mo sites, creating two S–Mo–SH groups. Then one hydrogen atom transfers from one group to another to form a SH–Mo–SH group. Finally, H2S is released from an active site of *–Mo–S, where * refers to the sulfur vacancy.12 However, one assumption is made that the two sulfur dimers are bonded on the same Mo atom. Otherwise, the SH–Mo–SH group cannot be formed properly, in which case, the system needs to be stabilized by a state of two *–Mo–SH groups, thus, no H2S can be released. Therefore, the difference between H2 consumption and H2S production in the TPR spectrum may differentiate the existing active sites from those that can be potentially formed. For catalyst CAT-2.5, the TPR spectrum shows a large H2 consumption but no H2S production. The absence of a H2S peak suggests a high deficiency of S on the surface. The wide peak also suggests inhomogeneous defect sites. For the CAT-3.0 and CAT-3.75, the H2S content is highly associated with the H2 consumption, indicating the high coverage of S on the surface. It is noted from the TPR spectra that the initiation temperature for releasing H2S is lower on CAT-3.75 than CAT-3.0 and the H2S curve is wider. This may be due to the different type of sulfur on the catalyst surface. CAT-3.75 contains over-stoichiometric sulfur that may be weakly bonded to the catalyst thus easy to eliminate. In contrast, the H2S curve over CAT-3.0 barely has none-stoichiometric sulfur. Sulfur species are uniformly bonded within CAT-3.0 so that the H2S peak is sharp.
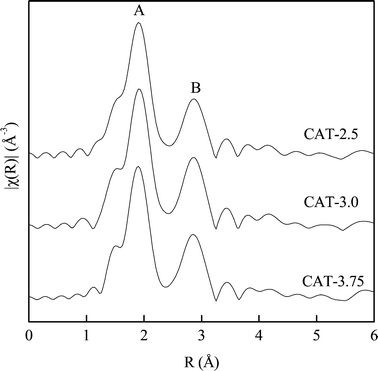
Fig. 9 shows the Fourier transform of the Mo K absorption edge for all the three catalysts. The spectra show two notable peaks corresponding to Mo–S (peak A) and Mo–Mo (peak B).15 The first largest peak at 1.90 Å (phase shift uncorrected) arises from sulfur atoms in the first coordination sphere around Mo atoms, while the second peak at 2.86 Å (phase shift uncorrected) is due to the nearest neighbor Mo atoms. The EXAFS results exhibit a similar MoS2 structure. The only difference noticed is that the Mo–Mo bond for CAT-2.5 is lower than the other two catalysts. The calculated coordination number (CN) from the Fourier transform is shown in Table 4. It is noticed that all the three catalysts exhibit a lower CN than the MoS2 in the bulk. Similar to the spectra, the smallest CN of Mo–Mo is observed with CAT-2.5, indicating a more disordered matrix on the surface.
| Sample | Path | CN | R (Å) | E 0 (eV) | R f |
|---|---|---|---|---|---|
| Estimated error: σ2Mo–S ± 0.002 Å2, σ2Mo–Mo ± 0.004 Å2. | |||||
| MoS2 | Mo–S | 6 | 2.413 | — | — |
| Mo–Mo | 6 | 3.166 | |||
| CAT-2.5 | Mo–S | 5.0 ± 0.1 | 2.408 ± 0.003 | 2.2 ± 0.6 | 0.0047 |
| Mo–Mo | 4.0 ± 0.3 | 3.164 ± 0.004 | |||
| CAT-3.0 | Mo–S | 5.0 ± 0.2 | 2.415 ± 0.004 | 2.7 ± 0.7 | 0.0053 |
| Mo–Mo | 4.7 ± 0.3 | 3.173 ± 0.004 | |||
| CAT-3.75 | Mo–S | 4.8 ± 0.2 | 2.406 ± 0.005 | 1.7 ± 0.9 | 0.0071 |
| Mo–Mo | 4.6 ± 0.4 | 3.171 ± 0.006 | |||
Characterization of the textural structure
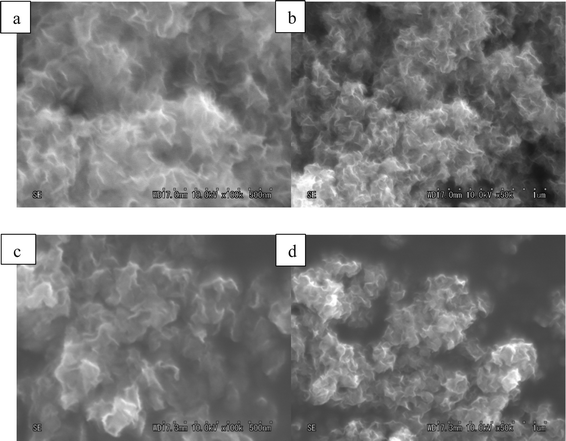
The morphologies of the three catalysts with different S/Mo molar ratios are revealed by TEM (Fig. 10). The dark thread-like lines shown in the fringes are the reflection of the (0 0 2) lattice plane of the crystalline MoS2, representing the stacked slabs. All the catalysts show dendritic morphologies and layered nanocrystallites. A large number of curved slabs are observed on the catalysts (circled in Fig. 10), which may result in more defects created on the basal plane.19 The three catalysts have similar size distributions. Table 3 shows narrow size ranges of 15.8–17.9 nm and 2.3–2.6 nm, for the average slab length and thickness, respectively. The average lengths obtained in the present work are similar to the catalysts which used (NH4)2MoS4 (ATM) as precursors,10,20 yet are significantly shorter than the crystallized MoS2 synthesized by Li et al. who reported 50 nm in length.7Fig. 11 shows FE-SEM images of MoS2. For both catalysts, thread-like MoS2 crystals are associated in bundles and twisted together forming a flower-like morphology. The images exhibit nanosized particles with an average size of 100–200 nm. Mesopores over 10 nm are formed in between the crystals, as shown in the grey part surrounded by the white MoS2 layers. A slight difference observed is that CAT-2.5 looks more dendritic, while the CAT-3.75 crystal favors growth on the boundary of particles.The three catalysts have a large surface area ranging from 200 to 262 m2 g−1 (Table 3). A high pore volume of 0.9 to 2.3 m3 g−1 is also observed, which is much higher than that of other catalysts previously reported.20
Catalytic activities
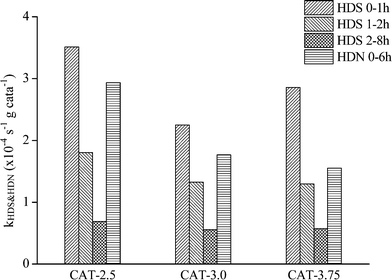
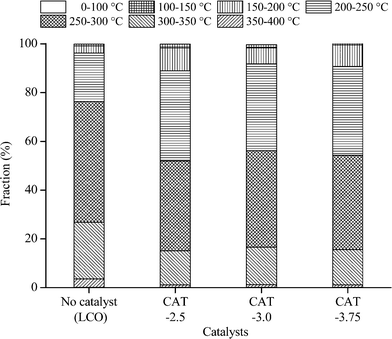
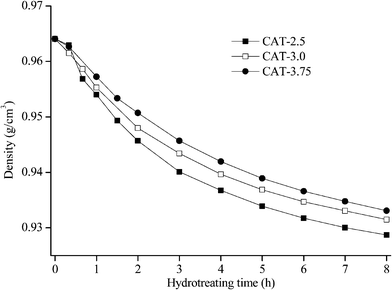
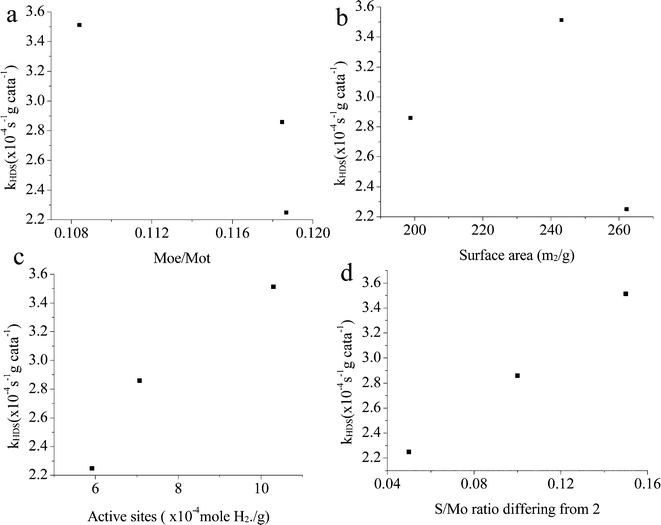
The catalysts synthesized under the hydrothermal method with Na2S and MoO3 as precursors are subjected to a performance test on HDS, HDN, and hydrocracking activities, using LCO (Fig. 12–14). The initial HDS rate constants in the first hour for all the catalysts are higher than 2 × 10⁻⁴ s−1 g cata−1. The rates drop by half in the second hour and a further 50% off was observed in the rest of the reaction. The decrease of the reaction rates for each catalyst along with the reaction time is due to the fact that LCO contains both easy (benzothiophene and its derivatives) and hard sulfur (dibenzothiophene and its derivatives) compounds (Table 5). Nevertheless, it is still observable that CAT-2.5 presents the highest HDS activity and CAT-3.0 has the lowest activity. CAT-3.75 positions in between. CAT-2.5 also exhibits the highest HDN (Fig. 12) and hydrocracking (seen from the product density in Fig. 14) abilities.The relationship between the properties and activities is plotted in Fig. 15. The ratio of Mo atoms on the edge to the total Mo atoms is calculated based on the slab length, same as the method reported by Vrinat et al.22 Apparently, if only Mo on the edges were active sites, the activity order would be totally opposite. It is indicated that the imperfect basal plane is important for the activities, and defects should also be largely located on the curved or twisted basal plane. This can be verified with the TEM images; all the catalysts show highly curved morphologies. In particular, CAT-2.5 exhibits more blurred slabs, indicating a more imperfect crystalline structure than the other two, which explains its highest activity among the three. There is also no clear relationship between the activity and the surface area (Fig. 15b). This statement has been mentioned by several researchers.21 A certain surface area is essential to provide more accessible active sites; however, the effect gets infinitesimal when a sufficient exposed area is provided. Most of the calculated area is inert to the reaction.
As discussed in the TPR, the hydrogen adsorbed is highly related to the active sites on the catalyst. In Fig. 15c, it's easy to see that there is a good linear relationship between the H2 adsorption sites (Table 6) and the HDS rate constant. The amount of active sites (as in H2 reacted sites) reflects the catalyst activities. A similar phenomenon also can be seen from the S/Mo atomic ratio macroscopically. The lack or excess of sulfur might be related to the deformation of the crystal structure and defects on the catalysts. When the S/Mo ratio is lower than the stoichiometric atom ratio of MoS2 (2), defect sites might be already generated due to the deficiency of S. On the other hand, over-stoichiometric sulfur may exist in the form of  species, which can react with H2 to form HS− species and enhance the hydrotreating reaction. As more defects are created during the synthesis, the MoS2 would deviate further from the perfect crystal, in other words, the S/Mo ratio would further deviate from the stoichiometric number 2. This is consistent with our results that MoS2 has the highest difference with the largest hydrogen adsorption sites. It also shows an excellent relationship between the difference and the activities, as in Fig. 15d.
| Catalysts | H2 | H2S | ||
|---|---|---|---|---|
| Amount (× 10−4 mol g−1 cata) | Peak temperature (°C) | Amount (× 10−4 mol g−1 cata) | Peak temperature (°C) | |
| CAT-2.5 | 10.3 | 296.2 | — | — |
| CAT-3.0 | 5.9 | 291.9 | 3.6 | 294.3 |
| CAT-3.75 | 7.1 | 264.1 | 4.3 | 269.5 |
A relationship can also be seen from the binding energy, coordination, disorder and activities. Although the difference is not obvious, it's also found that the binding energy and the MoS2 cluster size (reflected by the Mo–Mo coordination number) show a similar trend in HDS activity.
Conclusions
Novel nanocrystalline MoS2 were successfully synthesized via a hydrothermal method using commercially available MoO3 and Na2S. The synthesis mechanism of the hydrothermal approach was investigated and the reaction pathways were proposed for the formation of crystalline MoS2. [HS−] in the synthesis solution is identified as a key factor. Insufficient [HS−] can lead to failure of the synthesis. A mild acidic medium is essential for a successful synthesis. The ratio of reactants, MoO3 and Na2S, is important to the nanocrystal structure and the yield. An excessive MoO3/Na2S ratio may result in poor uniformity of MoS2. Various characterization techniques are employed to assess the structure of the synthesized catalysts. The three catalysts synthesized at the proper range of Na2S/MoO3 (from 2.5 to 3.75 in this work) have a nanosized structure, large surface area, and high pore volume (mesopores). More defects at the rims are found on the CAT-2.5 than the other two catalysts. The HDS activity of hydrotreating LCO also exhibits a decreasing order of CAT-2.5 > CAT-3.75 > CAT-3.0.Acknowledgements
The authors gratefully acknowledge the financial assistance from the Canada Research Chairs program, the Natural Sciences and Engineering Research Council of Canada and the Canada Foundation for Innovation.References
- R. Tenne, Angew. Chem., Int. Ed., 2003, 42, 5124–5132 CrossRef CAS PubMed.
- R. Tenne, Nat. Nanotechnol., 2006, 1, 103–111 CrossRef CAS PubMed.
- X. Hu, W. Zhang, X. Liu, Y. Mei and Y. Huang, Chem. Soc. Rev., 2015, 44, 2376–2404 RSC.
- X. H. Zhang, H. Tang, M. Q. Xue and C. S. Li, Mater. Lett., 2014, 130, 83–86 CrossRef CAS.
- Y. Araki, Y. Iwata, Y. Miki, K. Honna, N. Matsubayashi and H. Shimada, in Hydrotreatment and Hydrocracking of Oil Fractions, ed. B. Delmon, G. F. Froment and P. Grange, Elsevier Science B.V., The Netherlands, 1999, pp. 69–76 Search PubMed.
- H. Zhang, H. Lin, Y. Zheng, Y. Hu and A. MacLennan, Appl. Catal., B, 2015, 165, 537–546 CrossRef CAS.
- W. J. Li, E. W. Shi, J. M. Ko, Z. Z. Chen, H. Ogino and T. Fukuda, J. Cryst. Growth, 2003, 250, 418–422 CrossRef CAS.
- Y. Tian, Y. He, J. Shang and Y. F. Zhu, Chin. J. Chem., 2004, 62, 1807–1810 CAS.
- C. Calais, N. Matsubayashi, C. Geantet, Y. Yoshimura, H. Shimada, A. Nishijima, M. Lacroix and M. Breysse, J. Catal., 1998, 174, 130–141 CrossRef CAS.
- B. Yoosuk, J. H. Kim, C. Song, C. Ngamcharussrivichai and P. Prasassarakich, Catal. Today, 2008, 130, 14–23 CrossRef CAS.
- V. R. Surisetty, Y. F. Hu, A. K. Dalai and J. Kozinski, Appl. Catal., A, 2011, 392, 166–172 CrossRef CAS.
- N. Dinter, M. Rusanen, P. Raybaud, S. Kasztelan, P. da Silva and H. Toulhoat, J. Catal., 2009, 267, 67–77 CrossRef CAS.
- H. Aritani, T. Tanaka, T. Funabiki, S. Yoshida, K. Eda, N. Sotani, M. Kudo and S. Hasegawa, J. Phys. Chem., 1996, 100, 19495–19501 CrossRef CAS.
- H. Aritani, O. Fukud, A. Miyaji and S. Hasegawa, Appl. Surf. Sci., 2001, 180, 261–269 CrossRef CAS.
- Y. V. Zubavichus, A. S. Golub, Y. N. Novikov, Y. L. Slovokhotov, A. N. Nesmeyanov, P. J. Schilling and R. C. Tittsworth, J. Phys. IV, 1997, 7, 1057–1059 CrossRef CAS.
- G. R. Mortimer, Physical Chemistry, Academic Press©, San Diego: Harcourt, 2nd edn, 2000 Search PubMed.
- R. S. Smart, W. M. Skinner and A. R. Gerson, Surf. Interface Anal., 1999, 28, 101–105 CrossRef CAS.
- X. S. Li, Q. Xin, X. X. Guo, P. Grange and B. Delmon, J. Catal., 1992, 137, 385–393 CrossRef CAS.
- A. K. Datye, S. Srinivasan, L. F. Allard, C. H. F. Peden, J. R. Brenner and L. T. Thompson, J. Catal., 1996, 158, 205–216 CrossRef CAS.
- E. Devers, P. Afanasiev, B. Jouguet and M. Vrinat, Catal. Lett., 2002, 82, 13–17 CrossRef CAS.
- G. Alonso, G. Berhault, A. Aguilar, V. Collins, C. Ornelas, S. Fuentes and R. R. Chianelli, J. Catal., 2002, 208, 359–369 CrossRef CAS.
- M. Vrinat, M. Breysse, C. Geantet, J. Ramirez and F. Massoth, Catal. Lett., 1994, 26, 25–35 CrossRef CAS.
| This journal is © The Royal Society of Chemistry 2016 |

