Application of online infrared spectroscopy to study the kinetics of precipitation polymerization of acrylic acid in supercritical carbon dioxide†
Jean-Noël
Ollagnier
ab,
Thierry
Tassaing
*c,
Simon
Harrisson
*a and
Mathias
Destarac
a
aLaboratoire des Interactions Moléculaires et Réactivité Chimique et Photochimique, CNRS UMR 5623, Université Toulouse III Paul Sabatier, 118 route de Narbonne 31062, Toulouse, France. E-mail: polyharrisson@gmail.com
bSEPPIC Castres, 127 chemin de la poudrerie 81105, Castres, France
cInstitut des Sciences Moléculaires, UMR CNRS 5255, Université de Bordeaux, 351 cours de la Libération 33405, Talence Cedex, France. E-mail: t.tassaing@ism.u-bordeaux1.fr
First published on 18th April 2016
Abstract
The kinetics of precipitation polymerization of acrylic acid (AA) in supercritical carbon dioxide (scCO2) has been studied using in situ reaction monitoring of the AA/scCO2 phase by Fourier transform infrared (FTIR) spectroscopy. A comparative in situ FTIR study has been performed in toluene. In both solvents, the polymerization kinetics display an induction period in which very little polymerization takes place followed by rapid onset of polymerization to reach a total conversion in about 70 min after the end of the induction period. The rate of polymerization displays an apparent 1.5-order dependence on the monomer concentration and a 0.5-order on the initiator concentration, which is consistent with a mechanism in which the main locus of polymerization is within the particles. The use of scCO2 allows the production of higher molecular weight polyacrylic acid powder than in toluene without any solvent residues.
Introduction
Poly(acrylic acid) (PAA) is used in many applications, including as a superabsorbent polymer for hygiene products and agriculture, as a scale inhibitor for water treatment and as a dispersant for paints and the paper industry. It is produced industrially on large scale by free-radical polymerization.1 Even though PAA may appear to be an ‘old’ and well-understood polymer, the free-radical polymerization of acrylic acid (AA) remains the subject of intense research activity with significant recent contributions on kinetics2,3 and modeling4 of AA polymerization, reversible deactivation radical polymerization,5 process intensification,6 characterization7 and nanocomposites.8The process for polymerizing AA can be either homogeneous (typically in aqueous solution) or heterogeneous. The heterogeneous polymerization of AA or its salts in organic media is a convenient way to prepare PAA nano- or microspheres at relatively high solid content with much better heat transfer and lower viscosity compared to solution polymerization. The reaction conditions (i.e. nature of initiator and continuous phase, degree of neutralization of AA, stabilizer) can be varied in order to meet the requirements for polymerizations in dispersion,9 inverse emulsion10 or inverse suspension.11
Although widely used, these processes sometimes require tedious desorption of the surfactant from the particles after polymerization and removal of traces of volatile organic compounds (VOCs) like residual monomer and solvent. These drawbacks can be circumvented with precipitation polymerization,12 which is a stabilizer-free process in which both initiator and monomer are soluble in the reaction medium while the polymer is insoluble and precipitates as it is formed. After filtration and washing of the polymer, this process usually allows the preparation of polymer powders of high purity for sensitive applications, e.g. cosmetics and food additives. The kinetics and mechanism of precipitation polymerization of AA in toluene have been studied in detail by several groups.13–16 The polymerization is characterized by an induction period in which very little polymerization takes place, followed by an accelerating reaction leading to complete polymerization in a relatively short time compared to a solution polymerization at comparable overall monomer concentration.17 Several kinetic models have been developed to explain these features, differing on whether polymerization is assumed to occur exclusively in the dispersed phase15,16 or in both the dispersed and continuous phases.13,14
More recently, supercritical carbon dioxide (scCO2) has shown great potential as a green solvent as its use can greatly reduce the production of toxic and environmentally damaging waste. Indeed, carbon dioxide is a readily available, inexpensive, nontoxic and nonflammable natural product with easily accessible critical coordinates (Tc = 31.1 °C and Pc = 7.4 MPa). In this context, heterogeneous controlled/living radical polymerizations in scCO2 have been developed over the past decade.18–20 Supercritical CO2 is a good solvent for AA at relatively mild temperature and pressure, and is inert to radical reactions such as chain transfer, making it a solvent of choice for the precipitation polymerization of AA.21–23 Its lack of toxicity and ease of removal by depressurizing the reactor are strong advantages over traditional solvents. During the 2000s, several groups studied the effect of various parameters such as the presence of a co-solvent24 or a crosslinker,22 or the use of a continuous stirred tank reactor (CSTR)21 for the precipitation polymerization of AA in scCO2. A kinetic and model study showed that polymerization in the CSTR occurred primarily in or on the polymer particles, with negligible contribution from polymerization in the continuous phase.23
While the precipitation polymerization of AA in supercritical CO2 has previously been investigated, a detailed study of its kinetics is still lacking. This prompted us to monitor the kinetics of the precipitation polymerization of AA in scCO2 using in situ reaction monitoring of the AA/scCO2 phase by Fourier transform infrared spectroscopy (in situ FTIR).
The in situ FTIR approach allows the monomer concentration and the overall monomer conversion to be determined at any point during the polymerization. It is particularly suited to reactions in scCO2 because it is otherwise difficult to sample the reaction mixture without changing the reaction conditions (pressure/concentration). Although this method has been applied to the online kinetic monitoring of homogeneous polymerizations in scCO2,25–29 it has never been reported to the best of our knowledge for a precipitation polymerization.
Thus, the aim of this study is to investigate the impact of initiator and monomer concentrations on the kinetics of polymerization and the molar mass, dispersity, and particle morphology of the resulting polymer. The in situ FTIR technique was validated by an initial study in toluene, then applied to the precipitation polymerization of acrylic acid in scCO2.
Materials and methods
Materials
Acrylic acid (97%) containing 200 ppm of inhibitor (monomethyl ether of hydroquinone (MEHQ)), was provided by SEPPIC and used without prior purification. 2,2-Azobisisobutyronitrile (AIBN) was obtained from Sigma-Aldrich and recrystallized twice from methanol before use. Carbon dioxide with a purity of 99.95% was purchased from Air Liquide and used as received. Toluene (CHROMASOLV Plus, >99.9%) was obtained from Sigma Aldrich and used as received.Infrared
Infrared absorption measurements were performed on a ThermoOptek Nicolet 6700 FTIR spectrometer equipped with a globar as the infrared source, a KBr/Ge beamsplitter and a DTGS (deuterated triglycine sulphate) detector in order to investigate the spectral range of 400–7500 cm−1. Single beam spectra recorded with 2 cm−1 resolution were obtained after the Fourier transformation of 32 accumulated interferograms.Kinetic monitoring in toluene solution
The infrared kinetic monitoring of the polymerization of AA in toluene was performed using the ThermoOptek Nicolet 6700 FTIR spectrometer described above coupled with a variable temperature ATR (attenuated total reflectance) ‘Golden Gate’ accessory from Specac Ltd. This device has been modified by the addition of a stainless steel cell above the diamond crystal that allows measurements on liquids in a closed vessel (volume of 3.2 mL) that can be introduced through the upper port (see ESI† Fig. S1). The cell and the ‘Golden Gate’ accessory are sealed with a gasket in graphite. A magnetically driven stirrer in this cell constantly homogenizes the medium during the experiment. The device is equipped with cartridge heaters and a temperature controller to perform measurements from ambient temperature up to 300 °C. In a typical experiment, the monomer and AIBN were degassed under Ar for 10 min, then placed directly onto the ATR crystal. The cell was closed and an additional 5 min degassing was carried out by controlled injection of Ar via a capillary that was connected to the inlet port. The measuring cell was then heated to the desired temperature. IR spectra were recorded every 3 min in the spectral range 400–4000 cm−1 until total disappearance of the band from AA at 1640 cm−1 was observed.Kinetic monitoring in scCO2
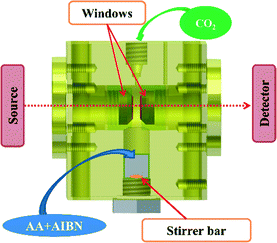
Infrared kinetic monitoring of the polymerization of AA in scCO2 was performed using an in-house built stainless steel cell30 equipped with two cylindrical silicon windows and a variable path length which enabled the IR beam to traverse the supercritical phase and provide a quantitative analysis of the reaction medium in the frequency range of 1000–7500 cm−1 (Fig. 1). The cell was configured with a path length of 1 mm and a volume of 4.7 mL. Flat Kapton® rings of 100 μm thickness were used to ensure the seal between the plug and the windows and between the plug and the cell body. The lower part of the reactor was fitted with a small tank containing a magnetically driven stirrer in order to constantly homogenize the medium during the experiment. The cell was heated using cartridge heaters disposed in the walls of the cell. Two thermocouples were used, one close to a cartridge heater for temperature regulation, and the other close to the sample to measure the sample temperature with a standard uncertainty u(T) = 1 K. The cell was connected via a stainless steel capillary tube to a manual pump (TOP Industrie) which allows the pressure to be raised to 50 MPa with a standard uncertainty u(P) = 0.1 MPa. This set-up allows online monitoring of the polymerization from room temperature up to 200 °C and up to 35 MPa of pressure.A typical polymerization is carried out according to the following experimental protocol: in a 5 mL flask, the AA monomer is degassed under Ar for 15 minutes. During this time the initiator is loaded into the lower part of the reactor. Then, a given quantity of monomer is introduced by syringe under a gentle stream of CO2. An additional degassing with Ar is then carried out in the reactor under stirring for 5 minutes. The pressure is then increased to 6 MPa by introduction of CO2. The temperature and pressure are then adjusted to the desired levels. A first spectrum was recorded immediately after the desired pressure was reached. Further spectra were recorded every 3 min until total disappearance of the band from AA at 1950 cm−1. The temperature was then lowered to room temperature and the pressure decreased gradually to atmospheric pressure. The obtained polymer is a white powder that could be analyzed without further purification.
Size exclusion chromatography
Size exclusion chromatography (SEC) was carried out on a Agilent 1100 HPLC system including a vacuum degasser and an isocratic pump monitored by an eclipse 2 system (Wyatt technonology), a guard column Shodex SB807-G and two columns Shodex OHpak (SB-807 HQ (8 mm × 300 mm, 35 μm)) in series coupled with a Shodex RI-101 differential refractometer thermostated at 25 °C and a multi-angle laser light scattering detector (Dawn HELEOS® II, 18 angles, Wyatt technology). An aqueous solution of 0.1 M NaCl and 0.5 M of phosphate buffer (0.25 M NaH2PO4 + 0.25 M Na2HPO4) containing 100 ppm of NaN3 was used as the eluent at a flow rate of 1 mL min−1. Prior to injection, samples were diluted to 0.5 mg mL−1, stirred for 24 h and filtered through 0.45 μm nylon filters. The incremental refractive index (dn/dc) of a high Mw PAA sample (Mw ∼ 106 g mol−1) was measured in the eluent using a PSS DnDc-2010 refractometer thermostated at 25 °C, at a wavelength of 620 nm. dn/dc (PAA) = 0.185 mL g−1.Scanning electron microscopy
The shape and surface morphology of the PAA particles was observed by scanning electron microscopy (SEM) with a MEB Quanta 250 FEG FEI microscope. The electron beam was produced with Schottky type field emission gun. The sample was analyzed under vacuum at 10−4 Pa. The electrons are emitted from a thermionic cathode. The information on PAA powder surfaces was obtained from secondary electron analysis. A SDD/Bruker 30 mm2 detector was used to observe the morphology of PAA particles. Prior to scanning, the samples were coated with a 3 nm layer of platinum deposited with a vacuum metallizer.Results and discussion
Online monitoring in toluene
We first performed online ATR-FTIR monitoring of the precipitation polymerization of AA in toluene at 62 °C with initial monomer concentrations [M]0 of 0.58–1.71 M and a constant concentration of AIBN ([AIBN]0) of 6.38 mM. The conditions of polymerization are compiled in Table S1 of the ESI.†The concentration of acrylic acid at time t, [AA]t, was calculated by following the evolution with time of the signal at 1639 cm−1 that is associated to the ν(C![[double bond, length as m-dash]](https://www.rsc.org/images/entities/char_e001.gif) C) stretching mode of AA. According to the Beer–Lambert law, A0 = ε1639·L·[AA]0 and At = ε1639·L·[AA]t where A0 and At are the absorbances of the peak at 1639 cm−1 at time 0 and time t, respectively, ε1639, the molar extinction coefficient at 1639 cm−1 and L, the optical path length. Combining these two equations, the concentration of AA during the reaction is given by eqn (1):
C) stretching mode of AA. According to the Beer–Lambert law, A0 = ε1639·L·[AA]0 and At = ε1639·L·[AA]t where A0 and At are the absorbances of the peak at 1639 cm−1 at time 0 and time t, respectively, ε1639, the molar extinction coefficient at 1639 cm−1 and L, the optical path length. Combining these two equations, the concentration of AA during the reaction is given by eqn (1):
| [AA]t = (At/A0) × [AA]0 | (1) |
The conversion, X, was calculated from eqn (2):
 | (2) |
Fig. 2 shows the time dependence of the conversion of AA.
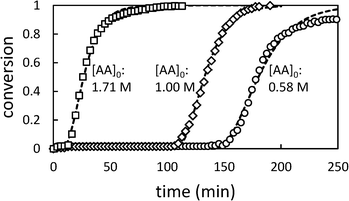 | ||
| Fig. 2 Conversion profiles for precipitation polymerization of acrylic acid in toluene showing effect of changing initial [AA] ([AIBN]0 = 6.38 mM). Dashed lines represent best fit to Barrett and Thomas' model.17 | ||
Whatever the initial concentration of AA, we observe an induction period where there is very little conversion of AA followed by rapid onset of polymerization. Total conversion is reached in about 70 min after the end of the induction period.
These characteristics are typical of precipitation and dispersion polymerizations, in which, although the monomer and initiator are soluble in the continuous phase, most polymerization takes place in the dispersed phase.14–17 The induction period corresponds to an initial period of slow polymerization in the continuous phase and particle nucleation. When a critical volume of particles has been generated, they become swollen with monomer and the polymerization accelerates.
In the later stages of the reaction, the rate of polymerization decreases as the monomer is depleted. Longer induction periods are observed at low initial [AA] because under these conditions it takes longer to produce the critical volume of particles required for the onset of autoacceleration. The maximum rate of change in conversion (dX/dt)max shows a slight dependence on [AA]0. In previous studies of precipitation polymerization, the observed dependence of dX/dt on [AA]0 has ranged from zero-order31 to 0.7-order.14 Similar dependence on [AA]0 has been observed in solution polymerizations, which has been ascribed to monomer-enhanced decomposition of the initiator.3 Additionally the rate constant of propagation of AA in water varies with [AA]0, and is significantly lower at 50% AA than at 10% AA.2
Online monitoring in scCO2
We then used in situ FTIR to investigate the influence of the initial AIBN and monomer concentrations on the kinetics of the precipitation polymerization of AA in scCO2. An FTIR spectrum recorded at T = 62 °C, P = 160 bar, [M]0 = 0.128 M and [AIBN]0 = 6.38 mM is shown in Fig. 3. Using a path length of 1 mm to ensure a good homogenization of the mixture, we observe that the main peaks associated with scCO2 at about 3600 cm−1 and 2300 cm−1 are saturated. While some peaks associated with AA are also saturated (for example the ν(C![[double bond, length as m-dash]](https://www.rsc.org/images/entities/char_e001.gif) O) stretching vibration at 1720 cm−1), we observed AA peaks at 1620, 1639, 1950 and 2664 cm−1 with a good signal to noise ratio that we can use to quantify the monomer concentration during the polymerization (see ESI† 2). At [AA] > 0.128 M, the peaks at 1620, 1639 and 2664 cm−1 also became saturated. Therefore, we monitored the disappearance of the peak at 1950 cm−1 (see Fig. S3 of the ESI†).
O) stretching vibration at 1720 cm−1), we observed AA peaks at 1620, 1639, 1950 and 2664 cm−1 with a good signal to noise ratio that we can use to quantify the monomer concentration during the polymerization (see ESI† 2). At [AA] > 0.128 M, the peaks at 1620, 1639 and 2664 cm−1 also became saturated. Therefore, we monitored the disappearance of the peak at 1950 cm−1 (see Fig. S3 of the ESI†).
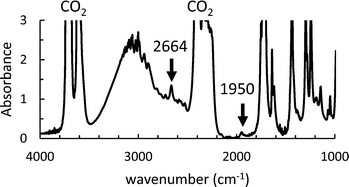 | ||
| Fig. 3 Initial FTIR spectrum of AA in scCO2 at T = 62 °C, P = 160 bar [M]0 = 0.128 M and [AIBN]0 = 6.38 mM. | ||
The peak at 1950 cm−1 was used to check the initial concentration of AA in order to limit systematic errors due to the loss of a small amount of AA during the degassing of the cell with CO2. The extinction coefficient, ε1950 was determined from an average of four FTIR spectra measured with the same cell at [AA] of 0.73 M. The concentration of the AA monomer during the reaction and the conversion were calculated from eqn (1) and (2), as for the polymerizations in toluene. The conditions of polymerization are compiled in Table S1 of the ESI.†
Fig. 4 shows the effect of changing the initial [AA] on the polymerization kinetics. As in toluene, the polymerization kinetics are characterized by an induction period during which very little polymerization occurs, followed by rapid onset of polymerization. Lower initial [AA] is associated with longer induction periods and a slightly slower rate of change of conversion (dX/dt).
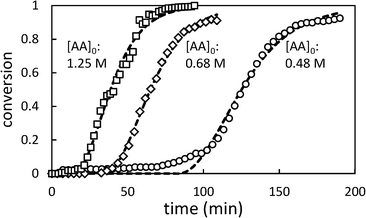 | ||
| Fig. 4 Selected conversion profiles for precipitation polymerization of acrylic acid in scCO2 showing effect of changing initial [AA] (initial [AIBN] = 6.4 mM). Dashed lines represent best fit to Barrett and Thomas' model.17 | ||
In Fig. 5, the effect of changing initiator concentration is shown. As for [AA]0, reducing the initiator concentration results in longer induction periods and slower polymerizations.
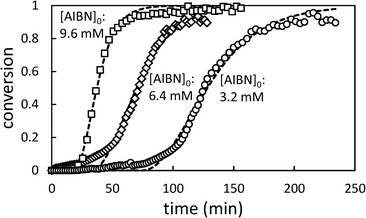 | ||
| Fig. 5 Conversion profiles for precipitation polymerization of acrylic acid in scCO2 showing effect of changing initial [AIBN] (initial [AA] = 0.71 M). Dashed lines represent best fit to Barrett and Thomas' model.17 | ||
Model fitting
Conversion vs. time data were fitted to the model developed by Barrett and Thomas,17 in which all polymerization is assumed to occur within the growing particles. This leads to the following expression for the rate of change of conversion with time (eqn (3)): | (3) |
In eqn (3), the coefficient k is a composite of numerous rate constants and reagent concentrations (eqn (4)):
 | (4) |
In eqn (4), kp, kt and ki represent the rate constants of propagation, termination and initiation, respectively; [M]0 and [I] represent the initial concentration of monomer and the concentration of initiator (assumed to be constant throughout the reaction); Vp is the molar volume of the polymer; and α is the partition coefficient of the monomer between the continuous and dispersed phases.
Solution of eqn (3) leads to the following expression for conversion as a function of time (eqn (5)):
 | (5) |
This equation results in a sigmoidal conversion vs. time curve, displaying the induction period, t0, and auto-acceleration that is characteristic of precipitation and dispersion polymerizations.
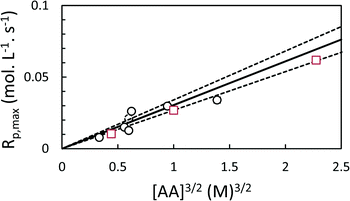
The maximum rate of polymerization, Rp,max, occurs at a conversion of 1/3, and is given by eqn (6):
 | (6) |
As the coefficient k is proportional to [M]0.5 and [I]0.5 (eqn (4)), Rp,max should be proportional to [M]1.5 and [I]0.5.
The coefficient k was evaluated for each polymerization individually by non-linear least squares (NLLS) fitting of eqn (5) to the experimental conversion data (Fig. 2, 4 and 5), and used to determine Rp,max. In general, the model successfully reproduced the major features of the polymerization, e.g. the induction period and the autoacceleration. During the induction period, however, low levels of conversion were observed experimentally which were not predicted by the model. This likely corresponds to polymerization in the continuous phase leading to the nucleation of new particles.
As expected, the maximum rates of polymerization in both toluene and scCO2 are proportional to [AA]1.5 (Fig. 6). The rates of polymerization in the two solvents are similar.
An average value of k = k′([M]0[I])0.5 was obtained by combining all the scCO2 data, and NLLS fitting to eqn (7). In this model, the induction period ti,0 was allowed to vary between experiments, while k′ was constant across all experiments.
 | (7) |
This procedure resulted in a value of  = 0.96 ± 0.11 M−1 min−1 for polymerizations of AA in scCO2. A similar procedure for the polymerizations in toluene resulted in a value of
  = 0.84 ± 0.14 M−1 min−1. The error reported is a conservative estimate, calculated by assuming that the errors in each experiment are highly correlated, and that each additional experiment adds only two degrees of freedom to the total. Good agreement was obtained between the experimental and modelled data, as shown in Fig. 7 (see also Fig. S4 and S5 of the ESI†).
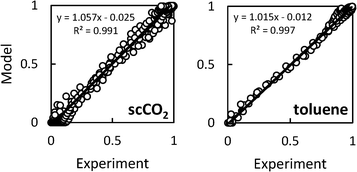 | ||
| Fig. 7 Agreement between modelled and experimental conversion data for precipitation polymerizations of acrylic acid in scCO2 (left) or toluene (right). | ||
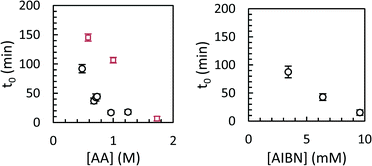
Modelled induction periods (ti,0 in eqn (7)) for toluene and scCO2 are shown in Fig. 8. In general, longer induction periods were observed in toluene than in scCO2, although the maximum rate of polymerization was similar in either solvent. The difference in induction period is presumably related to slower particle nucleation in toluene than in scCO2, either due to lower inherent solubility of poly(acrylic acid) in scCO2, or due to the lower molecular weight of the polymer formed in toluene. Differences in the initiator efficiency (f = 0.88 in scCO2, 0.55 in benzene, which should be similar to toluene) may also play a role, although this could be offset by slower decomposition of AIBN in scCO2.32
Characteristics of obtained poly(acrylic acid)s
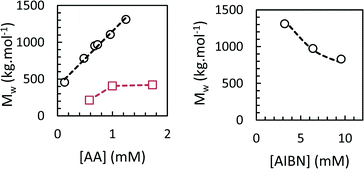
We studied the influence of process parameters on weight-average molar mass of the PAAs obtained at the end of the polymerization in scCO2 and toluene.The effects of initiator and monomer concentration were studied at 62 °C and 160 bar. The residual AA content at the end of the polymerization ranged from 2–7%. The results, reported in Fig. 9, show the dependence of Mw on [AA]0 and [AIBN]0, respectively. All the conversion and SEC data are collected in Table S1 in ESI.† When the polymerization was carried out in scCO2, Mw were high and reached 1.3 × 10⁶ g mol−1 for the lowest [AIBN]0 and the highest [AA]0. We found a square-root dependence of Mw on [AIBN] and a first-order dependence on [AA], in agreement with the theoretical expression for kinetic chain length in free-radical polymerization. Dispersities were 2.1–2.6, and Mn values followed a similar trend to Mw. Sample recovery values (i.e. the weight fraction of PAA sample which was eluted in the SEC line and detected by the refractometer) were inversely proportional to Mw and ranged from 48 to 82%. The low observed recovery is due to chain transfer to polymer, which results in the formation of a fraction of insoluble, crosslinked polymer that is lost during filtration of the SEC sample. Polymerizations in toluene led to PAAs with much lower Mw of 2–4 × 10⁵ g mol−1 (Fig. 9 and Table S1†), which can be explained by pronounced chain transfer to solvent.33
The size and morphology of the formed PAA particles were characterized by scanning electron microscopy (SEM). All the PAAs reported in this study formed a coagulum of fine particles of 50–200 nm in diameter (Fig. 10). This can be explained by the precipitation of high molecular weight chains which are in a solid, glassy state at a polymerization temperature well below the Tg of PAA.21
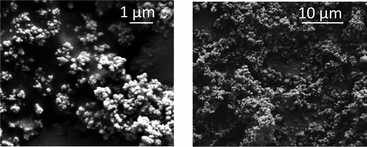 | ||
Fig. 10 SEM of PAA particles obtained by precipitation polymerization in scCO2. Magnification of 17![[thin space (1/6-em)]](https://www.rsc.org/images/entities/char_2009.gif) 000 × (left) and 3000 × (right). T = 62 °C, P = 160 bar, [AIBN]0 = 6.38 mM, [AA]0 = 0.71 M. 000 × (left) and 3000 × (right). T = 62 °C, P = 160 bar, [AIBN]0 = 6.38 mM, [AA]0 = 0.71 M. | ||
Conclusions
This study shows that the kinetics of polymerization in toluene and scCO2 are consistent with a mechanism in which the main locus of polymerization is within the particles. This leads to characteristic polymerization kinetics showing an induction period in which very little polymerization takes place and an apparent dependence of the rate of polymerization on [AA]01.5 and [AIBN]0.5. The polymer molecular weight, meanwhile, is proportional to [AA]0 and [AIBN]−0.5, in line with expectation for a radical polymerization. The use of scCO2 allows the production of high molecular weight polyacrylic acid powder with minimal contamination by solvent or unreacted monomer.Acknowledgements
SEPPIC is gratefully acknowledged for financial support of this work.Notes and references
- F. L. Buchholz, in Ullman's Encyclopedia of Industrial Chemistry, ed. S. Hawkins and G. Schulz, VCH, Weinheim, 1992, vol. A21, p. 143 Search PubMed.
- J. Barth, W. Meiser and M. Buback, Macromolecules, 2012, 45, 1339–1345 CrossRef CAS.
- N. Lorber, B. Pavageau and E. Mignard, Macromolecules, 2010, 43, 5524–5529 CrossRef CAS.
- N. F. G. Wittenberg, C. Preusser, H. Kattner, M. Stach, I. Lacík, R. A. Hutchinson and M. Buback, Macromol. React. Eng., 2016, 10, 95–107 CrossRef CAS.
- I. Chaduc, A. Crepet, O. Boyron, B. Charleux, F. D'Agosto and M. Lansalot, Macromolecules, 2013, 46, 6013–6023 CrossRef CAS.
- N. Micic, A. Young, J. Rosselgong and C. Hornung, Processes, 2014, 2, 58 CrossRef CAS.
- I. Lacík, M. Stach, P. Kasák, V. Semak, L. Uhelská, A. Chovancová, G. Reinhold, P. Kilz, G. Delaittre, B. Charleux, I. Chaduc, F. D'Agosto, M. Lansalot, M. Gaborieau, P. Castignolles, R. G. Gilbert, Z. Szablan, C. Barner-Kowollik, P. Hesse and M. Buback, Macromol. Chem. Phys., 2015, 216, 23–37 CrossRef.
- J. M. Silva-Jara, R. Manríquez-González, F. A. López-Dellamary, J. E. Puig and S. M. Nuño-Donlucas, J. Macromol. Sci., Part A: Pure Appl. Chem., 2015, 52, 732–744 CrossRef CAS.
- H. Minami, A. Kimura, K. Kinoshita and M. Okubo, Langmuir, 2010, 26, 6303–6307 CrossRef CAS PubMed.
- J. F. Ge, F. J. Lu and W. Ding, Chin. Chem. Lett., 2002, 13, 993–996 CAS.
- B. Renard and T. F. McKenna, Macromol. Symp., 2000, 150, 251–257 CrossRef CAS.
- D. Zhang and X. Yang, in Encyclopedia of Polymeric Nanomaterials, ed. S. Kobayashi and K. Müllen, Springer Verlag, Berlin Heidelberg, 2014, pp. 1–10 Search PubMed.
- C. Bunyakan, L. Armanet and D. Hunkeler, Polymer, 1999, 40, 6225–6234 CrossRef CAS.
- C. Bunyakan and D. Hunkeler, Polymer, 1999, 40, 6213–6224 CrossRef CAS.
- H.-G. Poersch-Panke, A. Avela and K.-H. Reichert, Angew. Makromol. Chem., 1993, 206, 157–169 CrossRef CAS.
- A. Avela, H.-G. Poersch and K.-H. Reichert, Angew. Makromol. Chem., 1990, 175, 107–116 CrossRef CAS.
- K. E. J. Barrett and H. R. Thomas, J. Polym. Sci., Part A-1: Polym. Chem., 1969, 7, 2621–2650 CrossRef CAS.
- H. Lee, E. Terry, M. Zong, N. Arrowsmith, S. Perrier, K. J. Thurecht and S. M. Howdle, J. Am. Chem. Soc., 2008, 130, 12242–12243 CrossRef CAS PubMed.
- C. Boyère, C. Jérôme and A. Debuigne, Eur. Polym. J., 2014, 61, 45–63 CrossRef.
- G. Hawkins, P. B. Zetterlund and F. Aldabbagh, J. Polym. Sci., Part A: Polym. Chem., 2015, 53, 2351–2356 CrossRef CAS.
- T. Liu, J. M. DeSimone and G. W. Roberts, J. Polym. Sci., Part A: Polym. Chem., 2005, 43, 2546–2555 CrossRef CAS.
- T. Liu, J. M. DeSimone and G. W. Roberts, Polymer, 2006, 47, 4276–4281 CrossRef CAS.
- T. Liu, J. M. DeSimone and G. W. Roberts, Chem. Eng. Sci., 2006, 61, 3129–3139 CrossRef CAS.
- Q. Xu, B. Han and H. Yan, Polymer, 2001, 42, 1369–1373 CrossRef CAS.
- M. Buback, Angew. Chem., Int. Ed. Engl., 1991, 30, 641–653 CrossRef.
- S. Beuermann, M. Buback, C. Isemer and A. Wahl, Macromol. Rapid Commun., 1999, 20, 26–32 CrossRef CAS.
- S. Beuermann, M. Buback, C. Schmaltz and F.-D. Kuchta, Macromol. Chem. Phys., 1998, 199, 1209 CrossRef CAS.
- P. Chambon, E. Cloutet, H. Cramail, T. Tassaing and M. Besnard, Polymer, 2005, 46, 1057–1066 CrossRef CAS.
- S. Beuermann, M. Buback and M. Jürgens, Ind. Eng. Chem. Res., 2003, 42, 6338–6342 CrossRef CAS.
- V. Martinez, S. Mecking, T. Tassaing, M. Besnard, S. Moisan, F. Cansell and C. Aymonier, Macromolecules, 2006, 39, 3978–3979 CrossRef CAS.
- M. K. Mishra and S. N. Bhadani, J. Macromol. Sci., Chem., 1985, 22, 235–242 CrossRef.
- Z. Guan, J. R. Combes, Y. Z. Menceloglu and J. M. DeSimone, Macromolecules, 1993, 26, 2663–2669 CrossRef CAS.
- T. J. Romack, E. E. Maury and J. M. DeSimone, Macromolecules, 1995, 28, 912–915 CrossRef CAS.
Footnote |
| † Electronic supplementary information (ESI) available: ATR-IR device for the online monitoring of polymerization, characteristic absorption bands of AA, combined fits to polymerization in toluene and scCO2, SEC results. See DOI: 10.1039/c6re00022c |
| This journal is © The Royal Society of Chemistry 2016 |

