 Open Access Article
Creative Commons Attribution 3.0 Unported Licence
Cooperative supramolecular polymerization of an amine-substituted naphthalene-diimide and its impact on excited state photophysical properties†
Haridas
Kar
a,
Dominik W.
Gehrig
b,
Naveen Kumar
Allampally
c,
Gustavo
Fernández
*c,
Frédéric
Laquai
*b and
Suhrit
Ghosh
*a
aPolymer Science Unit, Indian Association for the Cultivation of Science, 2A & 2B Raja S. C. Mullick Road, Kolkata-700032, India. E-mail: psusg2@iacs.res.in
bMax Planck Research Group for Organic Optoelectronics, Max Planck Institute for Polymer Research, Ackermannweg 10, D-55128 Mainz, Germany
cInstitut für Organische Chemie and Center for Nanosystems Chemistry, Universität Würzburg, Am Hubland, 97074 Würzburg, Germany
First published on 30th October 2015
Abstract
A donor–acceptor–donor (D–A–D) type naphthalene-diimide (NDI-H) chromophore exhibits highly cooperative J-aggregation leading to nanotubular self-assembly and gelation in n-decane, as demonstrated by UV/Vis, FT-IR, photoluminescence and microscopy studies. Analysis of temperature-dependent UV/Vis spectra using the nucleation–elongation model and FT-IR data reveals the molecular origin of the cooperative nature of the self-assembly. The supramolecular polymerization is initiated by H-bonding up to a degree of polymerization ∼20–25, which in a subsequent elongation step promotes J-aggregation in orthogonal direction leading to possibly a sheet-like structure that eventually produces nanotubes. Time-resolved fluorescence and absorption measurements demonstrate that such a tubular assembly enables very effective delocalization of excited states resulting in a remarkably prolonged excited state lifetime.
Introduction
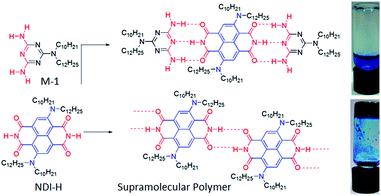
Self-assembled π-conjugated small molecules have found widespread interest owing to their diverse photophysical and transport properties.1 Supramolecular polymerization2 of such π-conjugated monomers3 could be promising to make them more relevant in miniaturized organic device applications as on the one hand it offers the structural precision of oligomers, while at the same time includes features of polymers such as phase separation, film formation and others. Core-substituted naphthalene-diimides (cNDIs),4 owing to their wide range of light absorption, fluorescence and electrochemical properties, have been extensively studied5 in the context of organic solar cells, field effect transistors, photo-induced electron transport, bio-sensing, anion binding, transport and catalysis. However, there is no report on supramolecular polymerization of any cNDI and in fact only a few reports describe their non-covalent assembly.6 Herein we reveal for the first time H-bonding-initiated supramolecular polymerization of a diamino-substituted cNDI4 (NDI-H, Scheme 1, for synthesis see ESI†), the thermodynamic aspects, molecular origin of its cooperative nanotubular self-assembly and pronounced effects on the dynamics of the charge-separated state.Results and discussion
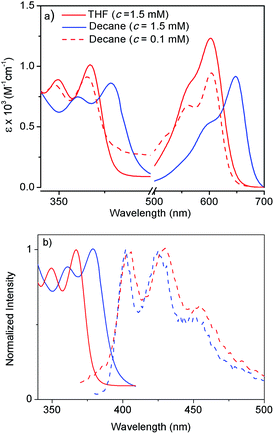
NDI-H was synthesized (Scheme S1†) from commercially available naphthalene-tetracarboxylic-acid-dianhydride and isolated in pure form with an overall yield of 19%. It contains two electron donating amine functionalities in the electron deficient ring, free NH groups for extended H-bonding driven supramolecular polymerization and the branched alkyl chains to provide solubility in less polarizable organic solvents where H-bonding can be prominent. Its absorption spectrum in THF (Fig. 2a) exhibits sharp absorption bands with vibronic features in the region of 300–450 nm owing to π–π* transitions along with an intense band around 500–600 nm originating from the intra-molecular charge transfer (ICT) according to literature precedence. This is more evident from the redox potentials of NDI-H as shown by cyclic voltammetry (Fig. S1†). It reveals two reversible reductions at −0.85 V and −1.06 V vs. Fc/Fc+ due to the formation of radical anions and dianions, respectively, suggesting that amine substitution slightly destabilizes the radical anions as the values are shifted towards a more negative region compared to the ring-unsubstituted NDIs. However, interestingly, now radical cation formation is also apparent as evidenced by two reversible oxidation waves at +1.02 V and +1.28 V. This unique feature of cNDIs makes them comparable to chlorophylls. Based on these data, the HOMO and LUMO energy levels can be estimated to be −5.43 eV (reference: −5.1 eV for Fc) and −3.56 eV, respectively, suggesting increases in both energy levels compared to unsubstituted NDI as also reported earlier.4The supramolecular polymerization of NDI-H (Scheme 1) was examined in a few organic solvents (Table S1†) and gelation was observed in n-decane (Scheme 1). The lack of gelation in the presence of M-1 (Scheme 1), having a DAD type complementary H-bonding motif, suggests that supramolecular polymerization by extended H-bonded chain formation among the imide groups of the NDI-H is crucial for the observed gelation to occur.
Atomic force microscopy (AFM) images (Fig. 1a and S2†) show one-dimensional few-micrometer long structures7 with widths in the range of 100–150 nm. High resolution transmission electron microscopy (HRTEM) images of a diluted gel reveal nanotubular structures8 (Fig. 1b and c and S3†) with diameters and lengths of 81 ± 6 nm and >5.0 μm respectively, and thus complement the AFM images. UV/Vis absorption spectra of NDI-H show pronounced solvent effects. While in THF it exhibits monomeric features, in n-decane a pronounced bathochromic shift of ca. 12–13 nm is noticed (Fig. 2a) for the π–π* bands indicating J-aggregation.9 The ICT-band shows an even more pronounced bathochromic shift of ∼50 nm indicating a reduction of the HOMO–LUMO energy gap due to effective delocalization of the CT-state in J-aggregation. Interestingly, the spectrum (Fig. 2a) of NDI-H in decane below a critical aggregation concentration (CAC) is similar to that of the polymer in THF, indicating that the observed changes are indeed related to aggregation and not mere solvatochromism.
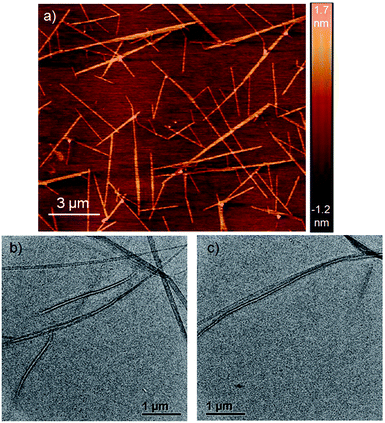 | ||
| Fig. 1 (a) AFM images of a diluted NDI-H gel on a mica surface. (b and c) HRTEM images of NDI-H nanotubes in n-decane on a carbon-coated copper grid. | ||
UV/Vis studies in a few other nonpolar organic solvents (Fig. S4a†) reveal J-aggregation only in aliphatic hydrocarbons. In highly polar media (1![[thin space (1/6-em)]](https://www.rsc.org/images/entities/char_2009.gif) :
:![[thin space (1/6-em)]](https://www.rsc.org/images/entities/char_2009.gif) 1 THF/MeOH) the CT-band exhibits a bathochromic shift of ∼15 nm (Fig. S4b†) compared to aliphatic solvents due to the solvatochromic effect. Concentration-dependent absorption studies (Fig. S5†) indicate a CAC of ∼0.2 mM. Sharp emission bands are observed in n-decane (Fig. 2b) in conjunction with a very small Stokes shift (∼24 nm). The emission exhibits a mirror-image-like symmetry with the absorption confirming J-aggregation.
1 THF/MeOH) the CT-band exhibits a bathochromic shift of ∼15 nm (Fig. S4b†) compared to aliphatic solvents due to the solvatochromic effect. Concentration-dependent absorption studies (Fig. S5†) indicate a CAC of ∼0.2 mM. Sharp emission bands are observed in n-decane (Fig. 2b) in conjunction with a very small Stokes shift (∼24 nm). The emission exhibits a mirror-image-like symmetry with the absorption confirming J-aggregation.
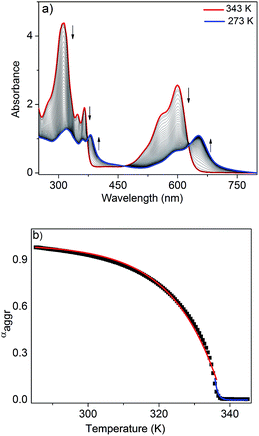
To further analyze the J-aggregation, temperature-dependent UV/Vis studies were carried out in n-decane at six different concentrations (0.6–1.75 mM). Fig. 3a shows the temperature-dependent UV/Vis spectra of NDI-H (c = 1.75 mM, cooling rate: 1 K min−1). At 343 K, NDI-H exhibits the characteristic absorption features of the monomeric species. Upon cooling, depletion of the absorption maxima at 312, 348, 365 and 599 nm occurs at the expense of new red shifted transitions at 318, 361, 381 and 652 nm that can be assigned to J-aggregation. The appearance of isosbestic points at 373, 468 and 627 nm is indicative of a thermodynamic equilibrium between monomeric and self-assembled species. When the fraction of aggregated species (αagg) at 599 nm (see ESI† for details) for all six concentrations were plotted against temperature, sharp non-sigmoidal curves were obtained (Fig. 3b and S6†) indicating cooperative self-assembly.10
To analyze the data, we have made use of both the nucleation–elongation model developed by ten Eikelder, Markvoort and Meijer (which assumes an initial dimerization process followed by a more favorable elongation step)11 as well as the model for thermally-activated equilibrium polymers described by van der Schoot.12 The latter distinguishes between a nucleation regime (characterized by a dimensionless equilibrium constant Ka that provides a measure of the degree of cooperativity) in which a monomeric activation step occurs, followed by a subsequent elongation step at lower temperatures (described by the elongation constant Ke). Both regimes are separated by the elongation temperature Te. Although both models yielded satisfactory fits (see ESI†), we found that the van der Schoot model describes the experimental data more accurately in the high-temperature nucleation regime at all six concentrations (Fig. 3b, S6 and S7†). The remarkably low values of Ka (6 × 10⁻⁵ to 1 × 10⁻⁴) (Table 1) reveal that the self-assembly of NDI-H occurs in a highly cooperative manner. The Te ranges from 321 to 336 K, whereas the binding constant associated to the elongation step (Ke) was calculated to be in the range of 0.57 to 1.7 × 10³ M−1 (Table 1). Interestingly, the model also yields an average degree of polymerization (N) of 20–25 at Te.
| Conc./M | N | ΔH°e/kJ mol−1 | K e/M−1 | T e/K | K a |
|---|---|---|---|---|---|
| 0.6 × 10⁻³ | 22 | −79.1 | 1.66 × 10³ | 321.9 | 9.3 × 10⁻⁵ |
| 0.8 × 10⁻³ | 21 | −73.7 | 1.25 × 10³ | 326.5 | 1.1 × 10⁻⁴ |
| 1.0 × 10⁻³ | 26 | −70.5 | 0.89 × 10³ | 328.1 | 5.6 × 10⁻⁵ |
| 1.25 × 10⁻³ | 24 | −70.6 | 0.79 × 10³ | 329.3 | 6.9 × 10⁻⁵ |
| 1.50 × 10⁻³ | 25 | −71.3 | 0.67 × 10³ | 336.0 | 5.9 × 10⁻⁵ |
| 1.75 × 10⁻³ | 25 | −79.9 | 0.57 × 10³ | 336.7 | 6.1 × 10⁻⁵ |
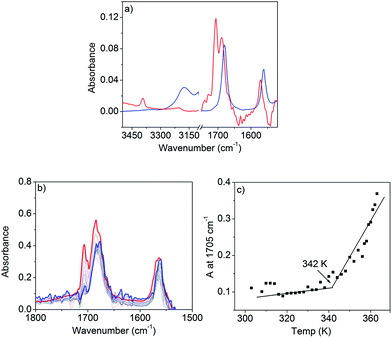
FT-IR studies in n-decane (c = 0.1 mM, below CAC) show sharp peaks (Fig. 4a) at 3390 and 1571 cm−1 for the stretching and bending vibrations of the N–H, respectively. Two other sharp bands at 1705 and 1688 cm−1 can be assigned to the asymmetric and symmetric stretching vibrations of the C![[double bond, length as m-dash]](https://www.rsc.org/images/entities/char_e001.gif) O of the imide group.
O of the imide group.
Above CAC (1.5 mM), the NH stretching band appears at a lower frequency (3170 cm−1) and the NH bending peak shifts to 1560 cm−1 supporting H-bond formation. Similarly, the C![[double bond, length as m-dash]](https://www.rsc.org/images/entities/char_e001.gif) O bands shift towards a lower frequency and appear as a single peak at 1678 cm−1 suggesting that asymmetric stretching becomes IR inactive in the aggregated state. The spectrum at lower concentrations appears similar (Fig. S8†) to that in THF or CHCl3 confirming that the spectral shift above CAC is due to H-bonding. Variable temperature (363 K to 303 K) FT-IR studies (Fig. 4b) in n-decane (c = 1.5 mM) show a gradual transformation of the monomeric spectrum to an aggregated spectrum as the two sharp peaks (C
O bands shift towards a lower frequency and appear as a single peak at 1678 cm−1 suggesting that asymmetric stretching becomes IR inactive in the aggregated state. The spectrum at lower concentrations appears similar (Fig. S8†) to that in THF or CHCl3 confirming that the spectral shift above CAC is due to H-bonding. Variable temperature (363 K to 303 K) FT-IR studies (Fig. 4b) in n-decane (c = 1.5 mM) show a gradual transformation of the monomeric spectrum to an aggregated spectrum as the two sharp peaks (C![[double bond, length as m-dash]](https://www.rsc.org/images/entities/char_e001.gif) O stretching) converge to one broad peak at lower temperatures. A plot of the peak intensity at 1705 cm−1 with temperature (Fig. 4c) shows an inflection point at ∼342 K indicating that the H-bonding is almost saturated. UV/Vis studies show (Fig. 3b) the onset of a π–π interaction at around the same temperature and thus suggest the π-stacking to be a consequence of H-bonding, therefore explaining the origin of the cooperativity.
O stretching) converge to one broad peak at lower temperatures. A plot of the peak intensity at 1705 cm−1 with temperature (Fig. 4c) shows an inflection point at ∼342 K indicating that the H-bonding is almost saturated. UV/Vis studies show (Fig. 3b) the onset of a π–π interaction at around the same temperature and thus suggest the π-stacking to be a consequence of H-bonding, therefore explaining the origin of the cooperativity.
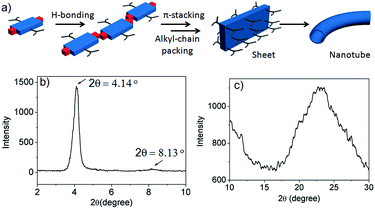
Thus we propose (Fig. 5a) that NDI-H initially undergoes a linear oligomerization by H-bonding.3 When the length of the oligomer becomes sufficiently large (N at Te ∼ 20–25, as revealed by the nucleation–elongation model), J-aggregation and alkyl-chain packing come to the fore, leading to the formation of a 2D sheet that eventually bends to generate nanotubes. However, the proposed structures for the intermediates of the self-assembly pathway could not be fully elucidated by experimental data. The small angle powder X-ray diffraction (XRD) pattern shows (Fig. 5b) a sharp reflection (100) at 2θ = 4.14°, corresponding to d = 20.8 Å, closely matching the estimated width of NDI-H (Fig. S9†) across the longer diagonal axis. The presence of a peak at a distance of 10.5 Å (d/2) supports the proposed lamellar packing. The wide angle X-ray diffraction (XRD) pattern shows (Fig. 5c) a broad peak in the region of 2θ = 17–29° (corresponding to d = 5.10–3.01 Å) that may arise due to alkyl chain packing and π–π stacking. Interestingly HRTEM images of a sample prepared from a diluted solution of NDI-H in decane show (Fig. S10†) a sheet-like morphology supporting the proposed model.
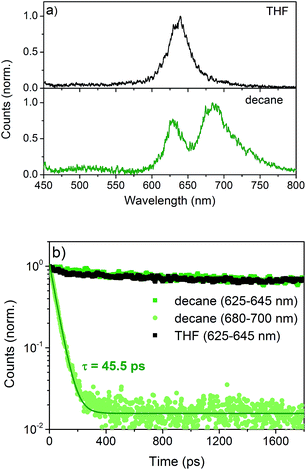
Time-resolved photoluminescence (TR-PL) and transient absorption (TA) spectroscopy were performed to investigate the effects of aggregation on the excited state dynamics.6 NDI-H exhibits an emission which peaks at 630 nm both in THF and n-decane (Fig. 6a) with very similar lifetimes. This is assigned to the radiative decay of singlet excited states localized on NDI monomers, as they are the only emissive species in THF. An additional emission at 680 nm emerges in n-decane showing an inverse decay rate of 45.5 ps (Fig. 6b). This is very fast compared to the monomeric emission, which shows only a negligible decay on the timescale of this experiment. This fast decay is assigned to the delocalization of the excitation energy over a large number of J-aggregated NDI-H molecules9 that leads to the population of a non-radiative dark state.
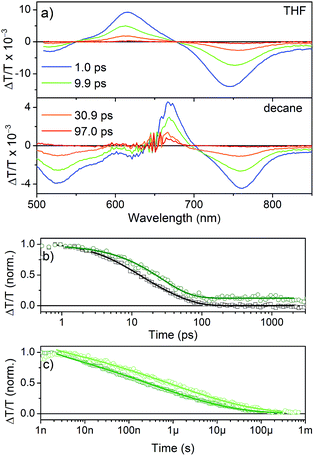
TA spectra (Fig. 7a) show a positive feature that peaks at 615 nm in THF and 667 nm in n-decane, respectively. The spectral range coincides with the ground state absorption (Fig. 2a) and thus is assigned to the ground-state bleach (GSB). The shift of the GSB is consistent with the shift of the ground-state absorption spectrum from 600 nm to 652 nm upon aggregation. At shorter and longer wavelengths negative signals are observed, which are assigned to the photo-induced absorption of excited singlet states, as they appear immediately after excitation. The transient signal measured in THF (Fig. 7b) decays within ∼200 ps with inverse decay rates of 8.3 ps and 34 ps as obtained from a biexponential fit to the data. On the other hand, aggregated NDI-H in n-decane shows a decay with an inverse decay rate of 26 ps with an additional offset accounting for >10% signal intensity remaining even beyond 3 ns.
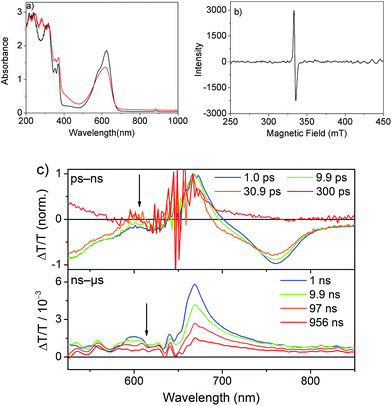
The spectrum after a few hundred picoseconds has a different shape (upper panel, Fig. 8c). The spectral shape observed at long delays, that is, in the ns measurement, is preserved on the ns–μs timescale (Fig. 8c, lower panel). The decay proceeds on the ns–μs timescale and is very slow extending beyond 100 μs (Fig. 7c). Interestingly, on this long time scale no PIA can be observed and the positive feature extends to wavelengths longer than 800 nm (Fig. 8c) and thus we assign it to delocalized charged states. The positive feature can be assigned to stimulated emission from aggregates, as this wavelength range is consistent with the emission observed in TR-PL experiments (Fig. 6a). As this emission is very short-lived in PL experiments (inverse decay rate of 45.5 ps) we exclude the possibility of it originating from triplet states. Previous literature reports NDI anion-induced absorption at 610 nm.13 To further strengthen our assignment, we reduced NDI-H chemically with cobaltocene14 and obtained the NDI-H anion spectrum which peaks at 609 nm (Fig. 8a). In the EPR spectrum, the reduced species shows the presence of a radical (Fig. 8b). At this wavelength our TS spectra show a feature on the ps–ns time scale (Fig. 7a, lower panel and Fig. 8c, upper panel) and a dip in the positive spectrum on the ns–μs timescale (Fig. 8c lower panel indicated by black arrow) which is indicative of the presence of negatively charged NDI radical species.15
Therefore we can assign the origin of the long lived signal to the delocalization of the excited state over several NDI-H molecules in J-aggregates. As the number of NDI-H molecules stacked in aggregates is not the same for all aggregates and as an ensemble of aggregates is probed by TA spectroscopy, the decay is best described by a stretched exponential decay function. Such a function can be used to describe decays in systems that exhibit a distribution of lifetimes, which is very likely in this system.
Conclusion
Overall we have elucidated the mechanistic details and molecular origin of a highly cooperative self-assembly pathway involving H-bonding, π-stacking and alkyl chain packing that leads to nanotube formation from a simple diamine-substituted NDI-dye. This is unprecedented in the literature of supramolecular assembly of any cNDI.4 J-aggregated dye molecules encapsulated in the multilayer walls of the tubes facilitate very effective delocalization of the excited states leading to remarkably prolonged excited state lifetimes, which is highly desirable in emerging areas including photocatalysis16,17 and light harvesting. Although cNDIs originate from the NDI skeleton, they have distinctly different photophysical and redox properties and thus offer a much broader scope as emerging organic materials. Considering the possibility of accessing numerous NDI-H analogues by different ring substitution reactions and their diverse photophysics, this particular design for cooperative supramolecular polymerization will significantly enhance the impact of cNDIs in organic electronics.Acknowledgements
HK thanks CSIR for a research fellowship and thanks Mr. Sridhar Banerjee for assisting to carry out CV and EPR measurements. SG thanks DST Nanomission [SR/NMNM/NS-1052NS-1052/20132013(G)] for funding. We thank Dr. T. K. Paine for useful discussions on the analysis of the EPR data. FL thanks the Max Planck Society for funding the research group. DWG acknowledges a Kekulé scholarship of the Fonds der Chemischen Industrie (FCI). GF thanks the Humboldt Foundation for financial support.Notes and references
- S. S. Babu, V. K. Praveen and A. Ajayaghosh, Chem. Rev., 2014, 114, 1973 CrossRef CAS PubMed; T. F. A. de Greef, M. M. J. Smulders, M. Wolffs, A. P. H. J. Schenning, R. P. Sijbesma and E. W. Meijer, Chem. Rev., 2009, 109, 5687 CrossRef PubMed; A. Mishra, C.-Q. Ma and P. Bauerle, Chem. Rev., 2009, 109, 1141 CrossRef PubMed; Z. Chen, A. Lohr, C. R. Saha-Möller and F. Würthner, Chem. Soc. Rev., 2009, 38, 564 RSC; S. Seki, A. Saeki, T. Sakurai and D. Sakamaki, Phys. Chem. Chem. Phys., 2014, 16, 11093 RSC.
- T. Aida, E. W. Meijer and S. I. Stupp, Science, 2012, 335, 813 CrossRef CAS PubMed; A. Ajayaghosh and V. K. Praveen, Acc. Chem. Res., 2007, 40, 644 CrossRef PubMed; S. Yagai, Bull. Chem. Soc. Jpn., 2015, 88, 28 CrossRef.
- T. E. Kaiser, H. Wang, V. Stepanenko and F. Würthner, Angew. Chem., Int. Ed., 2007, 46, 5541 CrossRef CAS PubMed.
- For review on cNDI see: N. Sakai, J. Mareda, E. Vauthey and S. Matile, Chem. Commun., 2010, 46, 4225 RSC ; For review on unsubstituted NDI see: S. V. Bhosale, C. H. Jani and S. J. Langford, Chem. Soc. Rev., 2008, 37, 331 RSC.
- S. Bhosale, A. L. Sisson, P. Talukdar, A. Fürstenberg, N. Banerji, E. Vauthey, G. Bollot, J. Mareda, C. Röger, F. Würthner, N. Sakai and S. Matile, Science, 2006, 313, 84 CrossRef CAS PubMed; T. Earmme, Y.-J. Hwang, N. M. Murari, S. Subramaniyan and S. A. Jenekhe, J. Am. Chem. Soc., 2013, 135, 14960 CrossRef PubMed; B. A. Jones, A. Facchetti, T. J. Marks and M. R. Wasielewski, Chem. Mater., 2007, 19, 2703 CrossRef; B. C. Popere, A. M. Della Pelle and S. Thayumanavan, Macromolecules, 2011, 44, 4767 CrossRef; J. H. Oh, S.-L. Suraru, W.-Y. Lee, M. Könemann, H. W. Höffken, C. Röger, R. Schmidt, Y. Chung, W.-C. Chen, F. Würthner and Z. Bao, Adv. Funct. Mater., 2010, 20, 2148 CrossRef; Y. A. Getmanenko, S. Singh, B. Sandhu, C. Wang, T. Timofeeva, B. Kippelen and S. R. Marder, J. Mater. Chem. C, 2014, 2, 124 RSC; S. Bevers, S. Schutte and L. W. McLaughlin, J. Am. Chem. Soc., 2000, 122, 5905 CrossRef; N. Sakai, P. Charbonnaz, S. Ward and S. Matile, J. Am. Chem. Soc., 2014, 136, 5575 CrossRef PubMed; E. Bang, G. Gasparini, G. Molinard, A. Roux, N. Sakai and S. Matile, J. Am. Chem. Soc., 2013, 135, 2088 CrossRef PubMed; Y. Zhao, Y. Domoto, E. Orentas, C. Beuchat, D. Emery, J. Mareda, N. Sakai and S. Matile, Angew. Chem., Int. Ed., 2013, 52, 9940 CrossRef PubMed; R. Bhosale, R. S. K. Kishore, V. Ravikumar, O. Kel, E. Vauthey, N. Sakai and S. Matile, Chem. Sci., 2010, 1, 357 RSC; Y. Zhao, C. Beuchat, Y. Domoto, J. Gajewy, A. Wilson, J. Mareda, N. Sakai and S. Matile, J. Am. Chem. Soc., 2014, 136, 2101 CrossRef PubMed.
- I. D. Cat, C. Röger, C. C. Lee, F. J. M. Hoeben, M. J. Pouderoijen, A. P. H. J. Schenning, F. Würthner and S. de Feyter, Chem. Commun., 2008, 5496 RSC; S. V. Bhosale, C. H. Jani, C. H. Lalander, S. J. Langford, I. Nerush, J. G. Shapter, D. Villamaina and E. Vauthey, Chem. Commun., 2011, 47, 8226 RSC; H. Kar, D. Gehrig, F. Laquai and S. Ghosh, Nanoscale, 2015, 7, 6729 RSC.
- C. Lara, S. Handschin and R. Mezzenga, Nanoscale, 2013, 5, 7197 RSC.
- For recent examples of nanotubular self-assembled structures based on various classes of π-systems, see: T. Mondal, T. Sakurai, S. Yoneda, S. Seki and S. Ghosh, Macromolecules, 2015, 48, 879 CrossRef CAS; S. Shin, S. Lim, Y. Kim, T. Kim, T.-L. Choi and M. Lee, J. Am. Chem. Soc., 2013, 135, 2156 CrossRef PubMed; R. Charvet, Y. Yamamoto, T. Sasaki, J. Kim, K. Kato, M. Takata, A. Saeki, S. Seki and T. Aida, J. Am. Chem. Soc., 2012, 134, 2524 CrossRef PubMed; S. Yagai, M. Yamauchi, A. Kobayashi, T. Karatsu, A. Kitamura, T. Ohba and Y. Kikkawa, J. Am. Chem. Soc., 2012, 134, 18205 CrossRef PubMed; W. Zhang, W. Jin, T. Fukushima, A. Saeki, S. Seki and T. Aida, Science, 2012, 334, 340 CrossRef PubMed; H.-J. Kim, S.-K. Kang, Y.-K. Lee, C. Seok, J.-K. Lee, W.-C. Zin and M. Lee, Angew. Chem., Int. Ed., 2010, 49, 8471 CrossRef PubMed; G. D. Pantos, P. Pengo and J. K. M. Sanders, Angew. Chem., Int. Ed., 2007, 46, 194 CrossRef PubMed; H. Shao, J. Seifert, N. C. Romano, M. Gao, J. J. Helmus, C. P. Jaroniec, D. A. Modarelli and J. R. Parquette, Angew. Chem., Int. Ed., 2010, 49, 7688 CrossRef PubMed.
- F. Würthner, T. E. Kaiser and C. R. Saha-Möller, Angew. Chem., Int. Ed., 2011, 50, 3376 CrossRef PubMed.
- C. Rest, R. Kandanelli and G. Fernández, Chem. Soc. Rev., 2015, 44, 2543 RSC.
- H. M. M. tenEikelder, A. J. Markvoort, T. F. A. de Greef and P. A. J. Hilbers, J. Phys. Chem. B, 2012, 116, 5291 CrossRef CAS PubMed; A. J. Maarkvort, H. M. M. tenEikelder, P. A. J. Hilbers, T. F. A. de Greef and E. W. Meijer, Nat. Commun., 2011, 2, 509 CrossRef PubMed.
- P. van der Schoot, Supramolecular Polymers, ed. A. Ciferri, Taylor & Francis, London, 2nd edn, 2005 CrossRef CAS PubMed; M. M. Smulders, M. M. L. Nieuwenhuizen, T. F. A. de Greef, P. van der Schoot, A. P. H. J. Schenning and E. W. Meijer, Chem.–Eur. J., 2010, 16, 362 CrossRef CAS PubMed.
- I. Pugliesi, U. Megerle, S. Suraru, F. Würthner, E. Riedle and S. Lochbrunner, Chem. Phys. Lett., 2011, 504, 24 CrossRef CAS.
- S. T. Schneebeli, M. Frasconi, Z. Liu, Y. Wu, D. M. Gardner, N. L. Strutt, C. Cheng, R. Carmieli, M. R. Wasielewski and J. F. Stoddart, Angew. Chem., Int. Ed., 2013, 52, 13100 CrossRef CAS PubMed.
- Although the radical anion could be detected, we were unable to detect the cation. A possible reason may be that the cation is absorbing in a wavelength range which is not covered by our setup. Moreover, the cross section of the cation might be small and overlapping with other transient features or it recombines too fast and thus not detectable. Noteworthy that a similar postulate was provided in an earlier report (ref. 5) by Matile and co-workers for not detecting the NDI radical cation.
- S. Fukuzumi, Electron Transfer of p-Functional Systems and Applications, Functional Organic Materials, Wiley-VCH, 2007, pp. 465–510 Search PubMed.
- I. Ghosh, T. Ghosh, J. I. Bardagi and B. König, Science, 2014, 346, 725 CrossRef CAS PubMed.
Footnote |
| † Electronic supplementary information (ESI) available: Synthesis, experimental procedure and supporting data. See DOI: 10.1039/c5sc03462k |
| This journal is © The Royal Society of Chemistry 2016 |

