 Open Access Article
Direct structural evidence of commensurate-to-incommensurate transition of hydrocarbon adsorption in a microporous metal organic framework†
Debasis
Banerjee‡
a,
Hao
Wang‡
a,
Qihan
Gong‡
a,
Anna M.
Plonka
b,
Jacek
Jagiello
c,
Haohan
Wu
a,
William R.
Woerner
b,
Thomas J.
Emge
a,
David H.
Olson
a,
John B.
Parise
b and
Jing
Li
*a
aDepartment of Chemistry and Chemical Biology, Rutgers University, Piscataway, NJ 08854, USA. E-mail: jingli@rutgers.edu
bDepartment of Geosciences, Stony Brook University, Stony Brook, NY 11794, USA
cMicromeritics Instrument Corporation, 4356 Communications Drive, Norcross, GA 30093, USA
First published on 27th October 2015
Abstract
The efficiency of physisorption-based separation of gas-mixtures depends on the selectivity of adsorbent which is directly linked to size, shape, polarizability and other physical properties of adsorbed molecules. Commensurate adsorption is an interesting and important adsorption phenomenon, where the adsorbed amount, location, and orientation of an adsorbate are commensurate with the crystal symmetry of the adsorbent. Understanding this phenomenon is important and beneficial as it can provide vital information about adsorbate–adsorbent interaction and adsorption–desorption mechanism. So far, only sporadic examples of commensurate adsorption have been reported in porous materials such as zeolites and metal organic frameworks (MOFs). In this work we show for the first time direct structural evidence of commensurate-to-incommensurate transition of linear hydrocarbon molecules (C2–C7) in a microporous MOF, by employing a number of analytical techniques including single crystal X-ray diffraction (SCXRD), in situ powder X-ray diffraction coupled with differential scanning calorimetry (PXRD-DSC), gas adsorption and molecular simulations.
1. Introduction
Porous materials such as zeolites and metal organic frameworks (MOFs) are important solid state adsorbents with enormous potential for separation of various hydrocarbons based on gas adsorption method, which is an energy-saving alternative for the traditional cryogenic distillation process used in the petroleum industry.1,2 Since the nature of guest–framework interaction within the pore determines the separation performance of an adsorbent, understanding the adsorption phenomenon with molecular level precision is essential for the design and development of high-performance materials.3–7 Commensurate adsorption, an important and unique phenomenon, is a process whereby the shape and size of the adsorbate molecules are comparable with the crystal symmetry of the adsorbent material (Fig. 1).8,9 This behavior was first observed in noble gas adsorption on layered surfaces such as graphite, and was later reported for several zeolite molecular sieves such as p-xylene (pX) in ZSM-5.10,11 The symmetry requirements in commensurate adsorption translate to the presence of an integer number of adsorbate molecules per unit cell of the adsorbent. For example, the pX adsorption isotherm shows two distinct steps at a loading of four and eight pX molecules per unit cell. Crystallographic studies reveal that the first four pX molecules are located in the channel-intersecting sites, with their methyl groups along the straight channels, and that the next four pX molecules occupy the four zig–zag channel positions.12,13 The adsorption of other xylene isomers within the pores of ZSM-5 is incommensurate, as the molecular geometry of these molecules has a mismatch with the pore symmetry.14 MOFs are a new type of crystalline adsorbent materials built on single metal cations (primary building units or PBU) or metal clusters (secondary building units or SBU) and functionalized organic linkers.15,16 In addition to their relatively high surface area and ordered pores, similar to those of traditional zeolites and aluminophosphates,17–19 MOFs have the advantage of a broad range of topological variation and surface functionalization. The complexity and hierarchy in their pore structures increase the adsorbate–adsorbent compatibility by multiple folds compared to less tunable zeolitic frameworks. A number of MOF structures are found to show commensurate adsorptions.20–23 A prototypical example is [M3(fa)6] (M = Mg, Mn, Co, Ni; fa = HCOO, formate), in which commensurate adsorption of several hydrocarbon and alcohol adsorbates (C2–nC4) are observed.21,24 The [M3(fa)6] frameworks form a one-dimensional (1D) channels with a repeating zig–zag fragment of length ∼7.1 Å. Each unit cell is composed of four such segments (two “zig” and two “zag”). Experimental adsorption and computer simulation show that alkanes with carbon number 2–4 achieve an adsorption level of 1 molecule per channel segment, commensurate with the pore structure. The adsorption becomes incommensurate with longer chain alkanes (n ≥ 5) as the molecular length exceeds the segment length.21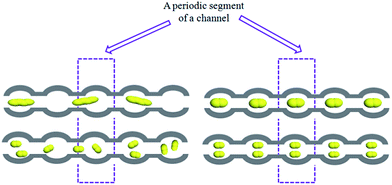 | ||
| Fig. 1 Pictorial representation of commensurate and incommensurate adsorption within a tubular one-dimensional channel of a hypothetical MOF. | ||
Typically, commensurate adsorption of hydrocarbons in a particular host framework is assessed using gas adsorption and molecular simulation techniques. However employing crystallographic methods such as single crystal X-ray diffraction on adsorbate–adsorbent complex systems can provide critical and precise information about the location and orientation of adsorbate molecules. To date, there have been very few crystallographic studies reporting the positions of hydrocarbon molecules adsorbed in porous frameworks such as zeolites or MOFs.22,25–27 Matsuda and Kitagawa used in situ synchrotron X-ray diffraction technique to locate the positions of acetylene, commensurately adsorbed in a small pore MOF Cu2(pzdc)2(pyz) [pzdc = pyrazine-2,3-dicarboxylate, pyz = pyrazine].22 Another example of commensurate adsorption is the adsorption of toluene in a highly hydrophobic MOF, Ag2(Ag4tz6) [tz = 3,5-bis(trifluoromethyl)-1,2,4-triazolate], analyzed by single crystal X-ray diffraction.27 However, no systems have ever been evaluated for direct crystallographic evidence of both commensurate and incommensurate adsorption, and the transition between the two states, of any types of adsorbates.10 Herein, for the first time, we provide direct structural data of commensurate and incommensurate adsorption of a series of linear chain hydrocarbon (C2–C7) molecules, as well as commensurate-to-incommensurate adsorption transition in a microporous MOF, Ca(sdb) (1, sdb: sulfonyldibenzoate).28 Our study is aided by a combination of analytical techniques including single crystal X-ray diffraction (SCXRD), in situ powder X-ray diffraction (PXRD) coupled with differential calorimetry (DSC), gas adsorption and molecular simulations. The SCXRD studies on hydrocarbon-loaded Ca(sdb), with both gaseous (C2–nC4) and liquid (C5–C7) hydrocarbons show that commensurate and incommensurate adsorption can be clearly identified from the difference electron density map, and this phenomenon has a direct correlation to the pore segment length and shape of the adsorbent and the length of the adsorbate molecules.
2. Results & discussion
2.1. Single crystal X-ray diffraction study
Compound 1 was synthesized using a previously reported method.28 It is a robust coordination framework with permanent microporosity (16% void space based on PLATON).28 The three-dimensional network is made of 1D chains of corner-sharing CaO6 octahedra along the crystallographic [010] direction with an estimated pore width of ∼5.52 Å (Fig. S5†). Remarkably, after activation 1′ does not reabsorb water vapor from the atmosphere and remains highly crystalline in air over a long period of time. The main observable difference in compound 1 and 1′ is the orientation of the organic linkers: in compound 1 the linkers in the same channel are packed in a parallel manner; while after activation they are tuned by 45° from each other. Interestingly, preliminary single crystal XRD data on hydrocarbon adsorbed compound 1′ shows that the structure reverts back to that of compound 1 upon adsorption. Such transition is most probably triggered by the larger size of hydrocarbon molecules (carbon number > 2) as the CO2 loaded compound 1′ does not exhibit similar structural transition.3 Therefore, adsorption simulation of helium was conducted on compound 1 to estimate the size and shape of the pores. The results illustrate that the channels of compound 1 are tubular shaped, with a total of two independent segments per unit cell. Each segment is approximately oval shaped with narrow necks but larger chamber width. The segment has the same length as that of the crystallographic b axis (∼5.56 Å, Fig. S5†). This particular structural aspect leads us to believe that 1 is an excellent candidate for crystallographic studies of possible commensurate adsorption of selected adsorbates, based on symmetry and porosity considerations.10 Taking the pore shape and size of 1 into consideration, linear C2–C7 hydrocarbons were selected as adsorbates in this study.Prior to the data collection, activated crystals (compound 1′) were exposed to gaseous C2–nC4 hydrocarbons in a closed environment. The adsorption equilibration time was 30 minutes each for C2–C3 hydrocarbons, and 5 hours for butane (nC4). The significantly longer time for the latter was required to reach adsorption equilibrium due to its slow diffusion through the narrow pore channels. The gas-adsorbed crystals were then coated with paratone oil. For the liquid nC5–nC7 hydrocarbons the activated crystals were dipped in the respective liquids overnight, followed by coating with paratone oil. Single crystal data were then collected on average over a period of 18 hours (with 30 second exposure time for each frame). The activated compound 1′ has the same space group as that of as-synthesized compound 1 (P21/n), however the relative orientation of the ligand rings is different. Upon adsorption of hydrocarbons its structure reverts back to that of 1 (see Discussion Section for details). Due to their high thermal motion and positional disorder, the thermal parameters of the carbon atoms in the hydrocarbons were restrained, leading to a lower refined occupancy in all cases. The crystallographic study shows that the short chain hydrocarbons (C2–nC4) can be unambiguously identified as single molecular entity while the longer chain (C5–C7) hydrocarbons appear as continuous ribbon of carbon atoms along the channel as a result of the size/shape and symmetry mismatch with the host framework.
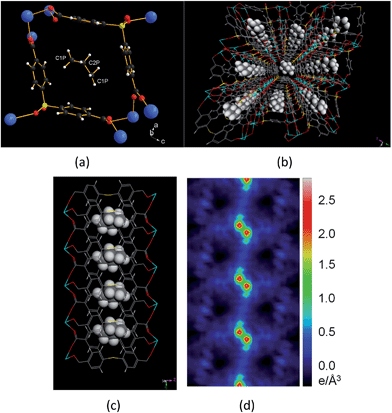
All four gas-adsorbed phases involving short-chain hydrocarbons (C2@1′, C3°@1′, C3=@1′ and nC4@1′) have the same structure as their parent compound 1 (Tables S1–S4†).3,28 In all structures, ethane (C2), propane (C3°), propene (C3=) and butane (nC4) occupy the same general positions, which are inside the ‘pocket’ created by the two benzene rings of the V-shaped organic linker. The structure of C3=@1′ is shown in Fig. 2a–d. Each propene molecule is situated in the middle of the channel approximately perpendicular to the crystallographic b axis (Fig. 2a). The distance between the neighboring propene molecules is 5.56(1) Å (Table S2†). There are two crystallographically unique sites of carbon atoms within each C3= (the terminal C1P and central C2P; Fig. S3†); the other terminal carbon atom (C1P) is generated by the symmetry operation. The central C2P carbon atom is disordered over two positions. The average distances between the C1P and C2P carbons and the centroids of the aromatic rings are 4.0 Å and 4.1 Å respectively, while the distances between the C3= hydrogen atoms and the centroid of the aromatic ring range between 3.12 and 3.72 Å. The long-range non-covalent electronic interactions between the adsorbate and the pore surface, especially the directed C–H⋯π interaction, are likely responsible for the orientation of the adsorbate molecule. This type of C–H⋯π interaction is well-known and assumed to be a driving force for crystal packing, protein folding and molecular recognition.29–32 In the present case, the configuration of the aromatic ring in the framework and the propene molecule, and the distance between them, is similar to those of calculated values for hydrocarbons and single benzene rings.33 The crystallographic study reveals that adsorption of all four small hydrocarbons (ethane, propane, propene and butane) are commensurate with the crystal lattice of 1. The somewhat lower occupancy is the result of constraints on the thermal displacement variables in the refinement (Table 1).
| Adsorbate | Uptakea (wt%) | Uptake (mmol g−1) | Uptake, number of molecule per unit cell (number of molecule per segment) | Q st (kJ mol−1) | |
|---|---|---|---|---|---|
| Simulation | Adsorption expta | ||||
| a Uptake values for C2H6, C3H6, and C4H10 are at 298 K and 770 torr. b Uptake values for n-C5H12, n-C6H14, and n-C7H16 are at 303 K and 196, 55 and 15.5 torr, respectively. c Calculated from the adsorption isotherms at 273, 288 and 298 K. d Calculated from the adsorption isotherms at 373, 383 and 393 K. | |||||
| Ethane (C2) | 4.26a | 1.42 | 2 (1) | 1.95 (0.97) | 35.7c |
| Propene (C3=) | 6.30a | 1.50 | 2 (1) | 2.06 (1.03) | 44.8c |
| Butane (nC4) | 8.18a | 1.41 | 2 (1) | 1.94 (0.97) | 52.6c |
| Pentane (nC5) | 5.47b | 0.76 | 1 (0.5) | 1.08 (0.54) | 66.9d |
| Hexane (nC6) | 5.79b | 0.67 | 0.94 (0.47) | 1.00 (0.5) | 76.5d |
| Heptane (nC7) | 6.38b | 0.64 | 0.8 (0.4) | 0.9 (0.45) | 81.2d |
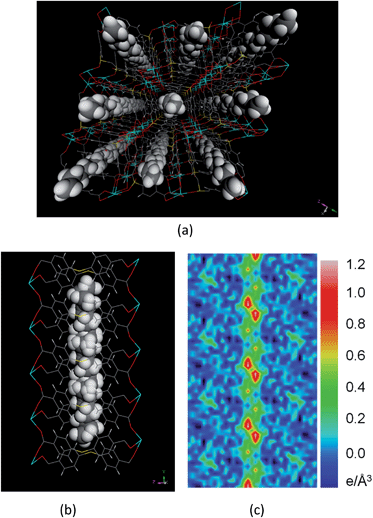
On the other hand, the crystallographic signature of nC5–nC7 hydrocarbons is quite different from that of short-chain C2–nC4 hydrocarbons. In these cases, the chain length of the adsorbate molecules approaches or exceeds the segment length (∼5.56 Å) and pore width (∼5.52 Å) (Fig. S5 & Table S8†). Due to the size mismatch, the sidewise orientation of the adsorbates (perpendicular to the b axis) is no longer possible and the molecules are turned to be oriented in the b direction (see Table S8† for detailed information). The packing of adsorbate molecules within the host channel thus becomes incommensurate with the pore symmetry and size. As a result, their individual molecular identities cannot be resolved by single crystal X-ray diffraction method (Tables S4–S7†). The molecules appear to be a continuous chain of carbon atoms along the channel (Fig. 3). All carbon atoms are disordered and partially occupied. The ability of the carbon atoms to assume more than one position simultaneously arises from the chain flexibility, which results in adaptation of multiple configurations including all trans or gauche at the same time. The packing of all nCm (7 ≥ m ≥ 5) molecules inside the channels is similar due to geometry constraints. For example, the adsorbed hexane (nC6) is located in the center of the channel, equidistant from the four benzene rings primarily forming the pore surface (Fig. 3).
The carbon atoms of hexane molecules are on average 4.2 Å away from the centroids of the aromatic rings, with the hexane hydrogen atoms at around 3.2 Å from the center of the rings, similar to what has been observed in C3=@1′. In the case of C5–C7, the extensive disorder within the pore, which makes the assignment of individual molecules impossible, is an indication of an incommensurate adsorption. Because of the disorder, it is more realistic to discuss the nature of electron density inside the channel than any constrained model. We used a difference Fourier electron density map to understand the nature as well as the distribution of electron density in the channel for commensurate and incommensurate adsorption (Fig. 2d & 3c, respectively). In the case of C3=, the map clearly shows the presence of localized electron density in the channel, while in the case of nC6, there are no distinct centers of electron density; rather, only a continuous electron density along the channel is observed. The continuous nature of the electron density is indicative of an equal probability of occupation of molecules and absence of a ‘locked’ or ‘frozen’ position. There are no signs of incommensurate scattering, suggesting that there is no long-range modulated structure of the hydrocarbons in the pore.
2.2. Experimental gas adsorption and simulation
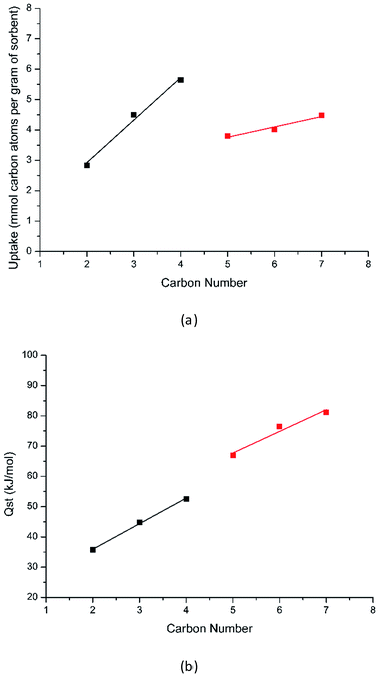
To confirm the adsorption behavior based on the crystallographic study, we carried out both adsorption experiments and Monte-Carlo simulations (see Table 1 and ESI† for details). Compound 1′ shows a type-I gas adsorption profile for all C2–C7 hydrocarbons, typical for microporous materials (Fig. S6–S11†). The experimentally obtained uptake and simulated values are in excellent agreement. For C2–nC4, each unit cell takes up two molecules (or one molecule per pore segment) in the experimental temperature range, characteristic of commensurate adsorption, while fractional numbers of molecules are obtained in the case of nC5–nC7, indicating incommensurate adsorption. The uptake (in mmol of carbon atoms per gram of sorbent) increases from C2 to nC4, and drops at nC5 and increases again up to nC7 (Fig. 4a), which indicates different adsorption mechanisms for C2–nC4 and nC5–nC7. This observation agrees well with the results from single crystal X-ray diffraction study, suggesting that the transition from commensurate to incommensurate adsorption occurs between nC4 and nC5. The heats of adsorption (Qst) at zero-coverage were calculated based on the adsorption isotherms collected at various temperatures. In the case of C2–nC4, data at 273, 288, and 298 K were used. For liquid hydrocarbons (nC5–nC7), isotherms were collected at higher temperatures (363, 373, 383, and 393 K) and the latter three temperatures (373, 383, 393 K) were used to calculate the Qst values (Table 1). The calculated Qst of C3= is 44.8 kJ mol−1, comparable to those of highest values reported for the M–MOF-74 (M = Co, Fe, Mn, Mg, Qst = 45–55 kJ mol−1) series34–36 and HKUST-1 (∼42 kJ mol−1).37 The high Qst in the current case is likely due to the simultaneous interaction of adsorbed C3= with more than one aromatic ring and the overall effect of the small pores of compound 1. The Qst values increase linearly from C2 to nC4, and from nC5 to nC7, and a discontinuity is observed between nC4 and nC5 (Fig. 4b), confirming that adsorption mechanisms for the two groups of hydrocarbons (C2–nC4 and nC5–nC7) are different.2.3. In situ PXRD-DSC analysis
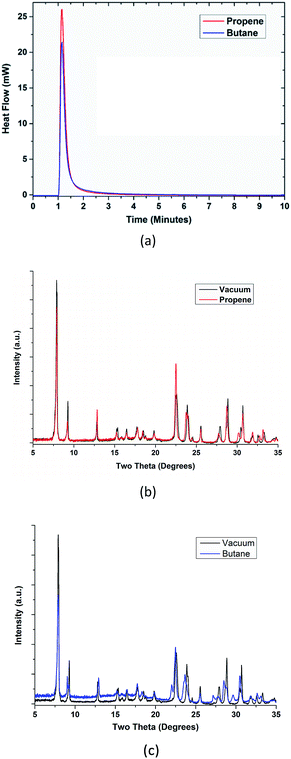
To further understand how the adsorbed guest molecules affect the overall structure, and to confirm the results from the gas adsorption experiments, a combined PXRD-DSC method was employed to study this system (Fig. 5). This method is capable of detecting any adsorption related structural changes by means of in situ PXRD, and can also calculate Qst of different adsorbates from DSC data.3,38 In this study, propene (C3=) and n-butane (nC4) were chosen as representative examples from C2–C7 hydrocarbons. The DSC signals were recorded at 298 K simultaneously with PXRD scans on selected samples to measure the differential enthalpy between the gas-free (1′) and the gas-loaded (HC@1′) samples under ambient conditions.The measured differential enthalpies of adsorption (ΔH) are 21.48(14) and 20.64(29) kJ mol−1 for propene and n-butane, respectively (Fig. 5). At 1 atm pressure and room temperature the adsorbed amounts of propene and n-butane are within 5.45% and 6.44% from calculated Qst values of 48.1 and 53.97 kJ mol−1, respectively, using the equation ΔH = ni × Qst (ni = moles of the gas). These values are comparable to those obtained from adsorption isotherms, which are 44.8 and 52.6 kJ mol−1, respectively. The PXRD patterns of the guest-adsorbed (propene and n-butane) compound under equilibrium conditions show a decrease in intensity of low angle peaks, suggesting that the adsorbates are occupying the pore. The filling of pores by the adsorbate molecules causes a destructive interference on the low angle, high d spacing reflections that typically spans the pore. The DSC method has thus proven to be an alternative way of measuring the Qst of different gases in porous material, while simultaneously monitoring any adsorption related structural changes. Unlike the propene-loaded sample, several peaks in the PXRD pattern of n-C4H10 loaded compound exhibits small shift to lower angles, indicating lattice expansion to accommodate the larger n-C4H10 molecule within a pore segment. The increase in background with butane adsorption is due to diffuse scattering of the gas in the DSC chamber.
3. Conclusion
In summary, we present in this work the first direct structural evidence of commensurate and incommensurate adsorption of hydrocarbons and the transition between these two states in a highly stable microporous metal organic framework. The SCXRD data on small hydrocarbons (carbon number (n): 2–4) show that each molecule occupies one pore segment, commensurate with the crystal and pore symmetry. All gas species can be identified as single molecular entities, due to their matching size and shape with the pore. The increase in chain length (n ≥ 5) leads to a crystallographically unique situation, where they become indistinguishable from each other, yielding an infinite chain of carbon atoms along the channel direction, as a result of incompatibility in shape, size, and symmetry of the adsorbate molecules with respect to those of the host framework matrix. The commensurate–incommensurate adsorption and transition is confirmed by experimental gas adsorption, PXRD-DSC, and molecular simulation studies. This study shows that use of multiple experimental methods can provide a molecular level understanding of interactions between adsorbates and adsorbents having different pore shape, size and surface, which is critical for predicting adsorption behavior and guiding further effort in designing gas-selective porous solids.Acknowledgements
The work at Rutgers University (sample synthesis and preparation, single crystal X-ray diffraction and gas-adsorption analysis) is supported by the U.S. Department of Energy (DOE), Office of Basic Energy Sciences, Materials Sciences and Engineering Division through grant no. DE-FG02-08ER46491. The RU team would also like to acknowledge Micromeritics Instrument Corp. for the donation of a new 3Flex system through its Instrument Grant program. The PXRD-DSC work (A.M.P, W.R.W. J.B.P) was supported by the U.S. DOE, office of Basic Energy Sciences (BES) through grant no. BES DE- FG02-09ER46650 and NSF Materials Genome Project DMR-1231586.Notes and references
- J. H. Dong, Y. S. Lin and W. Liu, AIChE J., 2000, 46, 1957 CrossRef CAS.
- D. H. Olson, US Patent 6488741 B2, 2001.
- A. M. Plonka, D. Banerjee, W. R. Woerner, Z. J. Zhang, N. Nijem, Y. J. Chabal, J. Li and J. B. Parise, Angew. Chem., Int. Ed., 2013, 52, 1692 CrossRef CAS PubMed.
- R. Vaidhyanathan, S. S. Iremonger, K. W. Dawson and G. K. H. Shimizu, Chem. Commun., 2009, 5230 RSC.
- S. Y. Zhen and K. Seff, Microporous Mesoporous Mater., 2000, 39, 1 CrossRef CAS.
- H. Morell, K. Angermund, A. R. Lewis, D. H. Brouwer, C. A. Fyfe and H. Gies, Chem. Mater., 2002, 14, 2192 CrossRef CAS.
- Y. Inokuma, S. Yoshioka, J. Ariyoshi, T. Arai, Y. Hitora, K. Takada, S. Matsunaga, K. Rissanen and M. Fujita, Nature, 2013, 495, 461 CrossRef CAS PubMed.
- P. W. Stephens, P. A. Heiney, R. J. Birgeneau, P. M. Horn, D. E. Moncton and G. S. Brown, Phys. Rev. B: Condens. Matter Mater. Phys., 1984, 29, 3512 CrossRef CAS.
- H. Hong, C. J. Peters, A. Mak, R. J. Birgeneau, P. M. Horn and H. Suematsu, Phys. Rev. B: Condens. Matter Mater. Phys., 1987, 36, 7311 CrossRef CAS.
- H. H. Wu, Q. H. Gong, D. H. Olson and J. Li, Chem. Rev., 2012, 112, 836 CrossRef CAS PubMed.
- B. Smit and T. L. M. Maesen, Nature, 1995, 374, 42 CAS.
- D. H. Olson, G. T. Kokotailo, S. L. Lawton and W. M. Meier, J. Phys. Chem., 1981, 85, 2238 CrossRef CAS.
- P. T. Reischman, K. D. Schmitt and D. H. Olson, J. Phys. Chem., 1988, 92, 5165 CrossRef CAS.
- D. Dubbeldam, S. Calero, T. L. M. Maesen and B. Smit, Phys. Rev. Lett., 2003, 90, 245901 CrossRef CAS PubMed.
- H. C. Zhou, J. R. Long and O. M. Yaghi, Chem. Rev., 2012, 112, 673 CrossRef CAS PubMed.
- M. O'Keeffe and O. M. Yaghi, Chem. Rev., 2012, 112, 675 CrossRef PubMed.
- K. Sumida, D. L. Rogow, J. A. Mason, T. M. McDonald, E. D. Bloch, Z. R. Herm, T. H. Bae and J. R. Long, Chem. Rev., 2012, 112, 724 CrossRef CAS PubMed.
- J. R. Li, J. Sculley and H. C. Zhou, Chem. Rev., 2012, 112, 869 CrossRef CAS PubMed.
- N. Stock and S. Biswas, Chem. Rev., 2012, 112, 933 CrossRef CAS PubMed.
- K. H. Li, J. Lee, D. H. Olson, T. J. Emge, W. H. Bi, M. J. Eibling and J. Li, Chem. Commun., 2008, 6123 RSC.
- R. Krishna and J. M. van Baten, Mol. Simul., 2009, 35, 1098 CrossRef CAS.
- R. Matsuda, R. Kitaura, S. Kitagawa, Y. Kubota, R. V. Belosludov, T. C. Kobayashi, H. Sakamoto, T. Chiba, M. Takata, Y. Kawazoe and Y. Mita, Nature, 2005, 436, 238 CrossRef CAS PubMed.
- C. Yang, U. Kaipa, Q. Z. Mather, X. Wang, V. Nesterov, A. F. Venero and M. A. Omary, J. Am. Chem. Soc., 2011, 133, 18094 CrossRef CAS PubMed.
- K. H. Li, D. H. Olsan, J. Y. Lee, W. H. Bi, K. Wu, T. Yuen, Q. Xu and J. Li, Adv. Funct. Mater., 2008, 18, 2205 CrossRef CAS.
- S. B. Jang, M. S. Jeong, Y. Kim and K. Seff, J. Phys. Chem. B, 1997, 101, 3091 CrossRef CAS.
- W. J. M. Vanwell, J. P. Wolthuizen, B. Smit, J. H. C. Vanhooff and R. A. Vansanten, Angew. Chem., Int. Ed., 1995, 34, 2543 CrossRef CAS.
- C. Yang, U. Kaipa, Q. Z. Mather, X. P. Wang, V. Nesterov, A. F. Venero and M. A. Omary, J. Am. Chem. Soc., 2011, 133, 18094 CrossRef CAS PubMed.
- D. Banerjee, Z. J. Zhang, A. M. Plonka, J. Li and J. B. Parise, Cryst. Growth Des., 2012, 12, 2162 CAS.
- Y. Umezawa, S. Tsuboyama, K. Honda, J. Uzawa and M. Nishio, Bull. Chem. Soc. Jpn., 1998, 71, 1207 CrossRef CAS.
- N. K. Vyas, M. N. Vyas and F. A. Quiocho, Science, 1988, 242, 1290 CAS.
- M. J. Plevin, D. L. Bryce and J. Boisbouvier, Nat. Chem., 2010, 2, 466 CrossRef CAS PubMed.
- D. B. Amabilino, P. R. Ashton, C. L. Brown, E. Cordova, L. A. Godinez, T. T. Goodnow, A. E. Kaifer, S. P. Newton, M. Pietraszkiewicz, D. Philp, F. M. Raymo, A. S. Reder, M. T. Rutland, A. M. Z. Slawin, N. Spencer, J. F. Stoddart and D. J. Williams, J. Am. Chem. Soc., 1995, 117, 1271 CrossRef CAS.
- J. Ran and M. W. Wong, J. Phys. Chem. A, 2006, 110, 9702 CrossRef CAS PubMed.
- E. D. Bloch, W. L. Queen, R. Krishna, J. M. Zadrozny, C. M. Brown and J. R. Long, Science, 2012, 335, 1606 CrossRef CAS PubMed.
- S. J. Geier, J. A. Mason, E. D. Bloch, W. L. Queen, M. R. Hudson, C. M. Brown and J. R. Long, Chem. Sci., 2013, 4, 2054 RSC.
- Y.-S. Bae, C. Y. Lee, K. C. Kim, O. K. Farha, P. Nickias, J. T. Hupp, S. T. Nguyen and R. Q. Snurr, Angew. Chem., Int. Ed., 2012, 51, 1857 CrossRef CAS PubMed.
- N. Lamia, M. Jorge, M. A. Granato, F. A. Almeida Paz, H. Chevreau and A. E. Rodrigues, Chem. Eng. Sci., 2009, 64, 3246 CrossRef CAS.
- A. M. Plonka, D. Banerjee, W. R. Woerner, Z. Zhang, J. Li and J. B. Parise, Chem. Commun., 2013, 49, 7055 RSC.
Footnotes |
| † Electronic supplementary information (ESI) available: Experimental procedures gas-adsorption data and crystallographic data. CCDC 1051641, 1051643–1051647 and 1427863. For ESI and crystallographic data in CIF or other electronic format see DOI: 10.1039/c5sc03685b |
| ‡ These authors contributed equally to this work. |
| This journal is © The Royal Society of Chemistry 2016 |

