 Open Access Article
DNA-mediated cell surface engineering for multiplexed glycan profiling using MALDI-TOF mass spectrometry†
Ziyi
He
 ,
Qiushui
Chen
,
Fengming
Chen
,
Jie
Zhang
,
Haifang
Li
and
Jin-Ming
Lin
*
,
Qiushui
Chen
,
Fengming
Chen
,
Jie
Zhang
,
Haifang
Li
and
Jin-Ming
Lin
*
Department of Chemistry, Beijing Key Laboratory of Microanalytical Methods and Instrumentation, Tsinghua University, Beijing 100084, China. E-mail: jmlin@tsinghua.edu.cn
First published on 5th May 2016
Abstract
Glycans are crucial for many key biological processes and their alterations are often a hallmark of disease. Thus, multiplexed and sensitive analysis of glycans is of intense interest. Here we report a novel approach using DNA-mediated cell surface engineering for glycan profiling by MALDI-TOF mass spectrometry (MS). Following lectin binding, DNA amplification and hybridization, glycans on the cell surface are specifically labeled by short DNA probes, which can be facilely released, ionized and detected in MALDI-TOF MS. This strategy converts the analysis of glycans to the detection of DNA probes, overcoming the complicated composition and low ionization efficiency of glycans, enabling in situ detection and facilitating multiplex analysis. The amplification procedure also improves the sensitivity. This approach has been applied to evaluate glycomic alterations in cancer cells and provided the intrinsic distribution of glycans in tissues using MALDI imaging mass spectrometry.
Introduction
Glycans, as one of the four basic components of cells, are covalent assemblies of sugars that either exist in free form or attach to proteins or lipids.1 They decorate all eukaryotic cell surfaces and are crucial for many key biological processes.2,3 The expression and structure of glycans are often aberrant in pathological states, and these alterations can be a hallmark of diseases.4,5 Thus multiplexed, sensitive and reliable analysis of glycans is highly desirable, and facilitates the understanding of their specific roles in biological processes and provides information for disease prediction and diagnosis.6To date, a series of approaches have been developed for glycan analysis, such as fluorescence imaging, use of microarrays, electrochemical biosensors and mass spectrometry.7–11 In particular, mass spectrometry, as a powerful and promising technology, has been widely applied to the detection and identification of glycans because of its broad detection range, high mass resolution and capability for multicomponent analysis.12 Nevertheless, the conventional MS based method for cell surface glycan analysis typically involves several steps, including cell lysis, molecule extraction and separation, enzymatic deglycosylation, glycan derivatization and MS analysis.13 It offers multiple molecule-level information, but suffers from the drawbacks of time-consuming procedures, complicated data analysis and the requirement of a large numbers of cells. The spatial information of glycan expression is also limited due to the sample homogenization. Recently, combined with direct enzymatic releasing of N-lined glycans or photocleavable mass tags,14,15in situ analysis of glycans in cells or tissues has been achieved by matrix-assisted laser desorption/ionization mass spectrometry (MALDI-MS). Unfortunately, these methods either suffer from the loss of glycan groups during treatment or are limited to a lack of mass tags for multiplexing detection. Thus, the development of multiplexed and in situ methods for glycans present on the cell surface with a high sensitivity and specificity is still important.
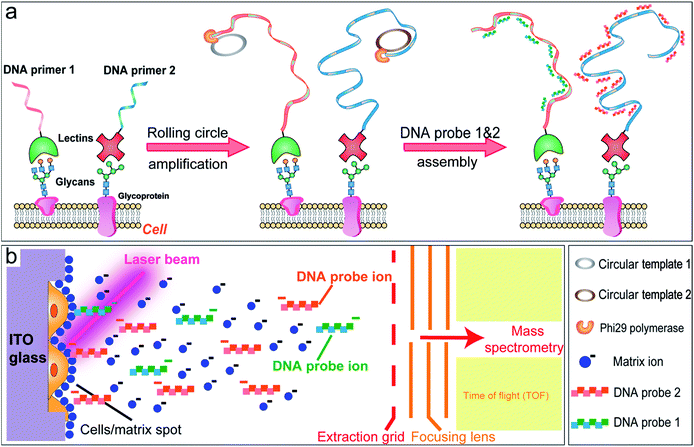
In this study, a MALDI-TOF MS based approach is developed for the multiplexed profiling of cell surface glycans using a DNA-mediated cell surface engineering strategy. Lectins, as carbohydrate-binding proteins isolated from different organisms (mainly from plants), are used for the specific targeting of cell surface glycans.16 We encode lectins with DNA primers, which can be utilized in the subsequent rolling circle amplification, producing long single-strand DNA (ss-DNA) with repetitive sequence units (Fig. 1a).17 After hybridizing with complementary short DNA probes, the labeled cells are analyzed by MALDI-TOF MS. The hydrogen bonds in DNA duplexes are facilely broken under laser irradiation, which makes the short DNA probes detach from the cell surface and be detected by TOF-MS (Fig. 1b). Therefore we convert the analysis of glycans to the detection of DNA probes, overcoming the complicated composition and low ionization efficiency of glycans, and facilitating multiplex analysis. The amplification procedure also improves the sensitivity. This novel strategy is then applied to evaluate the alterations of N-glycans in cancer cells with multidrug resistance and under drug stimuli. Owing to the preservation of spatial information, this robust approach can further be utilized in MALDI imaging mass spectrometry (MALDI-IMS), providing the intrinsic distribution of glycans in tissue sections.
Results and discussion
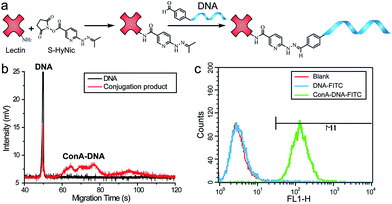
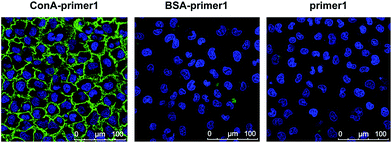
In the proof-of-concept experiments, we analyzed the α-D-mannosyl groups on the cell surface using concanavalin A (ConA), a lectin extracted from jack bean and binding specifically to the mannosyl and glucosyl groups. A covalent conjugation strategy was utilized for the coupling of ConA and the DNA primer.18 As shown in Fig. 2a, a hydrazide moiety was firstly incorporated on ConA via reaction with the amino groups in lysine side chains. A ConA–DNA conjugate was then formed via a hydrazine linkage by the reaction of hydrazide groups and 5′-aldehyde modified DNA. The conjugation product was verified using microchip capillary electrophoresis (MCE). New bands with a lower mobility were clearly shown in the electrophoretogram (Fig. 2b), representing the ConA–DNA conjugates. To evaluate the recognition ability of the conjugates, cells were stained with FITC (fluorescein isothiocyanate)-labeled ConA–DNA conjugates. Flow cytometry analysis demonstrated a distinct fluorescence increase after labeling, which could be distinguished from cells treated with DNA-FITC and control cells (Fig. 2c). Free D-mannose and D-glucose inhibited the binding of ConA–DNA to the cell surface, while the nonspecific D-galactose showed no inhibition (Fig. S1†). This monosaccharide inhibition assay verified the recognition specificity of the ConA–DNA conjugates. Since there were no glucosyl group presented in the processed N-glycans, the mannosyl groups are the epitopes that were recognized by ConA–DNA on the cell surface.Further, we used rolling circle amplification (RCA) to engineer long ss-DNA on the cell surface, by hybridizing the DNA primers with circular DNA templates and amplifying using Phi29 polymerase. This isothermal process preserved the integrity of the lectin–glycan complexes and led to a signal amplification. The RCA reaction of lectin–DNA conjugates in solution was verified using agarose electrophoresis. New bands with more than 1000 bps in length were displayed, which were the bands of the RCA products (Fig. S2†). For in situ cell labeling and amplification, MCF-7 cells were firstly cultured on ITO glass, which was conductive, enabling subsequent MALDI-MS detection. High cell viability was demonstrated by live/dead assays after 2 days culturing (Fig. S3†). Cells were fixed, labeled by ConA–primer1 and the RCA reaction was performed. Then, we used the FITC-labeled short DNA probe1 for hybridization with the repetitive sequences in the RCA products. Confocal imaging showed that a strong fluorescence signal emanated from the cell surface, while negligible fluorescence was observed in the control experiments when the cells were incubated with non-specific BSA–primer1 or only the primer1 DNA and the RCA reaction was performed (Fig. 3). These results confirmed the specific binding, RCA reaction and probe hybridization directly on the cell surface.
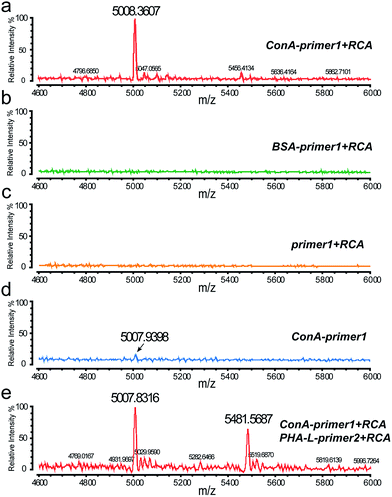
After the cell surface engineering, ITO glass with cells was affixed onto the stainless steel MALDI plate by conductive tape, and MALDI-TOF MS was performed for glycan analysis. Matrix crystallization and homogeneity were critical factors, affecting the robustness and reproducibility of MS signals.19 Here we chose 3-hydroxypicolinic acid (3-HPA) as the matrix and employed a home-made inkjet printing device for matrix introduction. An array of reproducible droplets was produced on the ITO glass, drying to form crystalline matrix spots of ∼300 μm in diameter (Fig. S4a and b†). Under laser irradiation, the hydrogen bonds in DNA duplexes were easily broken, leading to the desorption and ionization of the short DNA probes. As shown in Fig. 4a, with specific ConA–primer1 labeling and RCA reaction, a prominent peak was observed in the mass spectrum, corresponding to the short DNA probe1 (Fig. S6a†). In contrast, no MS signal was detected in control experiments (Fig. 4b and c). The mass deviation between the molecular ion peak and the calculated molecular weight value (Table S1†) might be due to the shortened distance from the initial ionization position to the extraction grid when molecules were ionized from the ITO glass (detailed explanation is in the ESI†). The DNA amplification procedure increased the signal intensity nearly 10 fold compared to the cells without RCA reaction (Fig. 4d). This result indicated the feasibility of our DNA engineering strategy for MALDI-MS analysis, which was capable of detecting cell surface glycans in situ with high sensitivity and specificity.
In this work, the approach of simultaneously labeling with different DNA sequences provides an opportunity for multiplexed analysis by mass spectrometry. To prove this concept, two types of lectins, ConA and PHA-L (Phaseolus vulgaris leucoagglutinin), were conjugated with two different DNA primers respectively and used for cell labeling. PHA-L was a lectin isolated from Phaseolus vulgaris and specifically recognized the β1-6GlcNAc (N-acetylglucosamine) branched N-glycan groups. After RCA reaction, two corresponding DNA probes modified with different fluorophores were added and hybridized on the cell surface. When analyzed in MALDI-MS, two obvious peaks of the DNA probes were demonstrated in the mass spectrum (Fig. 4e), corresponding to the expression of the two glycan groups. Confocal imaging was also used to confirm the multiplexed labeling, with strong green and red fluorescence emitted from the cell membrane (Fig. S5†).
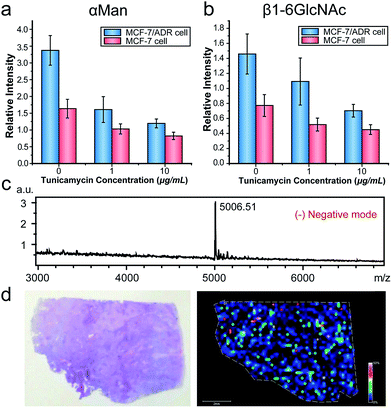
We then applied this strategy to evaluate the alterations of N-glycans in cancer cells with multidrug resistance and under drug stimuli. Multidrug resistance, as a major problem in cancer chemotherapy, contributed to the failure of chemotherapeutic drug treatments.20 Recent researches indicated that aberrant glycan expression was correlated with cancer chemo-resistance.21 We analyzed the expressions of two types of N-glycans (α-D-mannosyl and β1-6GlcNAc groups) in the breast carcinoma cell line MCF-7 and its drug resistance cell line MCF-7/ADR using the MALDI-TOF MS based approach. We also profiled the glycan alterations in both cell lines under the treatment of tunicamycin (TM), which was an inhibitor of GlcNAc phosphotransferase, blocking the formation of N-glycosidic linkages in glycoprotein synthesis.22 Owing to the matrix inhomogeneity, ion signals in MALDI-MS were always irreproducible, impeding its application in quantitative analysis. To solve this problem, we utilized the inkjet printing device to apply a DNA internal standard on cells prior to the matrix (Fig. S4c†), and the intensity ratio of the DNA probe to the internal standard was used in the subsequent semi-quantitative analysis (Fig. S6d†). As shown in Fig. 5a and b, the expressions of α-D-mannosyl and β1-6GlcNAc groups in MCF7/ADR cells were both higher than those in MCF7 cells. The elevated glycan expression might be due to the overexpression of P-glycoprotein in MCF-7/ADR cells. P-Glycoprotein, conferring resistance of cancer cells to a variety of chemotherapeutic drugs, was a heavily N-glycosylated transmembrane protein.23 Thus its overexpression increased the expression of the N-glycans in cells. For drug treatment, the CCK-8 assay indicated that TM inhibited cell proliferation in a dose-dependant manner (Fig. S7†). Results of the MALDI-MS analysis demonstrated that the expressions of the two types of N-glycans both decreased with the increase of TM concentration, which was in good correlation with the standard flow cytometry analysis (Fig. S8†). Also, the drug resistant cell line MCF-7/ADR was more sensitive to TM, with a more pronounced downregulation of the N-glycans compared to MCF-7 cells at the same TM concentration. A previous study revealed that TM treatment could enhance the sensitivity of drug-resistant cancer cells to anticancer drugs.24 We supposed that the glycomic alterations induced by TM might have a correlation with this reduction of multidrug resistance.
MALDI-IMS, as an important technology for tissue analysis, provides the intrinsic distribution and relative abundance of different compounds in tissue sections. Despite the recent advances in MALDI-IMS, it's still challenging to image some classes of molecules such as glycans and proteins, owing to their large molecule weights, reduced ionization efficiencies and complicated composition. Thus we further applied the DNA-mediated cell surface engineering strategy to MALDI-IMS to overcome these limitations. A human lung tumor tissue section was placed on ITO glass, labeled by ConA–primer1, amplified and hybridized with DNA probe1. The section was imaged at a spatial resolution of 200 μm. Fig. 5c showed the overall average mass spectrum of the imaged region, with a predominant peak at m/z 5006.51, corresponding to the DNA probe1. A mass spectrometric heat map was demonstrated in Fig. 5d, illustrating the spatial distribution of α-D-mannosyl groups in this tissue section. This result indicated the feasibility of our method in MALDI-IMS, which broadened the scope of application.
Conclusions
In summary, we have developed a novel MALDI-TOF MS based approach for the multiplexed profiling of cell surface glycans. Based on DNA-mediated cell surface engineering, glycan groups are in situ profiled with high sensitivity and specificity. Diverse DNA design facilitates a multiplexed analysis, with unlimited mass tags. The DNA amplification procedure improves the sensitivity, which is suitable for low abundance glycan analysis. This approach has been successfully applied to profile the glycomic alterations in breast cancer cell lines. It was also utilized in MALDI-IMS, providing the intrinsic distribution of glycans in tissue sections. For further application, this approach can be extended to analyze cellular proteins, using DNA conjugated antibodies, as demonstrated in Fig. S9.† This multiplexed, high-sensitive and versatile method provides new insights into biomarker analysis, and contributes to the development of clinical diagnostics.Acknowledgements
This work was financially supported by National Natural Science Foundation of China (No. 21435002, 81373373, 21227006).References
- J. F. Rakus and L. K. Mahal, Annu. Rev. Anal. Chem., 2011, 4, 367–392 CrossRef CAS PubMed.
- K. W. Moremen, M. Tiemeyer and A. V. Nairn, Nat. Rev. Mol. Cell Biol., 2012, 13, 448–462 CrossRef CAS PubMed.
- K. Ohtsubo and J. D. Marth, Cell, 2006, 126, 855–867 CrossRef CAS PubMed.
- D. H. Dube and C. R. Bertozzi, Nat. Rev. Drug Discovery, 2005, 4, 477–488 CrossRef CAS PubMed.
- A. N. Samraj, O. M. Pearce, H. Laubli, A. N. Crittenden, A. K. Bergfeld, K. Banda, C. J. Gregg, A. E. Bingman, P. Secrest, S. L. Diaz, N. M. Varki and A. Varki, Proc. Natl. Acad. Sci. U. S. A., 2015, 112, 542–547 CrossRef CAS PubMed.
- K. Marino, J. Bones, J. J. Kattla and P. M. Rudd, Nat. Chem. Biol., 2010, 6, 713–723 CrossRef CAS PubMed.
- H. Jiang, B. P. English, R. B. Hazan, P. Wu and B. Ovryn, Angew. Chem., Int. Ed., 2015, 54, 1765–1769 CrossRef CAS PubMed.
- E. L. Bird-Lieberman, A. A. Neves, P. Lao-Sirieix, M. O'Donovan, M. Novelli, L. B. Lovat, W. S. Eng, L. K. Mahal, K. M. Brindle and R. C. Fitzgerald, Nat. Med., 2012, 18, 315–321 CrossRef CAS PubMed.
- J. Hirabayashi, M. Yamada, A. Kuno and H. Tateno, Chem. Soc. Rev., 2013, 42, 4443–4458 RSC.
- T. Bertok, L. Klukova, A. Sediva, P. Kasak, V. Semak, M. Micusik, M. Omastova, L. Chovanova, M. Vlcek, R. Imrich, A. Vikartovska and J. Tkac, Anal. Chem., 2013, 85, 7324–7332 CrossRef CAS PubMed.
- Y. W. Zhang, M. Z. Zhao, J. X. Liu, Y. L. Zhou and X. X. Zhang, J. Sep. Sci., 2015, 38, 475–482 CrossRef CAS PubMed.
- M. J. Kailemia, L. R. Ruhaak, C. B. Lebrilla and I. J. Amster, Anal. Chem., 2014, 86, 196–212 CrossRef CAS PubMed.
- W. Morelle and J. C. Michalski, Nat. Protoc., 2007, 2, 1585–1602 CrossRef CAS PubMed.
- T. W. Powers, E. E. Jones, L. R. Betesh, P. R. Romano, P. Gao, J. A. Copland, A. S. Mehta and R. R. Drake, Anal. Chem., 2013, 85, 9799–9806 CrossRef CAS PubMed.
- C. Dai, L. H. Cazares, L. Wang, Y. Chu, S. L. Wang, D. A. Troyer, O. J. Semmes, R. R. Drake and B. Wang, Chem. Commun., 2011, 47, 10338–10340 RSC.
- H.-J. Gabius, S. André, J. Jiménez-Barbero, A. Romero and D. Solís, Trends Biochem. Sci., 2011, 36, 298–313 CrossRef CAS PubMed.
- W. Zhao, M. M. Ali, M. A. Brook and Y. Li, Angew. Chem., Int. Ed., 2008, 47, 6330–6337 CrossRef CAS PubMed.
- R. C. Bailey, G. A. Kwong, C. G. Radu, O. N. Witte and J. R. Heath, J. Am. Chem. Soc., 2007, 129, 1959–1967 CrossRef CAS PubMed.
- M. W. Duncan, H. Roder and S. W. Hunsucker, Briefings Funct. Genomics Proteomics, 2008, 7, 355–370 CrossRef CAS PubMed.
- C. F. Higgins, Nature, 2007, 446, 749–757 CrossRef CAS PubMed.
- H. Ma, L. Cheng, K. Hao, Y. Li, X. Song, H. Zhou and L. Jia, PLoS One, 2014, 9, e85113 Search PubMed.
- A. D. Elbein, Annu. Rev. Biochem., 1987, 56, 497–534 CrossRef CAS PubMed.
- D. A. Greer and S. Ivey, Biochim. Biophys. Acta, 2007, 1770, 1275–1282 CrossRef CAS PubMed.
- J. C. M. De-Freitas, L. G. Bastos, C. A. Freire-Neto, B. Du Rocher, E. S. F. W. Abdelhay and J. A. Morgado-Diaz, J. Cell. Biochem., 2012, 113, 2957–2966 CrossRef PubMed.
Footnote |
| † Electronic supplementary information (ESI) available. See DOI: 10.1039/c6sc00215c |
| This journal is © The Royal Society of Chemistry 2016 |

