 Open Access Article
Creative Commons Attribution 3.0 Unported Licence
Elastic cavitation and fracture via injection†
Shelby B.
Hutchens
 *a,
Sami
Fakhouri
b and
Alfred J.
Crosby
*b
aDepartment of Mechanical Science and Engineering, University of Illinois Urbana-Champaign, Urbana, IL, USA. E-mail: hutchs@illinois.edu; Tel: +1-217-300-0412
bDepartment of Polymer Science and Engineering, University of Massachusetts Amherst, Amherst, MA, USA. E-mail: crosby@mail.pse.umass.edu; Tel: +1-413-577-1313
First published on 25th January 2016
Abstract
The cavitation rheology technique extracts soft materials mechanical properties through pressure-monitored fluid injection. Properties are calculated from the system's response at a critical pressure that is governed by either elasticity or fracture (or both); however previous elementary analysis has not been capable of accurately determining which mechanism is dominant. We combine analyses of both mechanisms in order to determine how the full system thermodynamics, including far-field compliance, dictate whether a bubble in an elastomeric solid will grow through either reversible or irreversible deformations. Applying these analyses to experimental data, we demonstrate the sensitivity of cavitation rheology to microstructural variation via a co-dependence between modulus and fracture energy.
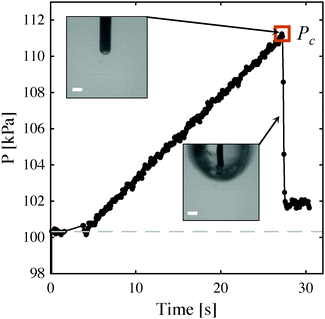
Rapid, 3-D mechanical characterization of soft solids provides information necessary for the elucidation of health-related mechanisms, e.g., mechanotransduction in cells and tissue property evolution during onset of disease. A recently explored technique referred to as cavitation rheology (CR)1–10 or the maximum bubble pressure (MBP)11 method provides a promising avenue for quickly and inexpensively obtaining this data, especially in soft-solids whose properties can be otherwise difficult to measure using traditional techniques. Past CR measurements in a variety of synthetic, polymeric materials at a range of length scales have been found to correlate with elastic modulus.1,2,4,7,11 These measurements arise from an instability governed mechanism that causes the sudden, rapid, and temporarily unstable expansion of a pressurized void at the tip of an embedded needle (Fig. 1). This expansion results in a pressure drop within the system and thus a characteristic peak pressure, Pc, which can, notably, be obtained without monitoring deformation visually.
To date, only elementary analyses have been applied to these observations, with a limited quantitative understanding as to when and how the observed deformation mechanisms relate to the measured data.2 Although the morphology of the expanded voids clearly indicate that fracture can be a dominant growth mechanism for certain materials, application of the simple ‘cavitation equation’2 based only on elastic deformations can typically yield modulus values having less than 15% error. In contrast, correlating Pc to the fracture toughness, Gc, results in much greater error. This result points to the need for further understanding into how materials properties, including nonlinear behavior, control unstable void growth in an elastomeric solid. This insight is critical for enhancing the implementation of CR in biological tissues, where nonlinear mechanics play a dominant role. More generally, resolving apparent conflict between the observed deformation path and the critical pressure is important for understanding how damage is incurred in soft materials, a topic that has been studied extensively, most notably by Alan Gent, though many questions remain.
In their 1959 paper, Gent and Lindley12 observed a discontinuity in the load-displacement response of rubber disks under uniaxial tension. Noting that the predominant stress state in this testing geometry is hydrostatic, they attributed the discontinuity to the rapid expansion of pre-existing spherical defects or voids within the sample. These observations ignited a discussion of cavitation (and fracture) within an elastomeric solid (e.g.ref. 13–15) that continues even now.16,17 Our extension of this discussion in the context of CR provides new understanding of how elasticity, fracture toughness, and the full system thermodynamics, control void growth mechanics in soft solids.
In the following work, we utilize a simplified, spherical geometry under quasi-static loading in order to quantitatively determine the interplay between elastic and fracture mechanisms and the material parameters and behaviors that affect that interplay, in particular strain hardening. Knowledge gained from understanding these mechanisms individually is then unified into a mechanism map of anticipated behavior from which predictions for Pc are made for three distinct experimental systems. Specifically, we follow previous derivations for a spherical void in an incompressible neo-Hookean solid.18–20 We incorporate energy-based fracture criteria for the void in order to determine the bubble deformation at which fracture occurs. From these models, we construct mechanism maps for two limiting-case loading scenarios. The resulting maps predict the critical pressure Pc as a function of the non-dimensionalized elastocapillary length γ/μA and relevant geometric and material parameters. The elastocapillary length γ/μ is the ratio of the surface tension, γ, to the elastic shear modulus, μ. A is the initial radius of the void, which we assume is equivalent to the needle radius used in CR. The relationship between these length scales is thus essential for interpreting experimental Pc data as an intrinsic material property.
1 Cavitation rheology: boundary and loading conditions
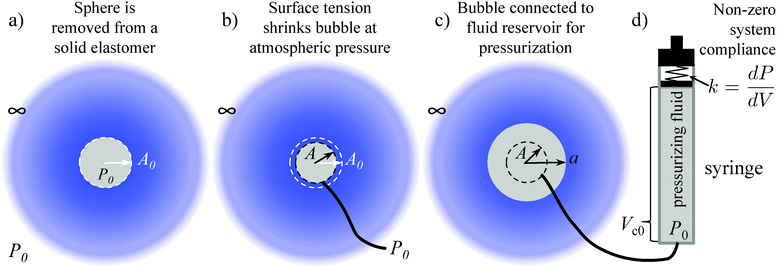
The details of CR experiments have been given previously.1–9,11,21 Essentially, a needle is embedded within a soft solid. This is followed by pressurization of the fluid within the needle that leads to the growth and eventual rapid, unstable expansion of a bubble at the tip of the needle (Fig. 1). For the analyses developed here, we use expressions for an incompressible neo-Hookean solid in consideration of space, but leave the derivation open to the incorporation of any isotropic solid defined by a free energy function. In addition to an incompressible, neo-Hookean solid, we show results for an incompressible, strain hardening solid described by a modified Yeoh model (Section 7 and Fig. S2, ESI†). We consider CR loading conditions that arise from two limiting cases for the choice of pressurizing fluid.In experiments, the pressurizing fluid has been either air or water1–8,11 and in both cases unstable expansion at a critical pressure Pc is observed. Because the fluid reservoir has an inherent stiffness, k, associated with it (due to rubber o-rings and pressure sensors), we approximate the system as shown in Fig. 2c and d. This approximation leads to two limiting cases for loading conditions based on simplifications when the fluid is either a gas (ideal gas) or a liquid (incompressible fluid). In the case of the former, Zhu et al.20 previously showed that sudden elastic cavity growth (elastic cavitation) requires both a sufficiently large bubble surface energy, γ, and an initial fluid reservoir volume, Vc0, capable of achieving a pressure that can overcoming the surface energy contribution the bubble. Their system was comprised of a reservoir of ideal gas molecules and assumed no system compliance. Here we use this same framework, setting system stiffness equal to infinity (compliance equal to zero) in the case of a gas pressurizing fluid. This approximation is valid even for a system with finite stiffness due to the fact that the ratio of the system stiffness, k = dP/dV|spring, (k ≈ 1 kPa μL−1, Fig. S7, ESI†) to the ‘stiffness’ of an ideal gas, dP/dV|gas, at the onset of cavitation is much greater than one in all cases except that of a high modulus material (∼1 MPa) combined with a small reservoir (<1 mL). Materials with such high moduli are readily characterized using traditional techniques and therefore outside the main scope of CR. This stiffness ratio is determined for a chamber volume Vc (initially having volume Vc0 at atmospheric pressure P0) evaluated at a critical pressure Pc that scales roughly with the material shear modulus so that kVc0P0/Pc2 ≈ kVc0P0/μ2 ≫ 1. Thus, for air as the pressurizing fluid, we will simply follow Zhu et al.20 derivation. However, we include a small redefinition of the initial state of the system that allows for experimental comparison as will be discussed in the next section.
As shown by Zhu et al.,20 the gas provides the only negative contribution to the free energy of the system just described (i.e., a system having an infinite stiffness spring) and thus enables its ability to cavitate. Application of this same model to an incompressible fluid4 therefore, cannot predict elastic cavitation. Because addressing both gas and system compliance contributions simultaneously becomes unwieldy, our second limiting case is simply that of a spring of finite stiffness only (no gas reservoir).19 We demonstrate that this system compliance provides the necessary negative free energy contribution to allow for elastic cavitation with an incompressible pressurizing fluid. In summary, our two limiting cases for loading conditions become: a reservoir of ideal gas molecules (no spring) and a linear spring of stiffness k = dP/dV. Note that in neither case are these load or displacement-controlled conditions. (Displacement-controlled, or more accurately volume-controlled, testing applies only to the case of a spring of infinite stiffness combined with an incompressible fluid.) Similar to a cantilever-type, ‘displacement-controlled’ compression test, the compliance of either the gas or the system (like the centilever) mediates any deformation of the test sample. In CR, that effect is an essential part of the observed, catastrophic response that leads to Pc.
2 Elastic model
We assume a spherical void geometry within an infinite, incompressible hyperelastic solid. (Previous calculations found that the needle-tip geometry plays a minimal role in the elastic pressure–stretch response of the void.21) The void is connected to a chamber representing the syringe via a hypothetical fluid transporter20 (Fig. 2c and d); a linear spring accounts for loading system compliance (Fig. 2d and Fig. S7, ESI†). As mentioned above, this geometry and loading (without the spring) has been considered previously for the elastic deformation regime; however, the initial configuration and pressure condition used was not compatible with CR, making quantitative comparisons cumbersome.20 To address this issue, we define the bubble deformation, Λ, as the bubble radius a normalized by the initial void radius A, | (1) |
The pressure–stretch (P vs. Λ0) and free energy–stretch (Ftotvs. Λ0) responses20 previously derived without this correction are then simply modified through the substitution of Λ0 (eqn (1)) such that they become functions of Λ given that Λeq = Λeq(γ/μA, constitutive model parameter). For an incompressible neo-Hookean solid with strain energy function W = μ(I − 3)/2 (where I = 2Λ02 + Λ0−4: the first strain invariant of the right Cauchy–Green tensor) and assuming an ideal gas pressurizing fluid, these expressions are:
 | (2) |
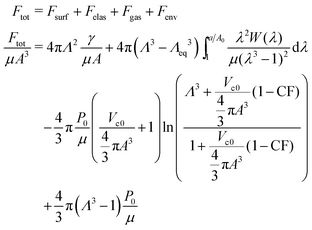 | (3) |
For the incompressible fluid approximation accounting for system stiffness, k, the expression for Fgas is replaced with one for the spring, Fspr.
 | (4) |
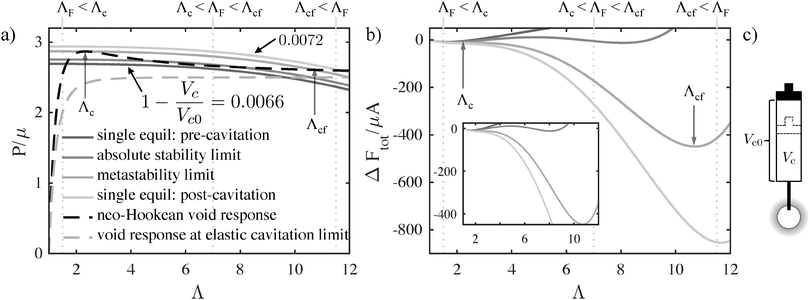
We obtain stability limits, and thus Pc and deformation at cavitation, Λc, from the expression for the free energy of the system (eqn (3)). Free energetic equilibria (dFtot/dΛ = 0) correspond to the intersection of the void pressure and the gas pressure as a function of void deformation (Fig. 3), essentially amounting to a force balance. (The gas is replaced by a spring in the case of incompressible fluid loading, Fig. S3, ESI.†) In order for elastic cavitation to occur, there must be at least two equilibrium deformations such that it is thermodynamically favorable for the system to undergo a transition from the smaller to the larger deformed bubble while passing through a thermodynamically unstable (d2Ftot/dΛ2 < 0) range of deformation.18
Fig. 3 illustrates how an increasingly compressed reservoir encounters two types of limits for cavitation that satisfy these criteria. First, the system encounters equilibrium (the absolute stability limit), at which the free energy of the smaller and larger bubble become equal (d2Ftot/dΛ2 > 0, dFtot/dΛ = 0, Ftot(Λsmall) = Ftot(Λlarge)), but are separated by an energetic barrier (d2Ftot/dΛ2 < 0, dFtot/dΛ = 0). Further compression leads to the metastability limit, in which the energetic barrier between the two states vanishes (d2Ftot/dΛ2 = dFtot/dΛ = 0). We use the latter to predict Pc as thermal fluctuations provide little perturbation to overcome an energetic barrier in a macroscale system. Thus, we determine the ability of the system to elastically cavitate for any given criteria, γ/μA, P0/μ, and Vc0/(4/3πA3) (or kA3/μ for the incompressible fluid).
Non-zero surface energy is required in order to produce an elastic cavitation response in both loading condition cases. The minimum amount of surface energy is determined by the dimensionless ratio, γ/μA, which must be greater than ≈1.4953, the value at which a peak in the pressure (P)–deformation (Λ) curve (dP/dΛ = 0) no longer exists for real values of Λ (for an incompressible, neo-Hookean solid). (Examples of P vs. Λ for which a peak exists (black dashed) and at the limit where the peak disappears (gray dashed) are shown in Fig. 3a.)
When elastic cavitation is possible, we calculate Pc, Λc (the deformation at the onset of elastic cavitation), and Λcf (the final deformed state after cavitation). (The latter are shown with gray arrows in Fig. 3 where Λcf ≈ 11.) This model also allows us to determine the equilibrium void radius as a function of increasing compression, CF, as shown by the progression of increasing compression fraction curves in Fig. 3a. With this series of equilibirium deformation values, we replicate the experimentally observed pressure vs. compression curves displaying a sudden, discontinuous drop in pressure at Pc (Fig. 1 and Fig. S1, ESI†). Also notable from this analysis is the fact that Pc for elastic cavitation is well approximated by the simple ‘cavitation equation’,
 | (5) |
3 Fracture model
As a first approximation, we employ a fracture model proposed by Gent and Wang14 and later revisited by Diani23 and Lin and Hui15 in which Griffith criteria are applied to a hyperelastic spherical void (neo-Hookean in their case). Following Diani's23 treatment, the crack surface is taken to be the change in surface area of the void after the void has reached some critical radius at which fracture occurs,23i.e., a “spherical” crack like that originally proposed by Williams and Schapery.24 This approach is not intended to imply the actual formation of a spherical crack, but rather we aim to approximate failure of the bubble as an inner-shell damaged zone surrounding the surface of the sphere and having the complete loss of any elastic contribution. We ignore effects that the embedded needle might have on fracture geometry based on observations of the fractured surface in very soft solids. In very soft gels (μ < 10 kPa), fissures form a web throughout the ‘bubble’ surface with the needle typically centered within the bubble. We take this to imply that fracture must be initiated from several locations at once. We should note, however, that scattered observations seem to indicate fracture geometry is dependent on the stiffness of the material. Stiffer gels and elastomers typically have more penny-shaped ‘bubbles’ (μ ∼ MPa) or what appears to be delamination up the sides of the needle based on the final tip position at the bottom of a fractured void. As we are focused on the behavior of softer gels, we utilize a spherical approximation here. However, Lin and Hui15 found that the analytical spherical crack geometry relation actually provides a better estimate of fracture energy for the growth of a penny shaped crack than does Gent's penny-shaped crack approximation. Thus, the spherical crack geometry provides both a simple first approximation and would seem to apply to two elastic moduli extrema for CR (<10 kPa and ∼1 MPa). A more detailed study of the crack geometries that form and how they affect the measured Pc is part of an ongoing study.The model we implement here, following Gent and Wang14 and Williams and Schapery,24 is similar to Griffith's analysis, with a strain energy release rate G for an incompressible, neo-Hookean solid:
 | (6) |
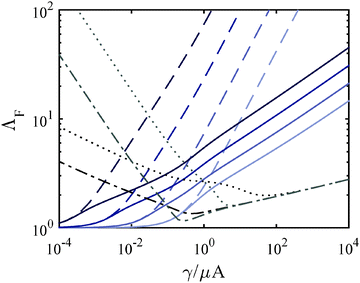
Λ F depends on the constitutive response of the material and Gc. We address the motivation behind varying these elements in Sections 7 and 8, however we give a brief overview of their effect on ΛF here. The incorporation of strain hardening, decreases ΛF overall as a function of γ/μA (solid lines). Fig. 4 also demonstrates that the monotonic dependence of ΛF on γ/μA disappears when Gc is no longer assumed to be constant over order of magnitude changes in γ/μA (due to a dependence on μ). Assuming that Gc increases with increasing μ, it follows that ΛF eventually increases with decreasing γ/μA as shown.
4 Mechanism map
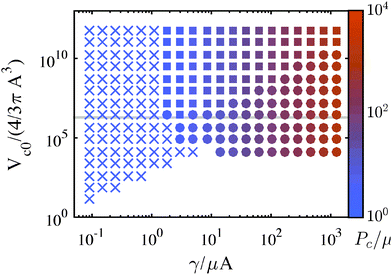
Combining the elastic and fracture models outlined above, we build a predicted mechanism map for any given CR test or any series of tests (e.g., Fig. 5). This is accomplished by first considering whether or not an elastic cavitation event is possible. Within this regime fracture may also occur. The relative magnitude of ΛF with respect to the stretch at cavitation, Λc determines the predicted mechanism. The magnitude of ΛF falls into one of three categories: ΛF < Λc (fracture before cavitation); Λc < ΛF < Λcf (cavitation followed by fracture); or ΛF > Λcf (cavitation only). The vertical dashed lines in Fig. 3 provide examples of these mechanism categories for three hypothetical ΛF values. Outside of the cavitation regime, fracture is the only possible instability mechanism. The region in Fig. 5 where no symbols are shown indicates that the energy storage capacity of the system (either gas reservoir or spring) is too small to either overcome the peak in the pressure–deformation curve and/or too small to deform the void to ΛF. Following this categorization procedure, we determine the dominant deformation mechanism for different combinations of materials properties, void sizes, and compression volumes. These results are represented as a deformation mechanism map for an incompressible, neo-Hookean solid in Fig. 5. A mechanism map must hold at least one length scale constant, either elastocapillary (by holding μ constant since γ varies little) or needle/bubble initial radius A. This arises from the fact that the dimensionless groups in eqn (3) and (6) have non-separable dependencies on both μ and A. Thus, a single map corresponds to a series of experimental tests either of varying material composition/condition (μ) and constant needle radius or varying needle radius with constant material composition/condition (μ) (Fig. S4–S6, ESI†). Therefore all deformation scenarios may not be present in all mechanism maps.Most CR experiments have been performed with relatively large gas volumes, putting them toward the top of Fig. 5, above the gray line that corresponds to Vc0 = 1 mL. As discussed above, the elastic cavitation limit that exists at finite γ/μA due to the loss of a peak in the P vs. Λ response (Fig. 3a) clearly divides the mechanism governing Pc. Needle radii and/or μ must be small for Pc values to have a chance to fall within the elastic cavitation regime.
An implication for failure not only in CR but in soft solids in general that follows from this work is that even when deformation is accommodated by elastic cavitation events, it is likely that these elastically initiated events lead almost instantaneously to localized fractures. Whether elastic cavitation can occur without fracture depends on the compliance of the loading environment, e.g., the chamber stiffness k or volume V0, sample size (in the case of dead-loading),18 or machine compliance,19 with less compliance/smaller samples leading to an increased likelihood of microfracture. The extent of the fracture that occurs is dependent on dynamics and fracture geometries not studied here.
5 Correlation with experiments
To compare the predictions of Fig. 5a and the associated model with experiments, a series of CR experiments were performed in a thermally reversible triblock co-polymer gel using a single needle radius. The temperature dependent (15–40 °C) Pc data collected from the gel (7 wt% PMMA–PnBA–PMMA with block lengths of 25, 116, and 25 kg mol−1 (Kuraray) dissolved in 2-ethyl-1-hexanol) using a 109 ± 3.4 μm radius needle are plotted in Fig. 6. To demonstrate both the sensitivity of the CR method and the variability that arises from changes in microstructure, we also include two sets of constant needle radius data taken from the literature, HSA Organogels11 (low molecular mass gelators formed via non-covalent assembly, 30–80 °C, 0.25 wt%) and PAAm hydrogels2 (cross-linked, volume fraction 0.022–0.088). Modulus values are obtained from shear rheology (triblocks, HSA) or contact mechanics (PAAm) data. The solid black line in Fig. 6 denotes the cavitation equation (eqn (5)). An isochor from Fig. 5 corresponding to V0 = 1 mL leads to the prediction of the gray connected line in Fig. 6 (small filled symbols indicating cavitation and fracture as in Fig. 5). Note how closely the data falls to the cavitation equation, although scatter in the data (illustrated with standard deviation error bars) clearly show the cavitation equation is not an exact fit. Thus, while the cavitation equation can generally predict μ (to within 15%) for a soft solid, the CR technique is clearly sensitive to other mechanical properties governing material behavior and Pc response.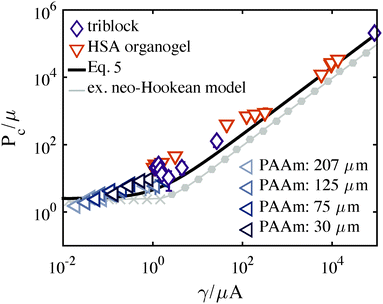 | ||
| Fig. 6 P c vs. γ/μA for the three datasets: (purple-diamonds) triblock copolymer gels (PAA–PnBA–PAA), (orange-inverted triangles) HSA organogels,11 and (blue-left triangles) PAAm hydrogels.2 A neo-Hookean model prediction taken from Fig. 5a is shown with a gray line and symbols representing the governing mechanism as outlined in the Fig. 5 caption. The cavitation equation (eqn (5)) is shown with a solid black line. | ||
While the neo-Hookean constitutive relation provides a starting place for exploring hyperelastic behavior, its entropic spring assumption breaks down near material failure, as the network is fully stretched. Fig. 6 demonstrates a clear deficiency in the neo-Hookean model. Several experimental values lie above both the cavitation equation and the isochor prediction for Vc0 = 1 mL. (The gap between these two predictions at high γ/μA arises purely from geometry; the cavitation equation accounts for a spherical-cap like bubble whereas our model is entirely spherical.) The neo-Hookean prediction (Fig. 6, gray line) uses Gc = 20γ, however, even for increasingly tough materials Pc can never exceed the cavitation equation whose magnitude aligns with the peak in the bubble's pressure–stretch relation (Fig. 3a). Thus, the data clearly support the necessity of accounting for strain hardening, especially for the triblock gels,25 prior to failure. Further, as written, the equations in Sections 3 and 4 assume fixed Gc over the set of conditions spanned by a mechanism map. Such an assumption of constant Gc is accurate for a constant μ map, but in the case of order of magnitude variations in μ in a constant A map, Gc will not remain constant, as becomes clear on an Ashby plot for soft solid materials.26 The next two sections detail the incorporation of both strain hardening and Gc variation.
6 Strain hardening
We utilize a modified Yeoh constitutive relation in order to include strain hardening at larger stretch. | (7) |
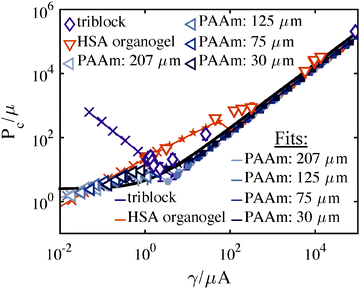
Further, Fig. 7a demonstrates that strain hardening leads to Pc predictions that lie above the cavitation equation threshold. Fig. 7a is generated using the assumption of constant Gc but spans a range of γ/μA values while ‘needle radius’ (corresponding to initial void radius) is held constant at A = 100 μm. The result of this assumption is that a negative slope in Pcvs. γ/μA (for constant A) cannot be predicted. In order to do so, and therefore capture the behavior observed in the triblock data shown in Fig. 6, we must consider the possibility of a Gc dependence on μ. (Experimental conditions are critical for interpreting Pc data. If μ, rather than A is held constant, no negative slope in Pcvs. γ/μA is observed, Fig. S10, ESI.†)
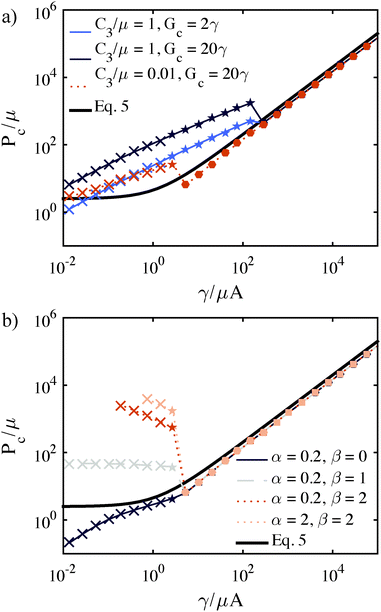 | ||
| Fig. 7 Normalized Pc values predicted for varying constitutive behavior and Gc for a parameter series at constant needle radius (varying modulus). The cavitation equation (eqn (5)) is the black solid curve in both plots. (a) Effect of increasing strain-hardening corresponding to an increase in C3/μ. Light and dark blue curve illustrates associated effect of increases in Gc (increased Pc) combined with strain hardening. (A = 100 μm, Vc0 = 1 mL, γ = 27.7 mN m−1). (b) Predictions after incorporation of the power law dependence for Gc (eqn (9)). Increases in α tend to shift the Pc within the fracture regime up. Increases in β tend to make the slope within the fracture regime negative. (A = 100 μm, Vc0 = 1 mL, γ = 27.7 mN m−1, C3/μ = 0.01.) | ||
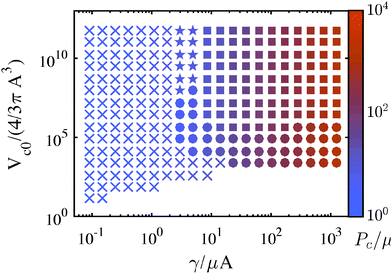 | ||
| Fig. 8 Maps detailing the mechanism leading to observation of a Pc during a CR experiment using the modified Yeoh Model. ‘×’ corresponds to fracture, ‘●’ to cavitation, ‘■’ to cavitation followed by fracture, and ‘★’ to a negligible pressure drop during cavitation such that Pc is governed by fracture. The magnitude of Pc is shown via color gradient corresponding to the colorbar on the right. This map was generated for a modified Yeoh material with C3 = 0.01 and the same conditions as in Fig. 5. | ||
7 Determining Gc
Measurements of Pc for fracture events should provide a means of determining Gc. If we assume linear fracture mechanics, then the relation between Gc and Pc for this spherical geometry is:2 | (8) |
To account for this co-dependency, we can assume a relationship between Gc and μ, based on experimental data (e.g.ref. 26 and 31):
| Gc = αμβ | (9) |
It is important to note that for the modified Yeoh relation used here, the fit value α and thus Gc is dependent on C3; while the parameter β is relatively insensitive to C3. This makes the accurate choice of constitutive relation an important part of the interpretation of a quantitative Gc. For this reason our reported Gc values should still be taken as estimates, though, as stated above, we believe these estimates to be more accurate than using the linear approximation. To clarify the role that β plays in replicating experimental results, one must understand its effect on the deformation at fracture, ΛF. For increasing power, β, ΛF becomes increasingly large at low γ/μA (Fig. 4). This increased ΛF corresponds to an increased Pc in a strain hardening material model as shown in Fig. 7b. For very large values of β, ΛFA3 becomes large with respect to the initial chamber size Vc0 and our model predicts that no fracture and thus no Pc will be observed.
As an aside, the unexpected cubed relation between Gc and μ that is responsible for the large deviation of the triblock Pc data (Fig. 9) from the cavitation equation (the initial driving force for this work) is likely due to the thermally reversible nature of this material's crosslinks. The glass transition temperature, Tg for the PMMA endblocks is just above room temperature, likely resulting in the large change in Pc as a function of temperature right around 20–25 °C (Fig. S8, ESI†) that leads to β = 3.0. We interpret this as the result of a sharp decrease in chain pullout forces over a region of constant elastic response due to relatively unchanged chain configuration between crosslinks (Fig. S9, ESI†). The Gc dependence on temperature is significantly stronger than has been predicted via simulations of pull-out from a purely glassy state,33 suggesting a transition from pull-out in a condensed state near the gel point to pull-out from a glassy state at lower temperatures.
8 Conclusions
In summary, we outline a framework for understanding the physical origins of CR and, more importantly, provide the means by which to acquire quantitative fracture energies from that data. Our side-by-side comparison of three different materials systems also illustrates the sensitivity of the technique to microstructural variation when series of datum (of varying composition or at varying environmental conditions) are acquired. In these three systems, ‘cavitation equation’ estimates for modulus have less than 15% error, making CR useful for a broad range of modulus measurement in geometrically unconfined samples. However, the importance of knowing which governing mechanism leads to an unstable pressure drop and when non-linearities are likely to affect mechanical response becomes critical when determining Gc. This sensitivity of CR to both scale and microstructure points toward the physical intuition that might be gained from using this technique for in vivo measurements of living tissues.Nomenclature
| a | Deformed bubble radius |
| A | Initial bubble radius (equivalent to needle radius) |
| A 0 | Zero strain energy bubble radius |
| α | Power law coefficient |
| β | Power law power |
| C 3 | Phenomenological parameter in Yeoh constitutive relation |
| CF | Gas compression fraction, 1 − Vc/Vc0 |
| F tot | Total free energy of the bubble + system + surroundings |
| G | Strain energy release rate |
| G c | Critical strain energy release rate |
| γ | Surface energy |
| I | First strain invariant of the right Cauchy–Green tensor |
| k | Stiffness of the fluid pressurizing setup |
| λ F | Experimentally measured strain at failure |
| Λ | Deformation of the bubble: a/A |
| Λ 0 | Hoop stretch; zero strain energy bubble deformation: a/A0 |
| Λ c | Deformation of the bubble at Pc due to cavitation |
| Λ cf | Final deformation of the bubble after elastic cavitation |
| Λ eq | Zero strain energy bubble deformation due to surface energy: A/A0 |
| Λ F | Deformation of the bubble at Pc due to fracture |
| μ | Linear elastic shear modulus |
| P | Pressure |
| P 0 | Pressure of the environment |
| P c | Critical pressure at which sudden bubble expansion occurs |
| V c | Chamber volume |
| V c0 | Initial chamber volume |
| W | Strain energy function |
Acknowledgements
The authors would like to thank the Army Research Laboratory for funding through Cluster M of the Center for University of Massachusetts Industry Research on Polymers and NSF-DMR 1304724.References
- J. A. Zimberlin, N. Sanabria-DeLong, G. N. Tew and A. J. Crosby, Soft Matter, 2007, 3, 763 RSC.
- S. Kundu and A. J. Crosby, Soft Matter, 2009, 5, 3963 RSC.
- J. A. Zimberlin, J. J. McManus and A. J. Crosby, Soft Matter, 2010, 6, 3632 RSC.
- J. A. Zimberlin and A. J. Crosby, J. Polym. Sci., Part B: Polym. Phys., 2010, 48, 1423–1427 CrossRef CAS.
- J. Cui, C. H. Lee, A. Delbos, J. J. McManus and A. J. Crosby, Soft Matter, 2011, 7, 7827 RSC.
- A. J. Crosby and J. J. McManus, Phys. Today, 2011, 64, 62 CrossRef.
- A. Delbos, J. Cui, S. Fakhouri and A. J. Crosby, Soft Matter, 2012, 8, 8204–8208 RSC.
- M. S. Chin, B. B. Freniere, S. Fakhouri, J. E. Harris, J. F. Lalikos and A. J. Crosby, Plast. Reconstr. Surg., 2013, 131, 303e–305e CrossRef CAS PubMed.
- L. Pavlovsky, M. Ganesan, J. G. Younger and M. J. Solomon, Appl. Phys. Lett., 2014, 105, 114105 CrossRef PubMed.
- A. Blumlein and J. J. McManus, J. Mater. Chem. B, 2015, 3, 3429–3435 RSC.
- P. Fei, S. J. Wood, Y. Chen and K. A. Cavicchi, Langmuir, 2015, 31, 492–498 CrossRef CAS PubMed.
- A. N. Gent and P. B. Lindley, Proc. R. Soc. London, Ser. A, 1959, 249, 195 CrossRef.
- J. M. Ball, Philos. Trans. R. Soc., A, 1982, 306, 557–611 CrossRef.
- A. N. Gent and C. Wang, J. Mater. Sci., 1991, 26, 3392–3395 CrossRef.
- Y. Y. Lin and C.-Y. Hui, Int. J. Fract., 2004, 126, 205–221 CrossRef CAS.
- V. Lefevre, K. Ravi-Chandar and O. Lopez-Pamies, Int. J. Fract., 2013, 192, 1–23 CrossRef.
- A. Hamdi, S. Guessasma and M. Nat Abdelaziz, Mater. Des., 2014, 53, 497–503 CrossRef CAS.
- J. Dollhofer, A. Chiche, V. Muralidharan, C. Creton and C.-Y. Hui, Int. J. Solids Struct., 2004, 41, 6111–6127 CrossRef.
- V. Muralidharan, C.-Y. Hui, J. Dollhofer, C. Creton and Y. Lin, Int. J. Adhes. Adhes., 2006, 26, 117–124 CrossRef CAS.
- J. Zhu, T. Li, S. Cai and Z. Suo, J. Adhes., 2011, 87, 466–481 CrossRef CAS.
- S. B. Hutchens and A. J. Crosby, Soft Matter, 2014, 10, 3679–3684 RSC.
- A. N. Gent and D. A. Tompkins, J. Polym. Sci., Part A-1: Polym. Chem., 1969, 7, 1483–1487 CAS.
- J. Diani, Int. J. Fract., 2001, 112, 151–161 CrossRef.
- M. L. Williams and R. A. Schapery, Int. J. Fract., 1965, 1, 64–72 CrossRef CAS.
- S. M. Hashemnejad and S. Kundu, Soft Matter, 2015, 11, 4315–4325 RSC.
- J. Li, Z. Suo and J. J. Vlassak, J. Mater. Chem. B, 2014, 2, 6708–6713 RSC.
- M. E. Seitz, D. Martina, T. Baumberger, V. R. Krishnan, C.-Y. Hui and K. R. Shull, Soft Matter, 2009, 5, 447 RSC.
- J. L. Li, R. Y. Wang, X. Y. Liu and H. H. Pan, J. Phys. Chem. B, 2009, 113, 5011–5015 CrossRef CAS PubMed.
- J.-Y. Sun, X. Zhao, W. R. K. Illeperuma, O. Chaudhuri, K. H. Oh, D. J. Mooney, J. J. Vlassak and Z. Suo, Nature, 2012, 489, 133–136 CrossRef CAS PubMed.
- Y. Tanaka, K. Fukao and Y. Miyamoto, Eur. Phys. J. E: Soft Matter Biol. Phys., 2000, 401, 395–401 CrossRef.
- H. J. Kong, E. Wong and D. J. Mooney, Macromolecules, 2003, 36, 4582–4588 CrossRef CAS.
- G. J. Lake and A. G. Thomas, Proc. R. Soc. London, Ser. A, 1967, 300, 108–119 CrossRef CAS.
- M. Bulacu and E. van der Giessen, EPL, 2011, 96, 49901 CrossRef.
Footnote |
| † Electronic supplementary information (ESI) available. See DOI: 10.1039/c5sm02055g |
| This journal is © The Royal Society of Chemistry 2016 |

