Job-sharing cathode design for Li–O2 batteries with high energy efficiency enabled by in situ ionic liquid bonding to cover carbon surface defects†
Peili
Lou
ab,
Chilin
Li
*a,
Zhonghui
Cui
a and
Xiangxin
Guo
*a
aState Key Laboratory of High Performance Ceramics and Superfine Microstructure, Shanghai Institute of Ceramics, Chinese Academy of Sciences, Shanghai 200050, China. E-mail: chilinli@mail.sic.ac.cn; xxguo@mail.sic.ac.cn
bUniversity of Chinese Academy of Sciences, Beijing, 100039, China
First published on 17th November 2015
Abstract
The difficult achievement of high round-trip energy efficiency or low charge overpotential has retarded Li–O2(air) batteries in real applications. Although much effort has been focused on exploring novel catalysts, their potential effects are usually counteracted by a quick passivation of the electrode as a consequence of side reactions, which likely contribute to the widely observed high-voltage reversibility (e.g. >4 V). Here, we report a job-sharing design of a carbon-based cathode, Ru-IL (ionic liquid)–CNT (carbon nanotube), with fine Ru nanodots anchored on the IL-decorated CNT surface. The subnanometer IL cation linker is crucial to seal carbon surface defects without sacrificing Li+/e− charge transfer and therefore efficiently suppresses the occurrence of side reactions. This charged decoration guarantees that Ru functions as the microstructure promoter to stabilize highly disordered Li2O2. It enables achievement of high energy efficiency (80–84%) Li–O2 batteries characterized by a substantial charge plateau with an extremely low overpotential of 0.18 V. Even by using the mode of voltage cut-off, a reversible capacity around 800–1000 mA h g−1 is maintained for more than 100 cycles. When the reversible capacity is limited to 500 mA h g−1, the cycling number can reach up to at least 240 cycles. The disentangled CNT networks, loose precipitation of nanostructured products and high donor number electrolytes allow thick electrode fabrication (8 mg cm−2), leading to a high areal capacity of 3.6–7.6 mA h cm−2. Our results indicate a defect-inspired strategy to bury undesired defect sites in the original electrode framework and to electrochemically synthesize the stable defect-rich Li2O2 product.
Introduction
Li–O2 batteries are expected to possess an extremely high theoretical specific energy of 3505 W h kg−1, which is almost one order of magnitude higher than that of today's Li-ion batteries.1,2 A desired product Li2O2 with a thermodynamic potential E0 = 2.96 V is always highly reactive with carbon, the commonly used cathode, and can promote the decomposition of most electrolytes, leading to the simultaneous formation of some side products (e.g. Li2CO3).3,4 These insulated byproducts would accumulate on the carbon surface and accelerate the passivation of the electrode. Such an ohmic loss results in a large charge overpotential ηcha more than 1 V (i.e. low round-trip energy efficiency of 60–70%) during the oxygen evolution reaction (OER).2 Since likely carbonate byproducts are electrochemically split around or above 4 V and the so-called catalyst additive is able to promote the decomposition of electrolytes or byproducts, it is difficult to distinguish the exact contribution on cycling reversibility at a high voltage (whether exclusively from desired products or involving byproducts).5,6 In addition, an overlarge capacity of the oxygen reduction reaction (ORR) is not always worthy of appreciation, as it is often accompanied by more byproduct deposition, which degrades the following reversibility. Therefore, a protocol of capacity cut-off is resorted to to alleviate the formation of byproducts, and to limit the growth or crystallization of Li2O2.7 The latter likely leads to the generation of the oxygen-rich LixOy stoichiometry (x < y) or Li-vacancy (VLi) rich Li2−zO2 (0 < z < 1).8,9 It would lower the electrode resistance due to the better ion/electron conductivity of nonstoichiometric or disordered Li2O2.10,11 Although the capacity cut-off method effectively improves the polarization and cyclability of Li–O2 batteries, it is still makeshift compared with the routine protocol of voltage cut-off. The use of metallic noncarbon cathodes (e.g. Au and TiC) appears to be an alternative to stabilize the reaction interfaces during the ORR and OER, although it is still unclear whether the true ‘catalysis’ exists to guarantee a low ηcha in these cases.12,13 However, one should note that the specific energy is moderate (<500 mA h g−1) owing to the heavy weight of these noncarbon support containing transition metals.Therefore, carbon-based cathodes are still the best choice in view of their light weight, high conductivity, large surface area and O2 channel flexibility,9,14 provided that the undesired intrinsic surface defects (which tend to trigger side reactions when in contact with Li2O2) can be removed or sealed. Recently, atomic layer deposition (ALD) has been adopted to deactivate the carbon surface by growing nano-scale Al2O3 islands on top.15 However, this complicated auxiliary process is not suitable for large-scale applications owing to its low production efficiency and high cost.16 Furthermore, the surface defect sites cannot be completely covered for a short deposition time. Otherwise, for longer deposition, a thicker insulation coating would seriously increase the electrode resistance. Therefore, a process-inherent conformal coating is highly desired. Most recently, an ionic solvate of dimethoxyethane (DME) and lithium nitrate (LiNO3) was discovered to enable its interaction with carbon active sites by electrochemical doping of nitrogen to form a pyridinic structure. However the deactivation of the carbon cathode is proved to be effective merely for few cycles under shallow discharge.17
Since the carbon material itself cannot significantly promote the lowering of the OER overpotential,3 it is usually required to load extra fine nanoparticles of the so-called catalyst or morphology promoter on the conductive carbon support.6,18 Such a construction of composite cathode is expected to be a potential solution to Li–O2 batteries with high energy efficiency. Nevertheless, to the best of our knowledge, a long-term cycling with near-E0 charging is never reported under a mode of voltage cut-off. Even resorting to a shallow capacity cut-off, few reports have achieved a LixO2–O2 (1 < x ≤ 2) reversibility at a low overpotential.15,19–23 We speculate that much effort on exploring novel catalysts has been counteracted by the unsuccessful deactivation of the carbon electrode. In our previous studies, we found that the imidazolium-based ionic liquid (IL) could serve as an interlayer between carbon nanotubes (CNTs) and fluoride nanoparticles, benefiting from the strong interaction between imidazolium cations and π-electrons of the carbon surface.24–26 Inspired by these results, in this work we utilize such a cation–π interaction to bond a task-specific IL layer with multi-wall CNTs (MWCNTs) to cover its intrinsic defect sites and improve the chemical stability of carbon-based composites. Sequentially, fine Ru nanoparticles are uniformly distributed on the IL-trapped CNT surface through an electrostatic interaction between the Ru precursor and the IL cation, which may also cap the surface of freshly formed Ru nanoparticles to protect them from aggregation.27 In contrast to the ALD method,15 this in situ coating of IL is conformal in a sub-nanometer thickness and is expected to seal more defect sites without the trade-off of electron transport from carbon. This one-pot method is also facile and scalable, and can be extended to various catalyst systems.27 For the first time we have achieved a long-term cycling (more than 100 cycles) of high energy-efficiency (∼84%) Li–O2 batteries without the limit of capacity cut-off in dimethyl sulfoxide (DMSO) electrolyte. We must emphasize that the early ηcha is as small as 0.18 V (vs. the GITT equilibrium potential as discussed later), which is comparable to that of the discharge overpotential ηdis (0.15 V). To the best of our knowledge, it is one of the smallest ηcha values reported so far.15,19,20 This result is benefitted from the cathode design in a job-sharing way, i.e. the IL trapping layer being responsible for mitigation of side reactions and nano-Ru for microstructure/morphology optimization of products. Our work also indicates that a large amount of viscous IL electrolyte or gel is not indispensable for stabilizing the reaction interfaces, provided that the electrode surface is sufficiently decorated by thin IL components.28,29
Results and discussion
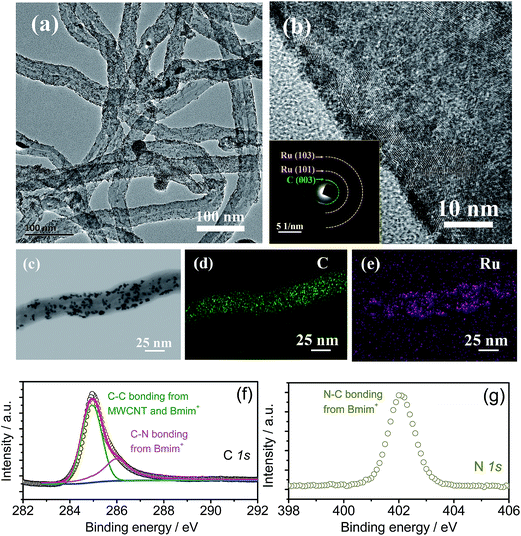
The synthesis procedure of the Ru-IL–CNT oxygen cathode is shown in the Experimental section and Fig. S1 in the ESI.† The IL 1-butyl-3-methyl imidazolium tetrafluoroborate (BmimBF4) was firstly added into the suspension of ethylene glycol (EG) and MWCNTs to disentangle and disperse CNT clusters and finally to cap individual CNTs through a cation–π interaction.30 Then a solution containing RuCl3 and HCl was added to precipitate Ru nanoparticles with the surface possibly decorated by IL through an electrostatic interaction between RuCl4− and Bmim+.27 As shown in the high-resolution transmission electron microscopy (HRTEM) images of the Ru-IL–CNT composite (Fig. 1a and b and S2†), numerous fine Ru nanodots as small as 2–3 nm uniformly anchor on the CNT surface without aggregation. Note that the CNTs used here do not require pretreatment by acid oxidation to introduce extra binding sites at the cost of severe structural damage and conductivity degradation. The homogeneous loading of Ru on the CNT support is also confirmed by bright- and dark-field scanning TEM (STEM) images with the corresponding elements (C and Ru) distinguished by energy dispersive spectrometer (EDS) elemental mappings (Fig. 1c–e and S3†). The O trace signal observed in EDS can be attributed to surface oxidation of Ru or O-contained gas adsorption during the measurement operation. The nanocrystalline structure of Ru is in accordance with the broad peaks of X-ray diffraction (XRD, Fig. S4†) as well as the vague rings of selected area electron diffraction (SAED, the inset of Fig. 1b). The IL capping layer is very thin (in the range of subnanometers) and indicated by the disordering and smoothing of the carbon surface observed from HRTEM and STEM images. More direct proof about the existence of IL trapping comes from surface-sensitive X-ray photoelectron spectroscopy (XPS) in Fig. 1f and g, which show evident characteristic peaks related to Bmim+ components (e.g. for C–N bonding 287 eV and 402 eV from C 1s and N 1s, respectively). The content of Ru is estimated to be about 19.7 wt% in the Ru-IL–CNT composite from EDS results. The Ru-IL–CNT displays a macroporosity-like feature with a surface area of 79 m2 g−1 from BET measurements as shown in Fig. S5.†If IL doesn't participate in the nucleation process of Ru, the formed Ru particles would become larger (around 4–5 nm, see TEM in Fig. S6†) as shown in the IL-free Ru-CNT sample as well as the sample where IL is added into EG after Ru nucleation (named Ru-CNT-IL). Owing to the lack of IL bonding to the CNT surface, the electrostatic interaction between RuCl4− and Bmim+ does not exist during nucleation, leading to a more remarkable grain growth and crystallization of Ru in both the control samples (Ru-CNT and Ru-CNT-IL). These Ru crystallites are loosely attached to CNTs with aggregation to a certain extent. The crystallinity improvement is also indicated by the corresponding XRD and SAED patterns (in Fig. S4 and S6† respectively) with intensified polycrystalline diffraction peaks and dots.
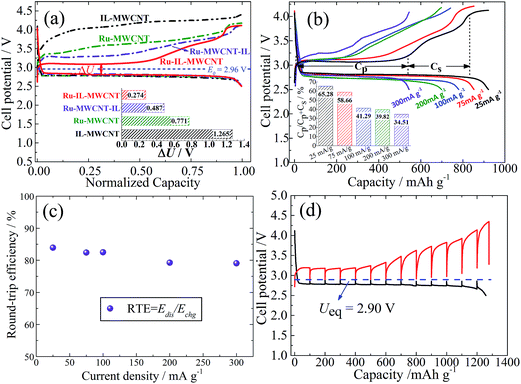
As shown in Fig. 2a, the charge potential of Ru-IL–CNT is significantly lowered, and is located at 3.08 V and is very close to the E0 value of Li2O2 (2.96 V).2 It means an extremely small ηcha of 0.12 V (vs. E0) and a round-trip energy efficiency (RTE) as high as 84% at 25 mA g−1 (Fig. 2c). Here RTE is calculated according to RTE = Edis/Echg, where Edis and Echg being the energy densities of full discharge and charge processes, respectively, as estimated in Fig. S7.† The charge plateau around 3.08 V can extend up to ∼500 mA h g−1 at 25 mA g−1 and is then followed by a generally sloped curve arising from 3.1 V to 3.8 V (Fig. 2b). Here the loaded Ru nanoparticles play a role in modifying the charge profile. Otherwise, a ηcha more than 1 V (or an energy efficiency as small as 67%) is observed in the Ru-free sample consisting of IL and CNT (IL-CNT). That is, this Ru-free electrode releases a substantial charge capacity above 4 V. For another two control samples (Ru-CNT and Ru-CNT-IL) where IL does not participate in nucleation, the function of Ru nanoparticles on decreasing ηcha is more or less counteracted and the potential is respectively located at 3.5 V or 3.25 V when reaching one-third charge capacity (Fig. 2a). This slightly larger ηcha is likely associated with the larger size or better crystallinity of Ru nanoparticles, as well as their uneven distribution on the CNT surface.31 Similar to Ru-IL–CNT, for Ru-CNT-IL a substantial charge plateau is also observed but with a higher potential and a smaller capacity ratio, which degrade more seriously for Ru-CNT. One can note that the late addition of IL still has an effect on lowering the ηcha value. From the galvanostatic intermittent titration technique (GITT, Fig. 2d), we observe that both the discharge and charge voltages in the plateau region can easily relax to the equilibrium potential (Ueq) of 2.90 V (i.e. zero voltage gap).32 It is slightly lower than the E0 value (2.96 V) of Li2O2 because of a potential formation of the solvate Li+(DMSO)n of a larger size and a lower charge density, which has weaker Lewis acidity than Li+ and therefore smaller bonding energy with O2− based on O2 + Li+(DMSO)n + e− → Li(DMSO)n–O2−.33 Since the GITT measurement was performed after a long-term cycling (100 cycles at 75 mA g−1), the ηcha reaches ∼0.25 V as a consequence of the slight increase of cell impedance. But the small ohmic loss does not remarkably influence the voltage relaxation process.
Fig. 2b shows the rate dependent capacity of Ru-IL–CNT cathodes under a mode of voltage cut-off (i.e. discharge to 2.5 V). Here the charge capacity of the plateau region is denoted as Cp while that of the sloped curve region as Cs, in order to estimate the ratio (R) of plateau capacity in capacity sum, i.e. R = Cp/(Cp + Cs). The R value monotonously decreases from 65.3% to 34.5% when increasing current density from 25 mA g−1 to 300 mA g−1 (inset of Fig. 2b), illustrating that a low current density favors the stabilization of a high fraction of plateau capacity. We also note that the increasing current density does not lead to a capacity compromise in the sloped curve region. A larger current density does not bring about serious polarization during both discharge and charge processes especially for the sloped curve region, leading to a good preservation of high round-trip energy efficiency (e.g. 80% at as high as 300 mA g−1, see Fig. 2c).
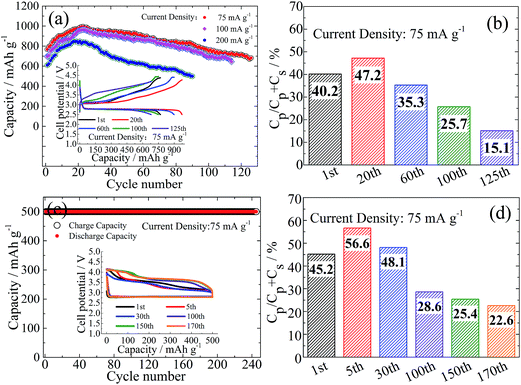
The corresponding cycling performance at three typical rates is shown in Fig. 3a. A capacity activation process appears to be universal during the early cycling for all the rates. For example, at a current density of 75 mA g−1 the reversible capacity increases from 800 mA h g−1 to 1000 mA h g−1 after the first 20 cycles and is finally stabilized at 700 mA h g−1 after 120 cycles. With increasing current density to 200 mA g−1, the initial and peak capacities are still maintained at 600 mA h g−1 and 800 mA h g−1, respectively. Such a high-rate cycling does not terminate until 90 cycles. Note that the R-value change is highly associated with capacity fluctuation (Fig. 3b and S8†), i.e. firstly R increases (e.g. from 40% for the 1st cycle to 47% for the 20th cycle at 75 mA g−1) and then decreases (e.g. to 35% for the 60th cycle). In other words, the capacity gain from the plateau region is larger than that from the sloped curve during the electrochemical activation process. Then the plateau capacity shrinks but without capacity degradation at the sloped curve region. It is lastly followed by simultaneous attenuation of capacities at both the plateau and sloped curve regions with a further decrease of the R-value.
We also attempted to run Li–O2 batteries under a widely used mode of capacity cut-off. A cut-off capacity of 500 mA h g−1 is kept constant at 75 mA g−1 for at least 240 cycles but with a gradual decrease of the R-value (Fig. 3c and d) after initial activation. The initial charge processes show a two-stage delithiation around 3.2 V and 3.5 V. The delithiation capacity around 3.5 V becomes dominant meanwhile with a capacity shrinkage around 3.2 V after a long-term cycling. At that time a substantial capacity appears around 4 V. It seems that the protocol of capacity cut-off is not so effective to suppress continuous product conversion during cycling from the profile evolution of charge curves, although the overall reversibility is greatly improved. This phenomenon is likely associated with the spontaneous disproportionation reaction from superoxide-like species to peroxide-like ones, the accumulation of which may cause a side reaction when contacting the surrounding electrolyte. Note that charging around 3.5 V displays more plateau-like characteristics with increasing cycling number, which was also observed in the previous report by Sun et al.20 Even though at a lower current density of 25 mA g−1 with a similar cut-off discharge capacity, the OER capacity beyond the near-E0 plateau is still observable (Fig. S9†).
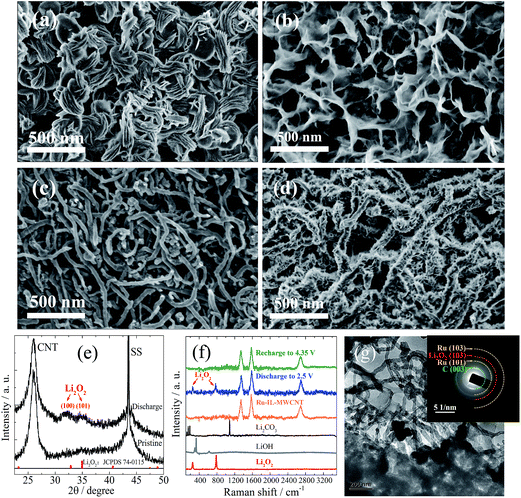
The relatively moderate capacity of the Ru-IL–CNT (∼1000 mA h g−1 at 75 mA g−1) is closely associated with the growth mode of products as indicated by SEM images of the sample discharged to 2.5 V (Fig. 4a and S10a†). The products prefer to deposit in a manner of nanosheet bundles rather than strict toroids as usually reported.34 A lower density of bundles (loose nanosheet stacking) than toroids (more nanosheet coalescence) should be responsible for the moderate capacity. The crystallized product is mainly assigned to Li2O2 from the corresponding XRD patterns although its peaks of (100) and (101) are quite broad (Fig. 4e), indicating a high lattice disorder or defect enrichment for Li2O2. It is also in accordance with the Raman spectra (Fig. 4f) and SAED patterns of the discharge state (inset of Fig. 4g), which respectively display weak characteristic peaks (at 790 and 250 cm−1) and rings of Li2O2. The poor crystallinity of Li2O2 may indicate a substantial existence of amorphous Li2O2 or VLi rich Li2−zO2 (0 < z < 1, i.e. oxygen-rich LixOy stoichiometry, x < y), which is thought to be responsible for the characteristic charge plateau close to E0 of Li2O2.8,10 Ru-based nanoparticles have been reported to possess the capability of modulating the product microstructure or defect concentration.20–22 Another potential factor for the appearance of the low ηcha plateau may lie in the complexation of the surface Bmim+ cation with a superoxide radical (O2−) through the electrostatic effect. O2− tends to be stabilized when bonding with large-sized cations (e.g. Na+, K+, EMI+).29 This factor may be partially responsible for the deviation from the standard potential E0 as shown in GITT, since such an interaction should affect the free energy change for the redox reaction.
The defect-rich structures are difficult to detect from the poorly-crystallized Li2O2 product (e.g. which is unstable under e-beam irradiation in the HRTEM measurement). After the termination of the low-voltage plateau when charging to 3.2 V, a looser and random stacking of nanosheet-like products without the formation of bundles is observed from SEM as shown in Fig. 4b and S10b.† Therein the individual nanosheets appear to become thinner (∼12 nm) and more bendable with their edges connected with each other than before recharge, resulting in the construction of a porous network with nanosheet walls. With further charging to 4.2 V, the residual species on the CNT surface can be completely removed (including carbonates as indicated by a small capacity above 4 V as shown in Figure 2a),35 leaving a nearly naked electrode surface (Fig. 4c and S10c†). Indeed, the Raman spectra of the fully charged sample do not show any peak signal of either Li2O2 or Li2CO3 (Fig. 4f). In fact, from the discharged Ru-IL–CNT after few cycles, we can find that some of the CNT surfaces are still left uncovered in view of space squeeze of large-sized products (Fig. 4g and S11†). However after 40 cycles we observe a well-defined stacking of nanosheet-like species almost everywhere on the CNT surface (Fig. 4d and S10d†). The width of deposit (tens of nanometers) appears to be roughly one order of magnitude smaller than that (hundreds of nanometer) in the early discharged sample despite with a similar sheet-like morphology. The diameter of these hairy CNTs (∼78 nm) is about two-fold larger than that of naked ones. The cycling-dependent morphology evolution should be closely associated with the composition and microstructure evolutions of (by)products and the Ru-IL–CNT surface.
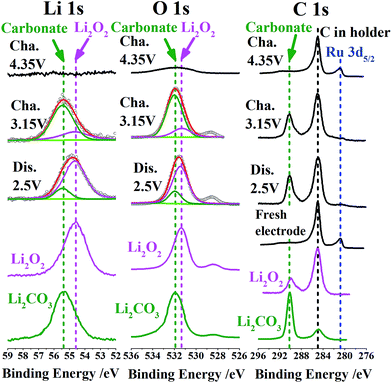
Let us see the XPS spectra of Li 1s, O 1s, C 1s and Ru 3d5/2 at different reaction stages to further confirm the evolution of (by)products especially those near the surface (Fig. 5). We list the XPS peaks of commercial Li2O2 and Li2CO3 in corresponding energy ranges as a reference. It is reasonable to assume that poorly crystallized Li2O2 (likely consisting of amorphous Li2O2 or VLi rich Li2−zO2) has similar peak positions of Li 1s and O 1s as well-crystallized Li2O2 in view of the similarity of their coordination environments or short-range order. After discharge to 2.5 V, the product Li2O2 or Li2−zO2 is dominant from the peaks of Li 1s (54.6 eV) and O 1s (531.5 eV). The minor peaks referring to Li2CO3 (i.e. 55.3 eV, 532 eV and 290 eV in Li 1s, O 1s and C 1s, respectively) are also discernible in view of a potential side reaction from electrolyte decomposition in the presence of Li2O2,3 although IL capping is thought to significantly alleviate the side reaction associated with carbon surface defects. When commercial Li2O2 powders are dispersed on a sample holder, we also observe the C 1s peak signal at 290 eV (apart from that at 285 eV from carbon in the holder). It indicates a spontaneous interface reaction between Li2O2 and C (in holder) into Li2CO3. After recharge to 3.15 V, Li2CO3 becomes the main surface species from the dominant Li 1s and O 1s peaks at 55.3 eV and 532 eV, considering that the deeper Li2O2 is likely more stoichiometric or better crystallized and thus the corresponding surface side reactions progress more easily. A direct proof of the electrochemical splitting of carbonates around 4 V lies in the ultimate disappearance of Li 1s, O 1s and C 1s peaks corresponding to Li2CO3 when recharging to 4.35 V. This results in a ‘clean’ electrode surface as shown in Fig. 4c, which is crucial for the following reversibility. The reversible deposition and decomposition of products are also seen from the corresponding burying and reappearance of the Ru 3d5/2 peak at 281 eV.
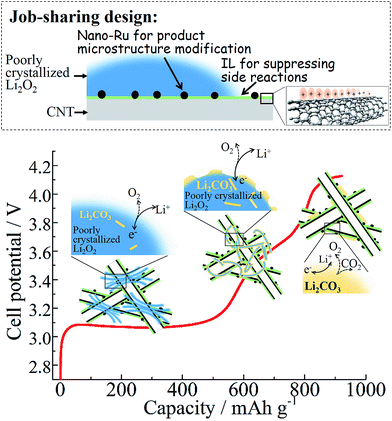
Either the absence of the microstructure promoter (e.g. Ru) or decoration layer (e.g. IL) on carbon is insufficient to achieve substantial near-E0 charging as shown in Fig. 2a. Although a highly disordered structure of the Li2O2 product is also observed from the discharged Ru-CNT electrode as in the case of Ru-IL–CNT (see XRD in Fig. S12a†), the accelerated formation of carbonates due to the lack of the IL layer discounts the benefit from the microstructure modification of Li2O2 by Ru nanoparticles. The SEM of Ru-CNT after deep discharge mainly shows a colloidal coating on CNTs instead of well-defined nanosheet stacking (Fig. S12b†). It is the characteristic of the high fraction of amorphous carbonate formation, which is further confirmed by the corresponding XPS (Fig. S13†). In contrast, the discharged Ru-CNT-IL shows a similar nanosheet stacking of the product as the discharged Ru-IL–CNT (Fig. S14†). Despite the late addition of IL after Ru nucleation, the IL-coating existence still suppresses the formation of colloidal carbonates. Therefore, a job-sharing design is particularly useful towards intrinsically unstable carbon-based electrodes in order to achieve highly efficient Li–O2 batteries (Fig. 6).
Even though previous studies have realized that functional moiety grafting or polymer wrapping could eliminate undesired surface defects to a certain degree in carbon-based electrodes,36,37 these treatments are not very successful either due to the absence of synergy with the ‘catalyst’, or to incomplete coverage or too thick an insulating coating. Granular coating only by a noble metal catalyst cannot completely cover carbon surface defects even though abundant mass is used in order to form a noble-metal network or core–shell architecture.21 Nanostructured coatings by using other transition metals or their compounds are not so effective as noble metals (or their oxides) in view of weak catalysis or microstructure promotion capability. Lu and Amine et al. attempted to deposit stable but insulating Al2O3 islands to passivate carbon defect sites.15 These 0.5 nm thick islands are discontinuous and still allow the exposure of a fraction of defect sites and the accumulation of side reactions. Therefore the capacity and polarization performances degrade seriously within few 15 cycles even under a mode of capacity cut-off. In contrast, in our case the IL trapping layer as a defect-healing coating is thinner but more conformal and continuous. Since CNTs possess a large π-electron surface formed by rolling-up two dimensional (2D) graphene sheets,30 the non-covalent cation–π interaction between IL and CNTs is much stronger than with other carbon allotropes (e.g. graphite and fullerene). Different from covalently functionalized CNTs, IL functionalization can avoid the disruption of π-electronic conjugation of CNTs and therefore does not degrade their electron conductivity.38 CNTs can orient the imidazolium cations on their π-electronic surface so as to trigger clustering of surrounding cations coulombically. Such a molecular ordering makes IL behave like a lubricant to cover carbon defect sites. Note that not 100% of the cation–π binding energy is electrostatic. Sometimes the nonelectrostatic component in the cation–π interaction is dominant.39 Therefore the imidazolium cations strongly bound to carbon would not peel off even though when the electrode reaches more oxidative potentials with a potential repulsion of positively charged species. This is also in accordance with the observation of an evident overpotential improvement (rather than degradation) during the early cycles (Fig. 3a). Another two advantages of this non-covalent interaction lie in the disentanglement of CNT bundles to construct open O2 diffusion channels as well as the preservation of charge transfer between CNTs and noble metals as indicated from the enhancement of electrocatalytic activity.40 Even the IL-based bucky gel with a low concentration of CNTs (<4 wt%) still showed a conductivity as high as 0.56 S cm−1 at room temperature.30 Different from Al2O3,15 our IL-cation linker is positively charged rather than neutral and has better electron uptake or transport capacity during cycling. The low interfacial tension of IL makes noble metals nucleate at a high rate with the formation of small nanoparticles. Bmim+ ordering on the CNT surface introduces sufficient binding sites to immobilize negatively charged RuCl4− precursor through an electrostatic interaction, therefore allowing a strong attachment to Ru nanoparticles and effectively preventing them from aggregation. Such an optimization of Ru size and distribution enables a remarkable decrease of the dosage of noble metal catalysts.
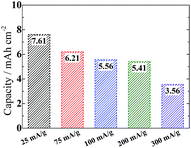
In our case an upwarp curve around 3.5 V appears to be unavoidable even when limiting the capacity to 500 mA h g−1 (Fig. S9†). This phenomenon is also associated with a competition between surface and solution mechanisms depending on the donor number (DN) of used electrolytes.41,42 A similar phenomenon is also observed in Sun's work using the same DMSO electrolyte.20 Unlike the surface mechanism which tends to cause a quick death of cells due to denser products, the solution mechanism favors the precipitation of looser nanostructures (e.g. nanosheets in our case), which can circumvent the charge transport limitation and improve the reversibility on a low overpotential. It would not block the gas channels in the disentangled CNT networks, therefore allowing the fabrication of thicker electrodes to increase the area specific capacity, which is as high as 7.6 mA h cm−2 at 25 mA g−1 (0.2 mA cm−2) or 3.6 mA h cm−2 at 300 mA g−1 (2.4 mA cm−2) with a high loading (8 mg cm−2) of the active material (Fig. 7). It is much superior to the previous report using a Ru/ITO electrode (∼2.5 mA h cm−2 at 0.025 mA cm−2 or 1.8 mA h cm−2 at 0.15 mA cm−2).43
Conclusion
In summary, we achieved an oxygen cathode (Ru-IL–CNT) designed in a job-sharing way for Li–O2 batteries. Therein disentangled CNTs act as conductive supports for electron transfer and O2 diffusion, and the conformal IL capping layer is expected to cover undesired carbon surface defects but not retard charge transfer. Highly dispersed Ru nanodots on CNTs likely play the role of a ‘disorder preserver’, leading to a longevity of highly disordered (or defect-rich) Li2O2, which appears to be a potential solution to high energy efficiency Li–O2 batteries (80–84% for full charge/discharge in this work). A reversible capacity around 800–1000 mA h g−1 is achieved for more than 100 cycles under a mode of voltage cut-off. If cutting off capacity at 500 mA h g−1, more than 240 cycles can be reached. The poorly crystallized peroxides may be highly associated with a plateau capacity larger than 500 mA h g−1 with a ηcha as small as 0.18 V. Loose stacking of nanosheets rather than dense toroids is responsible for the moderate mass specific capacity, which is expected to improve when resorting to porous carbon or graphene with higher surface area in future studies. However it allows the preparation of thick electrodes (8 mg cm−2) with a quite high area specific capacity of 3.6–7.6 mA h cm−2. This work indicates that an often observed low-voltage reversibility for IL electrolytes likely stems from electrode deactivation through in situ healing of undesired surface defects by neighboring IL molecules.Author contributions
C. L. conceived and directed the experiments. P. L. and Z. C. performed the experiments. P. L., Z. C. and C. L. analyzed the data. C. L. wrote the manuscript. X. G. provided the experimental platform and advisory comments.Acknowledgements
The beamline of BL14B1 in the Shanghai Synchrotron Radiation Facility is acknowledged for the X-ray measurement. This work was supported by the National Natural Science Foundation of China under Grant No. 51372263 and No. U1232111, as well as by the Key Research Program of Chinese Academy of Sciences (Grant No. KGZD-EW-T06). C. L. Li is grateful for support from the “Hundred Talents” program of the Chinese Academy of Sciences and the Science Foundation for Young Researchers of State Key Laboratory of High Performance Ceramics and Superfine Microstructures.References
- P. G. Bruce, S. A. Freunberger, L. J. Hardwick and J. M. Tarascon, Nat. Mater., 2012, 11, 19 CrossRef CAS PubMed.
- G. Girishkumar, B. McCloskey, A. C. Luntz, S. Swanson and W. Wilcke, J. Phys. Chem. Lett., 2010, 1, 2193 CrossRef CAS.
- M. M. Ottakam Thotiyl, S. A. Freunberger, Z. Q. Peng and P. G. Bruce, J. Am. Chem. Soc., 2013, 135, 494 CrossRef CAS PubMed.
- B. D. McCloskey, A. Speidel, R. Scheffler, D. C. Miller, V. Viswanathan, J. S. Hummelshoj, J. K. Norskov and A. C. Luntz, J. Phys. Chem. Lett., 2012, 3, 997 CrossRef CAS PubMed.
- Y. L. Liu, R. Wang, Y. C. Lyu, H. Li and L. Q. Chen, Energy Environ. Sci., 2014, 7, 677 CAS.
- Z. L. Wang, D. Xu, J. J. Xu and X. B. Zhang, Chem. Soc. Rev., 2014, 43, 7746 RSC.
- H. G. Jung, J. Hassoun, J. B. Park, Y. K. Sun and B. Scrosati, Nat. Chem., 2012, 4, 579 CrossRef CAS PubMed.
- D. Y. Zhai, H. H. Wang, J. B. Yang, K. C. Lau, K. X. Li, K. Amine and L. A. Curtiss, J. Am. Chem. Soc., 2013, 135, 15364 CrossRef CAS PubMed.
- J. J. Xu, Z. L. Wang, D. Xu, L. L. Zhang and X. B. Zhang, Nat. Commun., 2013, 4, 2438 Search PubMed.
- F. Tian, M. D. Radin and D. J. Siegel, Chem. Mater., 2014, 26, 2952 CrossRef CAS.
- S. Y. Kang, Y. F. Mo, S. P. Ong and G. Ceder, Chem. Mater., 2013, 25, 3328 CrossRef CAS.
- Z. Q. Peng, S. A. Freunberger, Y. H. Chen and P. G. Bruce, Science, 2012, 337, 563 CrossRef CAS PubMed.
- M. M. O. Thotiyl, S. A. Freunberger, Z. Q. Peng, Y. H. Chen, Z. Liu and P. G. Bruce, Nat. Mater., 2013, 12, 1050 CrossRef PubMed.
- Z. Y. Guo, D. D. Zhou, X. L. Dong, Z. J. Qiu, Y. G. Wang and Y. Y. Xia, Adv. Mater., 2013, 25, 5668 CrossRef CAS PubMed.
- J. Lu, Y. Lei, K. C. Lau, X. Y. Luo, P. Du, J. G. Wen, R. S. Assary, U. Das, D. J. Miller, J. W. Elam, H. M. Albishri, D. A. El-Hady, Y. K. Sun, L. A. Curtiss and K. Amine, Nat. Commun., 2013, 4, 2383 Search PubMed.
- I. D. Scott, Y. S. Jung, A. S. Cavanagh, Y. F. Yan, A. C. Dillon, S. M. George and S. H. Lee, Nano Lett., 2011, 11, 414 CrossRef CAS PubMed.
- S. J. Kang, T. Mori, S. Narizuka, W. Wilcke and H. C. Kim, Nat. Commun., 2014, 5, 3937 CAS.
- R. Black, J. H. Lee, B. Adams, C. A. Mims and L. F. Nazar, Angew. Chem., Int. Ed., 2013, 52, 392 CrossRef CAS PubMed.
- R. Choi, J. Jung, G. Kim, K. Song, Y. I. Kim, S. C. Jung, Y. K. Han, H. Song and Y. M. Kang, Energy Environ. Sci., 2014, 7, 1362 CAS.
- B. Sun, X. D. Huang, S. Q. Chen, P. Munroe and G. X. Wang, Nano Lett., 2014, 14, 3145 CrossRef CAS PubMed.
- Z. L. Jian, P. Liu, F. J. Li, P. He, X. W. Guo, M. W. Chen and H. S. Zhou, Angew. Chem., Int. Ed., 2014, 53, 442 CrossRef CAS PubMed.
- E. Yilmaz, C. Yogi, K. Yamanaka, T. Ohta and H. R. Byon, Nano Lett., 2013, 13, 4679 CrossRef CAS PubMed.
- H. D. Lim, H. Song, J. Kim, H. Gwon, Y. Bae, K. Y. Park, J. Hong, H. Kim, T. Kim, Y. H. Kim, X. Lepro, R. Ovalle-Robles, R. H. Baughman and K. Kang, Angew. Chem., Int. Ed., 2014, 53, 3926 CrossRef CAS PubMed.
- C. L. Li, L. Gu, J. W. Tong and J. Maier, ACS Nano, 2011, 5, 2930 CrossRef CAS PubMed.
- C. L. Li, C. L. Yin, L. Gu, R. E. Dinnebier, X. K. Mu, P. A. van Aken and J. Maier, J. Am. Chem. Soc., 2013, 135, 11425 CrossRef CAS PubMed.
- C. L. Li, X. K. Mu, P. A. van Aken and J. Maier, Adv. Energy Mater., 2013, 3, 113 CrossRef CAS.
- H. B. Chu, Y. H. Shen, L. Lin, X. J. Qin, G. Feng, Z. Y. Lin, J. Y. Wang, H. C. Liu and Y. Li, Adv. Funct. Mater., 2010, 20, 3747 CrossRef CAS.
- T. Zhang and H. S. Zhou, Angew. Chem., Int. Ed., 2012, 51, 11062 CrossRef CAS PubMed.
- C. J. Allen, S. Mukerjee, E. J. Plichta, M. A. Hendrickson and K. M. Abraham, J. Phys. Chem. Lett., 2011, 2, 2420 CrossRef CAS.
- T. Fukushima, A. Kosaka, Y. Ishimura, T. Yamamoto, T. Takigawa, N. Ishii and T. Aida, Science, 2003, 300, 2072 CrossRef CAS PubMed.
- J. Lu, L. Cheng, K. C. Lau, E. Tyo, X. Y. Luo, J. G. Wen, D. Miller, R. S. Assary, H. H. Wang, P. Redfern, H. M. Wu, J. B. Park, Y. K. Sun, S. Vajda, K. Amine and L. A. Curtiss, Nat. Commun., 2014, 5, 4895 CrossRef CAS PubMed.
- Z. H. Cui, X. X. Guo and H. Li, Energy Environ. Sci., 2015, 8, 182 CAS.
- K. M. Abraham, J. Electrochem. Soc., 2015, 162, A3021 CrossRef CAS.
- R. R. Mitchell, B. M. Gallant, Y. Shao-Horn and C. V. Thompson, J. Phys. Chem. Lett., 2013, 4, 1060 CrossRef CAS PubMed.
- B. M. Gallant, R. R. Mitchell, D. G. Kwabi, J. G. Zhou, L. Zuin, C. V. Thompson and Y. Shao-Horn, J. Phys. Chem. C, 2012, 116, 20800 CAS.
- M. L. Thomas, K. Yamanaka, T. Ohtab and H. R. Byon, Chem. Commun., 2015, 51, 3977 RSC.
- C. K. Lee and Y. J. Park, Chem. Commun., 2015, 51, 1210 RSC.
- T. Fukushima and T. Aida, Chem.–Eur. J., 2007, 13, 5048 CrossRef CAS PubMed.
- J. C. Ma and D. A. Dougherty, Chem. Rev., 1997, 97, 1303 CrossRef CAS PubMed.
- S. J. Guo, S. J. Dong and E. K. Wang, Adv. Mater., 2010, 22, 1269 CrossRef CAS PubMed.
- N. B. Aetukuri, B. D. McCloskey, J. M. Garcia, L. E. Krupp, V. Viswanathan and A. C. Luntz, Nat. Chem., 2015, 7, 50 CrossRef CAS PubMed.
- L. Johnson, C. M. Li, Z. Liu, Y. H. Chen, S. A. Freunberger, P. C. Ashok, B. B. Praveen, K. Dholakia, J. M. Tarascon and P. G. Bruce, Nat. Chem., 2014, 6, 1091 CrossRef CAS PubMed.
- F. J. Li, D. M. Tang, Y. Chen, D. Golberg, H. Kitaura, T. Zhang, A. Yamada and H. S. Zhou, Nano Lett., 2013, 13, 4702 CrossRef CAS PubMed.
Footnote |
| † Electronic supplementary information (ESI) available: Experimental section and Fig. S1 to S14 are given. See DOI: 10.1039/c5ta07886e |
| This journal is © The Royal Society of Chemistry 2016 |

