Biomass-derived activated carbon with simultaneously enhanced CO2 uptake for both pre and post combustion capture applications†
Helena Matabosch
Coromina
,
Darren A.
Walsh
and
Robert
Mokaya
*
School of Chemistry, The University of Nottingham, Nottingham NG7 2RD, UK. E-mail: r.mokaya@nottingham.ac.uk
First published on 25th November 2015
Abstract
We report on the synthesis and CO2 uptake capabilities of a series of activated carbons derived from the biomass raw materials Jujun grass and Camellia japonica. The carbons were prepared via hydrothermal carbonization of the raw materials, which yielded hydrochars that were activated with KOH at temperature between 600 and 800 °C. Carbons activated at KOH/hydrochar ratio of 2 have moderate to high surface area (1050–2750 m2 g−1), are highly microporous (95% of surface area arises from micropores, and 84% of pore volume from micropores of size between 5 and 7 Å), and exhibit excellent CO2 uptake capacity at 25 °C of up to 1.5 mmol g−1 at 0.15 bar and 5.0 mmol g−1 at 1 bar, which is amongst the highest reported so far for biomass-derived carbons. On the other hand, activation at KOH/hydrochar ratio of 4 generates carbons with surface area and pore volume of up to 3537 m2 g−1 and 1.85 cm3 g−1, and which, depending on level of activation, simultaneously exhibit high CO2 uptake at both 1 bar (4.1 mmol g−1) and 20 bar (21.1 mmol g−1), i.e. under conditions that mimic, respectively, post combustion and pre combustion CO2 capture from flue gas streams. The present carbons are the first examples of biomass derived porous materials with such all-round CO2 uptake performance, which arises due to the pore size distribution of the carbons being shifted towards small micropores even for samples with very high surface area. Thus the carbons satisfy the requirements for both low pressure (presence of small micropores) and high pressure (high surface area) CO2 uptake.
1. Introduction
CO2 is a greenhouse gas present in the atmosphere with a direct link to global climate change, and which is produced during the combustion of fossil fuels.1,2 In recent decades, a challenge that researchers have faced is how to capture and store CO2. Several technologies have been mooted to reduce atmospheric CO2 concentrations, and include membrane separation, chemical fixation, storage and capture, and cryogenic processes.1–4 An approach that is increasingly gaining attention is CO2 capture and storage by solid-based adsorbents.4–8 Currently, candidate materials for CO2 adsorption include zeolites, amine-doped porous solids such as mesoporous silica, porous carbons and metal–organic frameworks (MOFs).3,5–12 Amine modified materials (e.g. zeolites and porous silicas) tend to absorb large amounts of CO2 but are unattractive as they require high temperatures for CO2 desorption and regeneration of the absorbent and, therefore, exhibit poor cycling stability. Some MOFs, particularly those that contain bare-metal sites have attractive CO2 uptake but require several steps in their synthesis and are rather expensive. Thus in recent years, porous carbons such as activated carbons are increasingly being accepted as viable solid state CO2 stores due to their ready availability and low cost.9–12 In general activated carbons can exhibit high surface areas, well-developed micropores and mesopores, chemical and thermal stability, and they are amenable to tuning of their chemical and textural structures.9–12 Additionally, activated carbons can be produced from a wide range of sources including resins, fossil carbon deposits or biomass, via carbonization and activation processes.9–13 More recently, biomass-derived activated carbons have received a great deal of attention due to their high surface areas, complex pore structures and promising CO2 uptake, as well as the fact that the raw materials are readily available, cheap and renewable.14–16To maximise CO2 uptake capacity, activated carbons need to have a high surface area arising from micropores; recent studies have found that porous carbon materials with micropores smaller than 7–9 Å show better CO2 uptakes than those with pores larger than 9 Å.5–12,15 The pore size in activated carbons can be tailored towards micropores by varying the carbonizing and activating processes.17 The hydrothermal carbonization process is now firmly established as a starting point in the transformation of biomass to activated carbons.18 The process is relatively simple, only requiring the heating of an aqueous solution/dispersion of biomass at relatively low temperature (typically up to 250 °C) at autogenous pressure.18 The process converts biomass into carbon enriched carbonaceous matter – the so-called hydrochars that are amenable to activation.18,19 In the chemical activation step, KOH is the favoured activating agent as it can generate activated carbons with porosity that may be tailored towards improved CO2 adsorption.9,20 Several studies have shown promising CO2 uptake (up to 4.8 mmol g−1 at 1 bar and 25 °C) for KOH activated biomass-derived carbons at low pressure conditions that mimic post combustion capture of CO2 from flue gas streams.15,20–23 However, to date, no porous material has been identified that exhibits attractive and industrially viable room temperature CO2 uptake at both low pressure (≤1 bar) and high pressure (≥20 bar) conditions – the latter mimics conditions suitable for pre combustion CO2 capture. Such materials are difficult to achieve because small micropores that are suitable for low pressure (post combustion) CO2 uptake are typically found in low surface area solids, yet the low surface area restricts the amount of storage at high pressure. On the other hand, most high surface area porous materials that have excellent high pressure CO2 uptake tend to possess pores that are too large for low pressure storage. To have all round CO2 uptake, a porous materials needs to have high surface area arising from micropores – a combination that is difficult to achieve.
In this study, a series of activated carbons were prepared from two readily-available biomass precursors, namely, Jujun grass and Camellia japonica, and evaluated as CO2 capture and storage materials. The starting raw materials were hydrothermally carbonised to hydrochars that were then chemically activated using KOH. The samples were activated at KOH/hydrochar ratios of 2 or 4 and at activating temperature between 600 and 800 °C. The resulting activated carbons have moderate to high surface area and are predominantly microporous, with some samples exhibiting excellent all-round CO2 adsorption that is higher than that of equivalent benchmark materials.5–16,20–23
2. Experimental section
2.1. Synthesis of materials
Hydrochars were prepared by hydrothermal carbonization of Jujun grass and Camellia japonica as follows; an aqueous dispersion of the starting raw material with a concentration of 320 g L−1 was placed in a stainless steel autoclave and heated up to 250 °C and held at this temperature for 2 h. The product (the so-called hydrochar), was recovered by filtration and washed several times with deionised water and then dried in an oven at 120 °C for 4 h. For activation, the hydrochar (typically 0.5–1 g) was mixed with KOH at the desired weight ratio in an agate mortar. The mixture was then placed in a tube furnace and heated at a ramp rate of 5 °C min−1, and held at the target temperature for 1 h under a flow of nitrogen gas. The resulting activated carbon was washed several times with a 10 wt% solution of hydrochloric acid (Sigma-Aldrich) in order to remove any inorganic residues. The carbon was then washed with deionised water until neutral pH and dried in an oven at 120 °C for 4 h. The activated carbons derived from Jujun grass (GR) and Camellia japonica (CA) were denoted as ACGRxT or ACCAxT, respectively, where x is the KOH/hydrochar ratio (2 or 4) and T is the activating temperature (600, 700, or 800 °C).2.2. Characterization of materials
Powder X-ray diffraction (XRD) patterns were obtained using a PANanalytical X'Pert PRO diffractometer with Cu-Kα radiation operating at 40 kV and 40 mA, with 0.02° step size and 30 s step time. The elemental analysis of the samples (C, H, N and O) was performed using a model CE-440 Elemental Analyzer (Exeter Analytical). Thermogravimetric analysis (TGA) was performed in alumina pans using a TA Instruments SDT Q600 analyzer. Samples were heated up to 800 °C at 5 °C min−1 under a flow of air. The textural properties and porosity of the samples were analysed from nitrogen sorption isotherms obtained at −196 °C on a Micromeritics ASAP 2020 sorptometer. Surface area was determined using the Brunauer–Emmett–Teller (BET) method applied to adsorption data in the relative pressure (P/Po) range between 0.02 and 0.22. The total pore volume was based on the quantity of nitrogen adsorbed at relative pressure of ∼0.99. The micropore surface area and micropore volume were determined via t-plot analysis. The pore size distribution (PSD) was determined via the non-local density function theory (NLDFT) method using nitrogen adsorption data. Scanning electron microscopy (SEM) images were obtained using an FEI XL30 instrument. Transmission electron microscopy (TEM) images were obtained using a JEOL 2100F instrument operating at 200 kV equipped with a Gatan Orius CCD for imaging. The samples were suspended in distilled water and dispersed onto lacey carbon support film. Raman spectra were recorded using a Horiba-Jobin-Yvon LabRAM Raman microscope with a 532 nm laser operating at ca. 4 mW (10%) and a 600 lines per mm grating. The detector was a Synapse CCD detector. Spectra were collected by averaging 8 acquisitions of 60 s duration. The Raman shift was calibrated using the Rayleigh peak and the 520.7 cm−1 Si line from a Si(100) reference sample.2.3. CO2 uptake measurements
CO2 adsorption and storage was investigated in the pressure range 0–20 bar at room temperature using a Hiden intelligent gravimetric analyser (IGA-003). Before uptake measurements, the samples were degassed at 200 °C under vacuum for several hours.3. Results and discussion
3.1. Morphology and structure of hydrochars and activated carbons
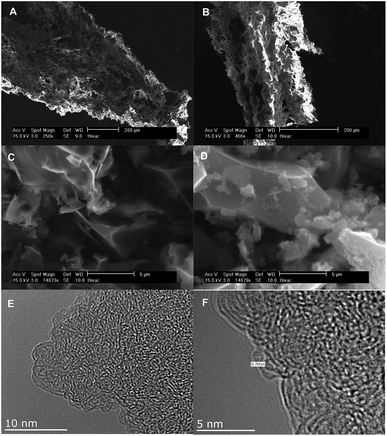
SEM and TEM analysis were used to monitor changes in morphology of the raw materials following hydrothermal carbonisation and activation. The SEM and TEM images of the precursors, hydrochars and representative activated carbons are shown in Fig. 1 (Jujun grass) and Fig. 2 (Camellia japonica). Both raw materials and their respective hydrochars have stringy fibre-like particles that are characteristic of biomass material.15 On the other hand, the activated carbon samples have irregularly shaped particles and sharp corners, a morphology that is characteristic of activated carbons.24,25 The KOH/hydrochar ratio used during the activation appears to have some influence on the morphology of resulting activated carbons. Thus, carbons activated at ratio 2 (Fig. 1 and 2, S1 and S2†) present a higher degree of surface roughness, which is an indication of a microporous structure. In contrast, carbons activated at ratio 4 show smoother surfaces. The SEM images indicate that the morphology of the precursor (raw material or hydrochar) is not retained in the activated carbons. Representative TEM images (sample ACGR4700 and ACCA2700) are shown in Fig. 1 and 2 (and S3†). The pore channel geometry and connectivity is similar for the two samples with both indicative of a highly porous material. The TEM images show that sample ACGR4700 has larger pores than ACCA2700, which is consistent with the fact that the former is prepared at higher KOH/hydrochar ratio and therefore achieves a higher level of activation and larger pores (Fig. 1, 2 and S3†).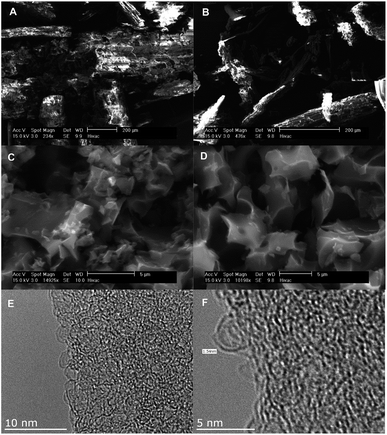 | ||
| Fig. 1 SEM images of Jujun grass (A), Jujun grass hydrochar (B), activated carbon derived from Jujun grass; sample ACGR2600 (C) and ACGR4600 (D), and TEM images of sample ACGR4700 (E and F). | ||
In order to assess the purity of the samples with respect to carbon content, we performed thermogravimetric analysis (TGA) of the hydrochars and activated carbons. Any residual mass following TGA may be assigned to the presence of mineral matter in the case of hydrochars, and inorganic residues arising from the activating agent (KOH) for activated carbons. As shown in Fig. S4,† all the TGA curves show an initial mass loss below 100 °C, due to removal of water, followed by a larger mass loss centred at ca. 600 °C, which is the carbon burn off. The hydrochar samples obtained from Jujun grass and Camellia japonica at 800 °C (under air) display a residual mass of ca. 10% and 5%, respectively, suggesting the presence of small amounts of mineral matter. By contrast, the activated carbons exhibit much lower residual mass (generally less than 5% and typically lower than 2%), which confirms that they are virtually free of inorganic residues. According to the TGA curves, the activated carbons show better thermal stability (as indicated by carbon burn off maxima) than the hydrochar samples, with the burn off maxima for activated carbons being at ca. 600 °C, compared to between 300 °C and 500 °C for the hydrochars. Additionally, it appears that activated carbons prepared at higher activating temperature are more thermally stable, an observation that may be related to the increase in level of graphitisation due to exposure to higher temperature.
Powder XRD patterns of hydrochars (Fig. S5†) show a sharp peak at 2θ ≈ 22°, which may arise from minor graphitic/turbostratic carbon domains.26 The XRD patterns for the activated carbons (Fig. S5†) show weak peaks at 2θ ≈ 22° and 44°; the broad and low intensity nature of the peaks indicates that the samples are predominately amorphous carbons with very low, if any, graphitic domains. These observations are supported by the Raman spectra (Fig. S6†), which show broad bands at 1370 cm−1 and 1595 cm−1 that are, respectively, the D-peak (for disordered carbon) and the G-peak (for graphitic domains). The ratio of peak intensity (i.e., area) of the D-peak to G-peak (ID/IG) ranges from ∼1.4 to 1.7, and generally reduces for carbons prepared at higher activation temperature. This suggests a slightly higher level of graphitisation for the samples activated at high temperature, which is in agreement with the thermal stability data (Fig. S4†).
The elemental compositions of the raw biomass materials, hydrochars and activated carbons are shown in Table 1. The H/C ratio shows a significant decrease from 0.13 for the raw biomass materials, to 0.1 for the hydrochars, and down to ca. 0.02 for the activated carbons. This decrease is related to carbon enrichment that occurs during the hydrothermal carbonisation step and also the chemical activation process. In general, the carbon content increases at higher activation temperature.
| Sample | C | H | H/C |
|---|---|---|---|
| Jujun grass | 41.7 | 5.5 | 0.13 |
| Jujun grass hydrochar | 55.8 | 5.7 | 0.10 |
| ACGR2600 | 75.1 | 1.2 | 0.016 |
| ACGR2700 | 83.8 | 0.6 | 0.007 |
| ACGR2800 | 84.7 | 0.3 | 0.004 |
| ACGR4600 | 75.9 | 0.9 | 0.012 |
| ACGR4700 | 86.2 | 0.5 | 0.006 |
| ACGR4800 | 82.5 | 1.3 | 0.016 |
| Camellia japonica | 46.2 | 5.4 | 0.12 |
| Camellia hydrochar | 49.1 | 5.2 | 0.11 |
| ACCA2600 | 72.8 | 1.0 | 0.014 |
| ACCA2700 | 78.8 | 0.5 | 0.007 |
| ACCA2800 | 81.6 | 0.4 | 0.004 |
| ACCA4600 | 73.7 | 0.9 | 0.012 |
| ACCA4700 | 87.0 | 0.5 | 0.006 |
| ACCA4800 | 91.4 | 0.3 | 0.003 |
3.2. Textural properties
The nitrogen sorption isotherms and pore size distribution (PSD) curves for activated carbons derived from Jujun grass are shown in Fig. 3 and the corresponding textural properties are summarised in Table 2. The nitrogen sorption isotherms are predominately type I.27 The isotherms of Jujun grass-derived carbons activated at KOH/hydrochar ratio of 2 and temperature of 600 or 700 °C (Fig. 3A) are characteristic of highly microporous materials in which virtually all of the nitrogen sorption takes place at relative pressure (P/Po) below 0.1, followed by a sharp knee and plateau.27 For the sample activated at 800 °C, there is a wider adsorption knee suggesting the presence of supermicropores in addition to micropores.21–23,28 This is confirmed by the PSD curves in Fig. 3B; sample ACGR2600 and ACGR2700 show few pores larger than 10 Å and no pores larger than 20 Å. The porosity of these samples is dominated by pores of size between 5 and 9 Å as summarised in Table 2. On the other hand, sample ACGR2800 has some pores above 10 Å (supermicropores) and a small proportion of pores larger than 20 Å. This is also reflected in the proportion of microporosity, wherein samples ACGR2600 and ACGR2700 are predominantly microporous (ca. 94% of the surface area and 84% of the pore volume arise from micropores). On the other hand, the extent of microporosity for sample ACGR2800 is lower at 76% of the surface area and 67% of pore volume. The development of larger pore sizes at 800 °C is due to gasification effects related to the decomposition of potassium salts according to the reactions below:| 6KOH + 2C → 2K + 3H2 + 2K2CO3 | (1) |
| K2CO3 → K2O + CO2 | (2) |
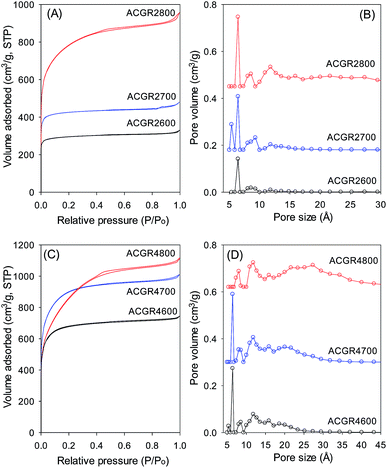 | ||
| Fig. 3 Nitrogen sorption isotherms (A and C) and pore size distribution curves (B and D) of activated carbons derived from Jujun grass. | ||
| Sample | Surface areaa (m2 g−1) | Pore volumeb (cm3 g−1) | Pore sizec (Å) | CO2 uptaked (mmol g−1) | ||
|---|---|---|---|---|---|---|
| 0.15 bar | 1 bar | 20 bar | ||||
| a The values in the parenthesis refer to: amicropore surface area and bmicropore volume. cPore size distribution maxima obtained from NLDFT analysis. dCO2 uptake at 25 °C and various pressures (i.e., 0.15 bar, 1 bar and 20 bar). | ||||||
| ACGR2600 | 1048 (975) | 0.51 (0.43) | 5/6 | 1.5 | 4.3 | 8.7 |
| ACGR2700 | 1512 (1426) | 0.74 (0.62) | 5/6/9 | 1.5 | 4.9 | 12.7 |
| ACGR2800 | 2735 (2083) | 1.47 (0.94) | 6.5/9/12 | 0.9 | 3.8 | 18.1 |
| ACGR4600 | 2396 (2182) | 1.15 (0.96) | 6/9/12 | 0.9 | 3.5 | 13.6 |
| ACGR4700 | 3144 (2753) | 1.56 (1.23) | 6/8/12/20 | 0.9 | 4.1 | 20.0 |
| ACGR4800 | 2957 (1578) | 1.72 (0.75) | 8/12/27 | 0.6 | 2.8 | 18.7 |
As shown in Table 2, the surface area of Jujun grass-derived samples prepared at KOH/hydrochar ratio of 2, increases from a modest 1048 m2 g−1 for sample ACGR2600 to 1512 m2 g−1 for sample ACGR2700 and then greatly rises to 2735 m2 g−1 for sample ACGR2800. The pore volume shows a similar trend, increasing with activating temperature from 0.51 cm3 g−1 to 1.47 cm3 g−1.
The nitrogen sorption isotherms for Jujun grass-derived samples activated at KOH/hydrochar ratio of 4 and at 600 or 700 °C (Fig. 3C) are predominantly type 1, but with a gentler knee signifying the presence of larger micropores. This indicates that samples ACGR4600 and ACGR4700 are mainly microporous but with a relatively wide micropore size distribution that extends to supermicropores.29,30 A change in the shape of the isotherm from type I to nearly type IV for the sample activated at 800 °C (ACGR4800) indicates a change of the pore size to larger pores in the small mesopore range.31 As shown in Fig. 3C, the isotherm of sample ACGR4800 has a very wide knee with a linear increase in adsorption up to a P/Po of 0.4, indicating the presence of a significant proportion of small mesopores,32,33 as is also confirmed by the pore size distribution in Fig. 3D. This widening of the pores is related to the CO2 and CO gases released from decomposition of K2CO3 during the activation at 800 °C according to eqn (1) and (2) above.34 In addition, the higher amount of KOH used in samples activated at KOH/hydrochar ratio of 4, increased the generation of K2CO3 releasing more CO2 and CO, which generate wider pores.28,35 The textural parameters in Table 2 show that, for Jujun grass-derived samples prepared at KOH/hydrochar ratio of 4, the surface area increases from 2396 m2 g−1 for ACGR4600 to 3144 m2 g−1 for ACGR4700 and then slightly decreases to 2956 m2 g−1 for ACGR4800, indicating that the optimum activating temperature (with respect to surface area) for this series of carbons is 700 °C. On the other hand, the pore volume increases with activating temperature from 1.15 cm3 g−1 to 1.72 cm3 g−1.
Fig. 4 shows the nitrogen sorption isotherms and pore size distribution of the activated carbons derived from Camellia japonica, and the corresponding textural properties are given in Table 3. As shown in Fig. 4, the porosity of ACCA carbons follows the same trends as for those from Jujun grass. ACCA carbons prepared at KOH/hydrochar ratio of 2 and temperature of 600 and 700 °C are predominantly microporous, while the sample prepared at 800 °C contains both micropores and supermicropores. For activation at KOH/hydrochar ratio of 4 and temperature of 600 and 700 °C, ACCA samples are microporous/supermicroporous with a small proportion of small mesopores, while for activation at 800 °C, the resulting ACCA4800 sample has both micropores and a significant proportion of mesopores. The trends in the level of micro and mesoporosity is such that sample ACCA2600 and ACCA2700 exhibit a very high proportion of microporosity (95% for surface area and 84% for pore volume), while for sample ACCA2800, 88% of surface area and 76% of pore volume arises from micropores. Thus sample ACCA2600 and ACCA2700 exhibit small micropores centred at 5, 7 and 9 Å, while for sample ACCA2800 the pore size systems are slightly larger and centred at 6, 9 and 12 Å (Fig. 4B), which is consistent with the expected effects of activation temperature.34,36,37
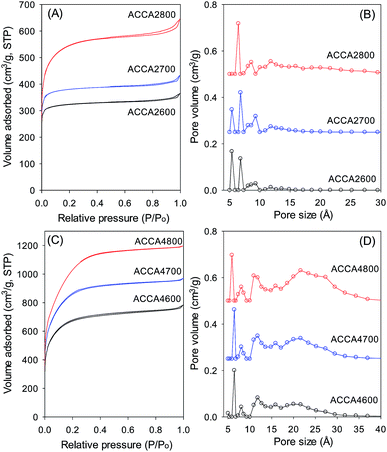 | ||
| Fig. 4 Nitrogen sorption isotherms (A and C) and pore size distribution curves (B and D) of activated carbons derived from Camellia japonica. | ||
| Sample | Surface areaa (m g−1) | Pore volumeb (cm3 g−1) | Pore sizec (Å) | CO2 uptaked (mmol g−1) | ||
|---|---|---|---|---|---|---|
| 0.15 bar | 1 bar | 20 bar | ||||
| a The values in the parenthesis refer to: amicropore surface area and bmicropore volume. cPore size distribution maxima obtained from NLDFT analysis. dCO2 uptake at 25 °C and various pressures (i.e., 0.15 bar, 1 bar and 20 bar). | ||||||
| ACCA2600 | 1150 (1088) | 0.56 (0.47) | 5/7/9 | 1.5 | 4.7 | 10.5 |
| ACCA2700 | 1353 (1283) | 0.67 (0.56) | 5/7/9 | 1.5 | 5.0 | 14.2 |
| ACCA2800 | 1917 (1691) | 0.99 (0.75) | 6/9/12 | 0.9 | 3.7 | 17.5 |
| ACCA4600 | 2345 (1997) | 1.2 (0.89) | 6/8/12 | 0.8 | 3.1 | 16.0 |
| ACCA4700 | 2983 (2500) | 1.5 (1.14) | 6/12/22 | 0.7 | 3.0 | 18.8 |
| ACCA4800 | 3537 (2557) | 1.85 (1.21) | 6/11/22 | 0.6 | 2.8 | 21.1 |
The ACCA4800 sample shows the widest adsorption knee of the samples activated at KOH/hydrochar ratio of 4, indicating broadening of pore size distribution and an increase in pore size (Fig. 4D). On the other hand, as shown in Fig. 4D, samples ACCA4600 and ACCA4700 have small micropores of size 6 Å and a significant proportion of supermicropores (11 Å) and small mesopores (22 Å). The porosity of sample ACCA4800 is largely dominated pores of size 10–35 Å. For samples activated at KOH/hydrochar ratio of 2, the surface area increases from 1150 m2 g−1 for ACCA2600 to 1353 m2 g−1 for the ACCA2700, and 1917 m2 g−1 for sample ACCA2800. A similar trend is observed for samples prepared at KOH/hydrochar ratio of 4, wherein the surface area increases, with expansion in pore size as activating temperature rises, and ranges from 2345 m2 g−1 for ACCA4600, 2983 m2 g−1 for the ACCA4700 and a high of 3537 m2 g−1 for ACCA4800. It is noteworthy that a surface area of 3537 m2 g−1 is at the high end of previous results that have reported that the typical surface area for biomass-derived activated carbon is ∼2000 m2 g−1.21–23
3.3. CO2 storage
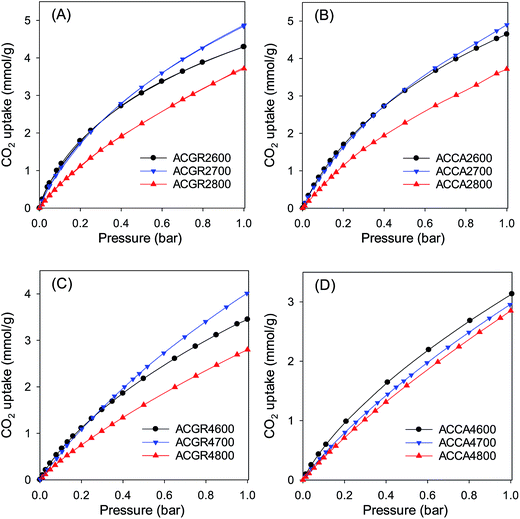
CO2 adsorption and storage by the activated carbons was investigated in the pressure range 0–20 bar at 25 °C. The CO2 sorption isotherms are shown in Fig. 5 (and S7†), and Tables 2 and 3 summarise the CO2 uptake at various pressures (0.15 bar, 1 bar and 20 bar). The CO2 uptake at 0.15 bar is between 0.6 and 1.5 mmol g−1, at 1 bar it is in the range of 2.8 to 5.0 mmol g−1, while at 20 bar the carbons store between 8.7 and 21.1 mmol g−1. As discussed above, carbons prepared at KOH/hydrochar ratio of 2 mainly possess narrow micropores, while those prepared at KOH/hydrochar ratio of 4 contain larger micropores and mesopores. A comparison of the porosity data and CO2 uptake shows that at pressure of up to 1 bar, the CO2 uptake is not determined by the total surface area, but by the pore size, wherein carbons with narrow micropores have the higher uptake (Fig. 3–5).21–23,38 It has been shown that narrow micropores are more efficient than larger micropores and mesopores at creating stronger interactions between CO2 molecules and adsorbents.15,39 The adsorption energy is optimised when the width of the pores is two times (in the case of slit-shaped pores), or three times (in the case of cylindrical-shaped pores) that of the CO2 molecule.40 Given that the kinetic diameter of CO2 is ∼3.3 Å,41 the optimum pore size is between 7 and 9 Å, which explains the excellent uptake of samples ACCA2600, ACCA2700 and ACGR2700 at pressure of up to 1 bar; the porosity of these carbons is dominated by pores of size 6 to 9 Å (Fig. 3 and 4). Therefore, in order for carbons to possess high CO2 uptake at pressure of up to 1 bar at room temperature it is necessary that they contain optimised pores rather than just a high surface area.14,25 However, the total surface area has an important role for CO2 uptake at pressure of 20 bar (Fig. S7†).38Thus, given the porosity of the present activated carbons, it is expected that samples activated at KOH/hydrochar ratio of 2 would exhibit high CO2 uptake at pressures of up to 1 bar, while those activated at KOH/hydrochar ratio of 4, and which have a high total surface area, would perform better at 20 bar. For the ACGR2T set of samples, there is an increase in CO2 uptake (at 1 bar) from 4.3 mmol g−1 for ACGR2600 to 4.9 mmol g−1 for sample ACGR2700. However, the uptake decreases to 3.8 mmol g−1 for sample ACGR2800, which is in line with broadening of the pore size (Fig. 3B).42 A similar trend is observed for ACCA2T samples derived from Camellia japonica; the CO2 uptake at 1 bar is 4.7 mmol g−1 (ACCA2600), 5.0 mmol g−1 (ACCA2700) and 3.7 mmol g−1 for sample ACCA2800 activated at 800 °C.
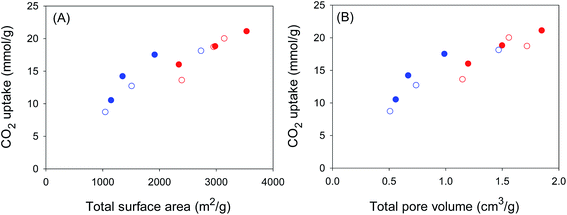
It is thus clear that for samples activated at KOH/hydrochar ratio 2, the optimum activating temperature for CO2 uptake at 1 bar is 700 °C. It is also important to note that the CO2 uptake for sample ACCA2700, at 25 °C, of 1.5 and 5.0 mmol g−1 at 0.15 and 1 bar, respectively, is amongst the highest ever reported for biomass-derived activated carbon materials (ESI Table S1†), thus illustrating the potential of these carbons as post-combustion CO2 storage materials. It is also apparent that samples with the highest surface area store the largest amounts of CO2 at 20 bar. Thus samples ACCA4800 and ACGR4700, with surface area of 3537 and 3143 m2 g−1, respectively, have CO2 uptake of 21.1 and 20.0 mmol g−1, respectively (Fig. S7†). Indeed, the CO2 uptake at 20 bar increases in a linear fashion with total surface area and pore volume as shown in Fig. 6. This confirms that storage of CO2 in porous carbons at moderate to high pressures (scenarios similar to pre combustion CO2 capture and storage) has more to do with filling up available surface and space rather than close interactions with the carbon surface, which is a requirement for low pressure (≤1 bar) adsorption.
In many previous reports on the adsorption of CO2 in porous materials, a clear trend has emerged wherein materials with high surface area exhibit high uptake at elevated pressure (ca. 20 bar and above) but have much poorer adsorption at low pressure (≤1 bar).43–52 On the other hand materials with excellent low pressure CO2 uptake, and which are characterised by low to moderate surface area, generally have low uptake at high pressure.15,16,21–23,53 This trend has been attributed to the fact that at low pressure, the key determinant of CO2 uptake is pore size (and consequently the interaction between the gas molecules and pore walls), while at high pressure the uptake mechanism is more reliant on surface area or space filling.15,16,21–23,43–53 Thus, at the present time, there are hardly any porous materials that simultaneously exhibits attractive CO2 adsorption suitable for both pre combustion (high pressure uptake) and post combustion (low pressure uptake) capture and storage applications.54,55 Regarding the relationship between textural properties and CO2 uptake, it is often the case that the presence of narrow pore channels (suitable for low pressure uptake) is not achievable for materials with the high surface area and pore volume required for large storage at elevated pressure.15,16,21–23,43–53 This is simply because porous materials, be they carbons or MOFs, with the highest surface area tend to have larger micropores and mesopores. For carbons, and activated carbons in particular, high surface area is often accompanied by enlargement of pore size.56 A closer inspection of Fig. 3 and 4, however, reveals that the pore size distribution of the present carbons is such that they retain a significant proportion of micropores even for the highest surface area samples. This is particularly the case for sample ACGR4700 (Fig. 3). We therefore compared the CO2 uptake of sample ACGR4700, at low and high pressure, with that of a commercially available activated carbon (AX21) and samples derived from lignin (sample LCA4800) and carbon nanotubes (sample CN4700), that have similar surface area.21–23
The nitrogen sorption isotherms and pore size distribution of sample ACGR4700 and the selected carbons (AX21, LAC4800 and CN4700), which have similar surface area (as given in Table 4) are shown in Fig. 7. All four samples have virtually identical surface area (3200 m2 g−1 ± 60 m2 g−1). Fig. 7 (inset), nevertheless, shows that the pore size distribution of sample ACGR4700 is comparatively shifted towards small micropores. In particular, sample ACGR4700 possesses a significant proportion of small (6 Å) pores that are absent for the other samples. Furthermore, the porosity of samples AX21, LAC4800 and CN4700 is dominated by mesopores of size 20–40 Å, which are almost non-existent in the ACGR4700 sample; indeed sample ACGR4700 has almost no pores larger than 30 Å, and in any case only a small proportion of pores larger than 20 Å. These observations suggest that the activation of Jujun grass occurs in such a manner as to simultaneously generate high surface area (>3000 m2 g−1) and micropores. This is evidenced by the high proportion of microporosity for ACGR4700, wherein 88% of surface area and 79% of pore volume arises from micropores, compared to between 35 and 55% (micropore surface area) and 23–49% (micropore volume) for the other three samples (Table 4).
| Sample | Surface areaa (m2 g−1) | Pore volumeb (cm3 g−1) | Pore sizec (Å) | CO2 uptaked (mmol g−1) | ||
|---|---|---|---|---|---|---|
| 0.15 bar | 1 bar | 20 bar | ||||
| a The values in the parenthesis refer to: amicropore surface area and bmicropore volume. cPore size distribution maxima obtained from NLDFT analysis. dCO2 uptake at 25 °C and various pressures (i.e., 0.15 bar, 1 bar and 20 bar). | ||||||
| ACGR4700 | 3144 (2753) | 1.56 (1.23) | 6/8/12/20 | 0.9 | 4.1 | 20.0 |
| AX21 | 3191 (1768) | 1.80 (0.89) | 12/21/28 | 0.4 | 2.6 | 22.5 |
| LAC4800 | 3235 (1978) | 1.77 (0.93) | 8/11/27 | 0.4 | 2.8 | 17.0 |
| CN4700 | 3202 (1106) | 2.14 (0.50) | 8/12/28 | 0.5 | 2.7 | 20.0 |
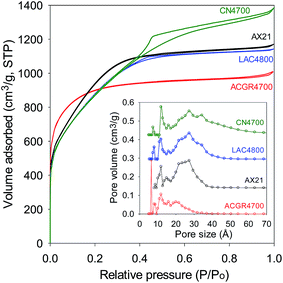 | ||
| Fig. 7 Nitrogen sorption isotherm and pore size distribution of sample ACGR4700 compared to commercially available or benchmark carbon materials of similar surface area. | ||
The porosity generated in sample ACGR4700 means that, unusually, the carbon simultaneously exhibits attractive CO2 uptake at low pressure (≤1 bar) and high pressure (20 bar) as shown in Fig. 8 and summarised in Table 4. Thus at pressure of 0.15 bar, sample ACGR4700 has uptake of 0.9 mmol g−1, which is twice as much as the 0.4–0.5 mmol g−1 for the other samples. At 1 bar, the CO2 uptake of ACGR4700 is an attractive 4.1 mmol g−1, which is at the top end for porous carbons in general,15,16,21–23,43–53 compared to a more modest 2.6–2.8 mmol g−1 for the other samples; this is equivalent to a 50% enhancement for sample ACGR4700. Remarkably, sample ACGR4700 still exhibits a high CO2 uptake of 20 mmol g−1 at 20 bar, which is comparable to that of the other three samples (Table 4). As far as we are aware, this is the first example of a porous material, and in particular a biomass-derived carbon, that exhibits excellent CO2 uptake under conditions that are relevant to both pre combustion and post combustion CO2 capture. More generally, our findings show that attempts to fabricate better all-round CO2 capture and storage materials should consider both the pore size and total porosity (surface area and pore volume), with the aim being attainment of the highest possible surface area and appropriately sized pore channels.
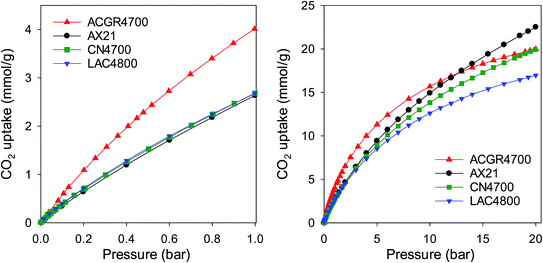 | ||
| Fig. 8 CO2 uptake of sample ACGR4700 compared to commercially available or benchmark carbon materials of similar surface area. | ||
4. Conclusions
We have shown that from a simple and green method of hydrothermal carbonization followed by chemical activation (using KOH as the activating agent), highly microporous activated carbon materials can be generated from low cost biomass precursors Jujun grass and Camellia japonica. The activated carbons have moderate to very high surface areas ranging from 1048 to 3537 m2 g−1, and pore volume ranging from 0.51 to 1.85 cm3 g−1. Depending on the activation conditions, the activated carbons present high levels of microporosity, with up to 95% of surface area arising from micropores. The CO2 uptake at 0.15 and 1 bar and 25 °C is, respectively, up to 1.5 and 5.0 mmol g−1 for carbons activated at 700 °C and KOH/carbon ratio of 2. Uptake of 5.0 mmol g−1 under ambient conditions is amongst the highest reported so far for biomass-derived activated carbons. At 20 bar, the CO2 uptake was dependent on total surface area, and reached 21.1 mmol g−1. Unusually, the activation of Jujun grass proceeded in such a manner as to generate carbons with high surface areas (>3000 m2 g−1), as well as high microporosity, with 88% of the surface area and 79% of the pore volume arising from micropores. Such a unique combination of porosity means that we have generated, for the first time, a porous material that simultaneously exhibits attractive CO2 uptake at low pressure (0.9 and 4.1 mmol g−1 at 0.15 and 1 bar, respectively) and also at high pressure (21.1 mmol g−1 at 20 bar), which represents excellent uptake under conditions that are relevant to both pre-combustion and post-combustion CO2 capture from flue gas streams. Overall, our findings are interesting not only due to the attractive CO2 uptake properties but also because the starting raw materials are renewable, readily available and low cost.Acknowledgements
We thank Dr. Graham Rance, at the Nottingham Nanotechnology and Nanoscience Centre (NNNC), for help with Raman spectroscopy and TEM analysis, and Mr. Sean Goodwin for help with SEM analysis. We thank Dr Jiawei Wang for the gift of the Jujun grass and Camellia japonica. H. M. C. thanks the University of Nottingham for a PhD scholarship.References
- K. S. Lackner, S. Brennan, J. M. Matter, A.-H. A. Park, A. Wright and B. van der Zwaan, Proc. Natl. Acad. Sci. U. S. A., 2012, 109, 13156 CrossRef CAS PubMed.
- G. T. Rochelle, Science, 2009, 325, 1652 CrossRef CAS PubMed.
- T. C. Drage, C. E. Snape, L. A. Stevens, J. Wood, J. Wang, A. I. Cooper, R. Dawson, X. Guo, C. Satterley and R. Irons, J. Mater. Chem., 2012, 22, 2815 RSC.
- S. Choi, J. H. Drese and C. W. Jones, ChemSusChem, 2009, 2, 796 CrossRef CAS PubMed.
- Q. Wang, J. Luo, Z. Zhong and A. Borgna, Energy Environ. Sci., 2011, 4, 42 CAS.
- A. Samanta, A. Zhao, G. K. H. Shimizu, P. Sarkar and R. Gupta, Ind. Eng. Chem. Res., 2012, 51, 1438 CrossRef CAS.
- S. Wang, S. Yan, X. Ma and J. Gong, Energy Environ. Sci., 2011, 4, 3805 CAS.
- K. Sumida, D. L. Rogow, J. A. Mason, T. M. McDonald, E. D. Bloch, Z. R. Herm, T.-H. Bae and J. R. Long, Chem. Rev., 2012, 112, 724 CrossRef CAS PubMed.
- J. Silvestre-Albero, A. Wahby, A. Sepulveda-Escribano, M. Martinez-Escandell, K. Kaneko and F. Rodriguez-Reinoso, Chem. Commun., 2011, 47, 6840 RSC.
- G.-P. Hao, W.-C. Li, D. Qian and A.-H. Lu, Adv. Mater., 2010, 22, 853 CrossRef CAS PubMed.
- M. Sevilla and A. B. Fuertes, J. Colloid Interface Sci., 2012, 366, 147 CrossRef CAS PubMed.
- J. P. Marco-Lozar, M. Kunowsky, F. Suarez-Garcia, J. D. Carruthers and A. Linares-Solano, Energy Environ. Sci., 2012, 5, 9833 CAS.
- Z. Chen, S. Deng, H. Wei, B. Wang, J. Huang and G. Yu, Front. Environ. Sci. Eng., 2013, 7, 326 CrossRef CAS.
- M. Nandi, K. Okada, A. Dutta, A. Bhaumik, J. Maruyama, D. Derks and H. Uyama, Chem. Commun., 2012, 48, 10283 RSC.
- M. Sevilla and A. B. Fuertes, Energy Environ. Sci., 2011, 4, 1765 CAS.
- M. J. Illán-Gómez, A. García-García, C. Salinas-Martínez de Lecea and A. Linares-Solano, Energy Fuels, 1996, 10, 1108 CrossRef.
- K. Gergova and S. Eser, Carbon, 1996, 34, 879 CrossRef CAS.
- (a) M.-M. Titirici and M. Antonietti, Chem. Soc. Rev., 2010, 39, 103 RSC; (b) M.-M. Titirici, R. J. White, N. Brun, V. L. Budarin, D. S. Su, F. del Monte, J. H. Clark and M. J. MacLachlan, Chem. Soc. Rev., 2015, 44, 250 RSC; (c) M.-M. Titirici, R. J. White, C. Falco and M. Sevilla, Energy Environ. Sci., 2012, 5, 6796 RSC.
- M. Sevilla and A. B. Fuertes, Carbon, 2009, 47, 2281 CrossRef CAS.
- G. Srinivas, J. Burress and T. Yildirim, Energy Environ. Sci., 2012, 5, 6453 CAS.
- (a) B. Adeniran and R. Mokaya, J. Mater. Chem. A, 2015, 3, 5148 CAS; (b) N. P. Wickramaratne and M. Jaroniec, J. Mater. Chem. A, 2013, 1, 112 RSC; (c) N. P. Wickramaratne and M. Jaroniec, ACS Appl. Mater. Interfaces, 2013, 5, 1849 CrossRef CAS PubMed.
- (a) B. Adeniran, E. Masika and R. Mokaya, J. Mater. Chem. A, 2014, 2, 14696 RSC; (b) X. Fan, L. Zhang, G. Zhang, Z. Shu and J. Shi, Carbon, 2013, 61, 423 CrossRef CAS; (c) Z. Zhang, J. Zhou, W. Xing, Q. Xue, Z. Yan, S. Zhuo and S. Z. Qiao, Phys. Chem. Chem. Phys., 2013, 15, 2523 RSC.
- (a) W. Sangchoom and R. Mokaya, ACS Sustainable Chem. Eng., 2015, 3, 1658 CrossRef CAS; (b) M. Saleh, J. N. Tiwari, K. C. Kemp, M. Yousuf and K. S. Kim, Environ. Sci. Technol., 2013, 47, 5467 CrossRef CAS PubMed; (c) H. Wei, S. Deng, B. Hu, Z. Chen, B. Wang, J. Huang and G. Yu, ChemSusChem, 2012, 5, 2354 CrossRef CAS PubMed.
- M. L. Martínez, M. M. Torres, C. A. Guzmán and D. M. Maestri, Ind. Crops Prod., 2006, 23, 23 CrossRef.
- M. Sevilla, P. Valle-Vigón and A. B. Fuertes, Adv. Funct. Mater., 2011, 21, 2781 CrossRef CAS.
- Y. Liu, J. S. Xue, T. Zheng and J. R. Dahn, Carbon, 1996, 34, 193 CrossRef CAS.
- K. S. W. Sing, D. H. Everett, R. A. W. Haul, L. Moscou, R. A. Pierotti, J. Rouquerol and T. Siemieniewska, Pure Appl. Chem., 1985, 57, 603 CrossRef CAS.
- J. A. Maciá-Agulló, B. C. Moore, D. Cazorla-Amorós and A. Linares-Solano, Carbon, 2004, 42, 1367 CrossRef.
- L. Zubizarreta, A. Arenillas, J.-P. Pirard, J. J. Pis and N. Job, Microporous Mesoporous Mater., 2008, 115, 480 CrossRef CAS.
- M. Sevilla, R. Mokaya and A. B. Fuertes, Energy Environ. Sci., 2011, 4, 2930 CAS.
- S. J. Gregg and K. S. W. Sing, Adsorption, Surface Area and Porosity, Academic Press, London, 1982 Search PubMed.
- C. Lu, H. Bai, B. Wu, F. Su and J. F. Hwang, Energy Fuels, 2008, 22, 3050 CrossRef CAS.
- E. F. Nasr, H. Knözinger, M. I. Hamdy and I. Z. Mohamed, Z. Phys. Chem., 1991, 173, 201 CrossRef.
- M. Sevilla, A. B. Fuertes and R. Mokaya, Energy Environ. Sci., 2011, 4, 1400 CAS.
- D. Lozano-Castelló, M. A. Lillo-Ródenas, D. Cazorla-Amorós and A. Linares-Solano, Carbon, 2001, 39, 741 CrossRef.
- T. Tay, S. Ucar and S. Karagöz, J. Hazard. Mater., 2009, 165, 481 CrossRef CAS PubMed.
- J. Dıaz-Terán, D. Nevskaia, J. Fierro, A. Lopez-Peinado and A. Jerez, Microporous Mesoporous Mater., 2003, 60, 173 CrossRef.
- X. Hu, M. Radosz, K. A. Cychosz and M. Thommes, Environ. Sci. Technol., 2011, 45, 7068 CrossRef CAS PubMed.
- Porosity in carbons: characterization and applications, ed. J. W. Patrick, Hodder Arnold, 1995 Search PubMed.
- D. H. Everett and J. C. Powl, J. Chem. Soc., Faraday Trans. 1, 1976, 72, 619 RSC.
- D. M. D'Alessandro, B. Smit and J. R. Long, Angew. Chem., Int. Ed., 2010, 49, 6058 CrossRef PubMed.
- M. Sevilla, J. B. Parra and A. B. Fuertes, ACS Appl. Mater. Interfaces, 2013, 5, 6360 CAS.
- C. Ducrot-Boisgontier, J. Parmentier, A. Faour, J. Patarin and G. D. Pirngruber, Energy Fuels, 2010, 24, 3595 CrossRef CAS.
- Y. D. Xia, R. Mokaya, G. S. Walker and Y. Q. Zhu, Adv. Energy Mater., 2011, 1, 678 CrossRef CAS.
- S. Builes, T. Roussel, C. M. Ghimbeu, J. Parmentier, R. Gadiou, C. Vix-Guterl and L. F. Vega, Phys. Chem. Chem. Phys., 2011, 13, 16063 RSC.
- O. K. Farha, A. O. Yazaydın, I. Eryazici, C. D. Malliakas, B. G. Hauser, M. G. Kanatzidis, S. T. Nguyen, R. Q. Snurr and J. T. Hupp, Nat. Chem., 2010, 2, 944 CrossRef CAS PubMed.
- H. Furukawa, N. Ko, Y. B. Go, N. Aratani, S. B. Choi, E. Choi, A. O. Yazaydin, R. Q. Snurr, M. O'Keeffe, J. Kim and O. M. Yaghi, Science, 2010, 329, 424 CrossRef CAS PubMed.
- (a) E. Masika and R. Mokaya, RSC Adv., 2013, 3, 17677 RSC; (b) C. Robertson and R. Mokaya, Microporous Mesoporous Mater., 2013, 179, 151 CrossRef CAS.
- A. Almasoudi and R. Mokaya, J. Mater. Chem. A, 2014, 2, 10960 CAS.
- A. Almasoudi and R. Mokaya, Microporous Mesoporous Mater., 2014, 195, 258 CrossRef CAS.
- G. Srinivas, V. Krungleviciute, Z. X. Guo and T. Yildirim, Energy Environ. Sci., 2014, 7, 335 CAS.
- J. M. Simmons, H. Wu, W. Zhou and T. Yildirim, Energy Environ. Sci., 2011, 4, 2177 CAS.
- B. Adeniran and R. Mokaya, Nano Energy, 2015, 16, 173 CrossRef CAS.
- (a) B. Ashourirad, A. K. Sekizkardes, S. Altarawneh and H. M. El-Kaderi, Chem. Mater., 2015, 27, 1349 CrossRef CAS; (b) A. Wahby, J. M. Ramos-Fernandez, M. Martnez-Escandell, A. Sepulveda-Escribano, J. Silvestre-Albero and F. Rodriguez-Reinoso, ChemSusChem, 2010, 3, 974 CrossRef CAS PubMed.
- (a) Y. Li, T. Ben, B. Zhang, Y. Fu and S. Qiu, Sci. Rep., 2013, 3, 2420 Search PubMed; (b) D. Lee, C. Zhang, C. Wei, B. L. Ashfeld and H. Gao, J. Mater. Chem. A, 2013, 1, 14862 RSC.
- M. Sevilla and R. Mokaya, Energy Environ. Sci., 2014, 7, 1250 CAS.
Footnote |
| † Electronic supplementary information (ESI) available. See DOI: 10.1039/c5ta09202g |
| This journal is © The Royal Society of Chemistry 2016 |

