Preparation of small-sized graphene oxide sheets and their biological applications†
Minfang
Zhang
*a,
Toshiya
Okazaki
a,
Yoko
Iizumi
a,
Eijiro
Miyako
b,
Ryota
Yuge
c,
Shunji
Bandow
d,
Sumio
Iijima
d and
Masako
Yudasaka
bd
aNanotube Application Research Center, National Institute of Advanced Industrial Science and Technology (AIST), 1-1-1 Higashi, Tsukuba, Ibaraki 305-8565, Japan. E-mail: m-zhang@aist.go.jp; Fax: +81-29861-6920; Tel: +81-29861-6758
bNanomaterials Research Institute, National Institute of Advanced Industrial Science and Technology (AIST), 1-1-1 Higashi, Tsukuba, Ibaraki 305-8565, Japan. Fax: +81-29861-6920; Tel: +81-29861-4818
cSmart Energy Research Laboratories, NEC Corporation, 34 Miyukigaoka, Tsukuba, 305-8501, Japan. Tel: +81-29850-1146
dFaculty of Science and Technology, Meijo University, 1-501 Shiogamaguchi, Tenpaku-ku, Nagoya 468-8502, Japan
First published on 18th November 2015
Abstract
By using carbon nanohorns as starting materials, small- and uniform-sized graphene oxide (S-GO) sheets can be prepared in high yields via an oxidation method. The obtained S-GO sheets have a band-like structure with a length of 20–50 nm, a width of 2–10 nm, and a thickness of 0.5–5 nm. S-GO sheets are hydrophilic due to abundant oxygenated groups on the surfaces and edges; hence, this nanomaterial is highly dispersive in aqueous solutions and some hydrophilic organic solvents. Additionally, like other S-GO samples, the S-GO sheets prepared here are strongly fluorescent over the visible light wavelength region. These characteristics underscore the high potential of S-GO sheets for nanomedical and diagnostic applications. In proof-of-concept experiments, the S-GO sheets were conjugated with an arginine–glycine–aspartic acid derivative for tumour-targeting drug delivery applications, and with an immunoglobulin G antibody for immunoassay applications.
1. Introduction
Graphene oxide (GO)1 sheets are atomically thin sheets of graphene with oxygenated groups, and are usually exfoliated from graphitic materials by oxidation. Besides their use as precursors for the preparation of graphene by reduction,2–8 GO-based materials are useful in fields such as electronics, membrane engineering, and medicine,9–12 owing mainly to their interesting electrical, thermal, mechanical, and optical properties. In particular, the hydrophilic nature and ease with which GO can be functionalized with various molecules at its abundant oxygenated groups indicate its enormous potential for applications in drug delivery systems and biosensors. For example, GO-based materials functionalized with tumour-targeting agents or phospholipid polyethylene glycol (PEG) derivatives are efficacious anticancer agents.10–13 Furthermore, given its heterogeneous electronic structure, GO is fluorescent over a broad range of wavelengths, suggesting its possible utility as a platform for diagnostic medical imaging.10Size control of nanoparticles is extremely important for certain applications, especially in drug delivery systems. The small size of nanoparticles (<100 nm) favours enhanced stealth effects, targeting abilities, and excretion. For example, after intraperitoneal administration to mice, ultrashort (20–80 nm), well-individualized single-wall carbon nanotubes (CNTs) escape detection by the reticuloendothelial system and are excreted through the kidneys and bile ducts, whereas long (1–2 μm) single-wall CNTs do/are not.14 On the other hand, unlike their 100 nm aggregates, small-sized carbon nanohorns (CNHs) of 20–50 nm escape trapping by macrophage cells in vitro15 and in vivo.16 Liu et al.12 reported that small-sized GO (S-GO) sheets with a polyethylene glycol (PEG) coating exhibited high uptake levels by tumour cells and were highly efficient for photo-thermal therapy, suggesting that S-GO materials in the 10–50 nm range might be favourable for medical applications. Moreover, because graphene nanoparticles of <10 nm in diameter have a band gap that can be used to generate field effect transistors,17–19 much attention has been focussed on their possible use in electronic and spintronic devices.18–20
GO samples ranging in size from dozens of nanometres to micrometres3–9 have been prepared to date; however, these samples are not suitable without separation for use as nanodevices and in nanomedicine therapies. Although Liu and colleagues12 successfully separated S-GO particles shorter than 20 nm from the common GO pool, the separation process (i.e., PEG functionalization and density gradient centrifugation) is not appropriate for large-scale preparation. Gradients and surfactants such as PEG adhere to the S-GO surface and cannot be easily removed, which limits the utility of S-GO materials as platforms for medical-related functionalization. S-GO particles with average sizes of 212, 147, 62, and 24 nm can be produced via a modified Hummer method with progressive oxidation for approximately 5–20 days.21 However, the long exfoliation process induces full oxidation of graphite, possibly resulting in the loss of the graphitic structure and limiting the utility of S-GO as a drug carrier. Therefore, it is highly desirable to develop a simple and scalable method for the preparation of S-GO samples that does not compromise the graphitic structure.
Long and narrow GO sheets, known as graphene ribbons, can be obtained by unzipping CNTs via oxidation.22,23 However, controlling the length of graphene ribbons and CNTs is difficult. Moreover, producing nanoribbons of high quality or in large volumes remains a challenge.17–23 On the other hand, ultra-small GO particles (<10 nm, termed carbon quantum dots or C-dots) are produced from graphite oxide by a hydrothermal route,24 solvo-thermal treatment,25 or by other means.26 Nevertheless, C-dots are unsuitable for electronic and spintronic devices, and they cannot be used as drug carriers, because nanoparticles of <10 nm are rapidly cleared by the kidneys.27
Here, rather than using graphite materials or CNTs as starting materials, we employed carbon nanohorns (CNHs)28 as precursors for the high-yield production of surfactant-free S-GO sheets with uniform size using an oxidative exfoliation method. CNHs are single-graphene tubules with horn-shaped tips, with diameters of 2–5 nm, and lengths of 40–50 nm. Typically, thousands of CNHs form a spherical aggregate with a diameter of ∼100 nm.28 The interaction between CNHs is strong, and the aggregates cannot be separated easily. Recently, individual CNHs or small-sized aggregates with particle sizes of ∼20–50 nm were separated from the aggregates by oxidative exfoliation.15 Because CNTs can be unzipped to prepare GO nanoribbons,22,23 we hypothesized that individual CNHs could likewise be unzipped and used to form S-GO sheets via oxidation.
The present study shows that, under appropriate oxidation conditions, S-GO sheets can be generated with a uniform length of 20–50 nm, a width of 2–10 nm, and a thickness of 0.5–5 nm, corresponding to the size of individual nanohorns. Notably, the S-GO sheets prepared in this manner were free from surfactants, enabling ready functionalization. Furthermore, the S-GO yield was in the range of 40% to 60%, or much higher than the other yields reported to date. Like C-dots, the obtained S-GO sheets were fluorescent, and exhibited an ample supply of oxygenated groups on their surfaces and edges. CNH-derived S-GO sheets also showed band-like forms, similar to the structures of CNT-derived S-GO nanoribbons. Thus, we speculated that the S-GO sheets prepared herein would be useful as fluorescent labels, similar to C-dots, or as drug carriers, like the nanographene oxide obtained by gradient density separation for biomedical applications.11,13 As a proof of concept, we conjugated the prepared S-GO material with an immunoglobulin G (IgG) antibody and evaluated its performance in an immunoassay; and with an arginine–glycine–aspartic acid (RGD) derivative and assessed its suitability for tumour-targeting drug delivery applications.
2. Results and discussion
2.1. Characteristics of the prepared S-GO sheets
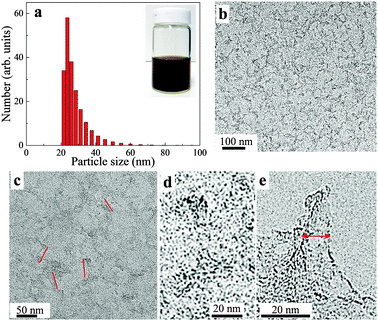
S-GO sheets were prepared by an oxidative exfoliation method (Fig. 1) using CNHs as starting materials instead of CNTs or graphite.22,29,30 The method included intercalating CNHs with H2SO4 (98%) by soaking overnight, followed by addition of the oxidant, KMnO4. The reaction was performed at 70 °C for 40 min, which is a relatively weak condition compared with that used for the preparation of GO particles from graphite21 or CNTs.22 Finally, a brown aqueous S-GO solution was obtained (Fig. 2a, inset). Aqueous dispersions of S-GO particles in phosphate-buffered saline (PBS) or an alternative hydrophilic organic solvent maintained their fluorescence properties and were stable without sedimentation over many months (Fig. S1a–c, ESI†). | ||
| Fig. 1 Overview of the steps involved in the preparation of S-GO sheets using CNHs as starting materials. | ||
Transmission electron microscopy (TEM) analysis (Fig. 2b–e) showed that the obtained S-GO particles had irregular shapes and small sizes; from the TEM images, the lengths and widths of the particles were estimated to be 20–50 nm and 2–10 nm, respectively (Fig. 2c and e, red lines). Consistent with these estimations, a dynamic light scattering (DLS) analysis (Fig. 2a) showed that the particle sizes were in the range of 20–40 nm. Furthermore, atomic force microscopy (AFM) data (obtained by casting the S-GO sample dispersed in water at a high concentration (2 mg ml−1) onto a silicon wafer) (Fig. 3a) revealed that the S-GO particles were ∼0.5–2 nm thick (Fig. 3b).
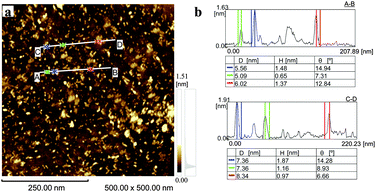 | ||
| Fig. 3 (a) AFM image of the prepared S-GO particles distributed on a silicon substrate. (b) The height profiles along the A-to-B and C-to-D lines shown in (a). | ||
A Fourier transform infra-red (FT-IR) absorption spectrum of the S-GO sample revealed the presence of OH (∼3400 cm−1), C![[double bond, length as m-dash]](https://www.rsc.org/images/entities/char_e001.gif) O (1725 cm−1), C
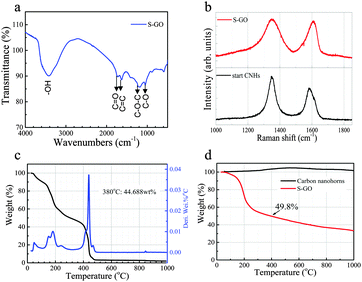
O (1725 cm−1), C![[double bond, length as m-dash]](https://www.rsc.org/images/entities/char_e001.gif) C (1620 cm−1), C–O (1050 cm−1), and C–O–C (1200 cm−1) groups (Fig. 4a).31,32 Similar to that of the CNH starting material, the Raman spectrum of the S-GO sample showed two peaks corresponding to the D-band and the G-band at ∼1350 cm−1 and 1600 cm−1, respectively (Fig. 4b).28 Detection of the G-band for S-GO indicates that the graphitic structure still existed in the prepared S-GO sample. The D-band peak is related to a disordered hexagonal graphitic network, and became broader in the S-GO sample. Because an increase in the intensity and the width of the D-band usually signifies an increased number of graphene sheet defects or an increased number of edges in the graphitic structure,33 we compared the D/G peak-area ratio of the S-GO particles with that of the starting CNHs. Consequently, the D/G peak-area ratios of the S-GO sample and the CNHs were ∼1.5 and 0.9, respectively, indicating an increased number of defects or a decreased S-GO sheet size resulting from the oxidative exfoliation procedure. In addition, the G-band peak energy of the S-GO sample (1610 cm−1) was slightly higher than that of the CNHs (1590 cm−1), also reflecting a decreased sheet size and/or a more disordered graphitic network for the prepared S-GO sample versus the starting CNHs.34
C (1620 cm−1), C–O (1050 cm−1), and C–O–C (1200 cm−1) groups (Fig. 4a).31,32 Similar to that of the CNH starting material, the Raman spectrum of the S-GO sample showed two peaks corresponding to the D-band and the G-band at ∼1350 cm−1 and 1600 cm−1, respectively (Fig. 4b).28 Detection of the G-band for S-GO indicates that the graphitic structure still existed in the prepared S-GO sample. The D-band peak is related to a disordered hexagonal graphitic network, and became broader in the S-GO sample. Because an increase in the intensity and the width of the D-band usually signifies an increased number of graphene sheet defects or an increased number of edges in the graphitic structure,33 we compared the D/G peak-area ratio of the S-GO particles with that of the starting CNHs. Consequently, the D/G peak-area ratios of the S-GO sample and the CNHs were ∼1.5 and 0.9, respectively, indicating an increased number of defects or a decreased S-GO sheet size resulting from the oxidative exfoliation procedure. In addition, the G-band peak energy of the S-GO sample (1610 cm−1) was slightly higher than that of the CNHs (1590 cm−1), also reflecting a decreased sheet size and/or a more disordered graphitic network for the prepared S-GO sample versus the starting CNHs.34
A thermogravimetric analysis (TGA) was next performed to determine the total quantity of oxygenated groups and defects formed on the surfaces of the S-GO sheets. The results showed that the combustion temperature of the prepared S-GO particles in an O2 atmosphere (∼440 °C) was lower than that of the CNHs (∼580 °C), because of the small size and abundant defects of the former (Fig. 4c). The weight loss of the S-GO sample when heated from room temperature to 400 °C in helium, corresponding to the decomposition of carboxylic groups, was ∼50% (Fig. 4d), indicating that every five or six carbon atoms contained one COOH group. Based on the quantity of the freeze-dried product, the yield of the S-GO material was estimated to be 51% or more. The amount of the freeze-dried S-GO material (80 mg) was equivalent to 80% of the initial amount of CNHs (100 mg), while the amount of carbon in the S-GO sample was ∼64% (50% + 50% × 12/44). Hence, the yield of S-GO particles from CNHs was about 51% (80% × 0.64).
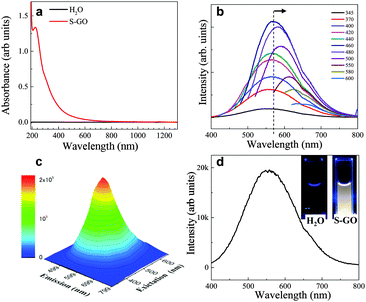
The optical absorption spectrum (ultraviolet (UV)-visible (Vis)-near infrared (NIR)) of the prepared S-GO particles in water (0.1 mg ml−1) showed one peak at ∼225 nm corresponding to the π–π* transition of the C![[double bond, length as m-dash]](https://www.rsc.org/images/entities/char_e001.gif) C groups, as well as a very weak shoulder at ∼300 nm (Fig. 5a) corresponding to the n–π* transition of epoxide (C–O–O) and/or peroxide (R–O–O–R) groups.35,36 The fluorescence spectra were fairly wide at various excitation wavelengths (∼165 nm full width at half maximum). The fluorescence peak position (∼560 nm) did not change when the excitation wavelength was increased from 345 to 440 nm, but was gradually red-shifted to 660 nm when the excitation wavelength was increased from 460 to 600 nm (Fig. 5b and c). Such excitation-dependent fluorescence intensity actions are consistent with the results of previous studies of fluorescent C-dots,24,25,37 and may have stemmed from the different sizes of the S-GO particles prepared herein.
C groups, as well as a very weak shoulder at ∼300 nm (Fig. 5a) corresponding to the n–π* transition of epoxide (C–O–O) and/or peroxide (R–O–O–R) groups.35,36 The fluorescence spectra were fairly wide at various excitation wavelengths (∼165 nm full width at half maximum). The fluorescence peak position (∼560 nm) did not change when the excitation wavelength was increased from 345 to 440 nm, but was gradually red-shifted to 660 nm when the excitation wavelength was increased from 460 to 600 nm (Fig. 5b and c). Such excitation-dependent fluorescence intensity actions are consistent with the results of previous studies of fluorescent C-dots,24,25,37 and may have stemmed from the different sizes of the S-GO particles prepared herein.
Due to the wide fluorescence range of the prepared S-GO particles in the visible region, white fluorescence was observed by the naked eye when the sheets were irradiated by 345 nm light (Fig. 5d, inset). By contrast, pure water did not show any white fluorescence at this wavelength. The quantum yield of the S-GO particles at an excitation wavelength of 480 nm was estimated to be 3.9% (eqn (S1) and Table S1, ESI†), which is markedly higher than that of GO particles prepared from graphite (0.02%), but still lower than that of functionalized C-dots (>11%).25,38,39
GO fluorescence is reportedly associated with the electronic transition between isolated polyaromatic structures and passivated surface defects or groups.17,23,34–37 The fact that the fluorescence peaks of the S-GO sample prepared here were broader than those of GO particles prepared from graphite might be due to a larger variability in surface groups and a wider size distribution of polyaromatic island structures. The C–OH and COOH (or C![[double bond, length as m-dash]](https://www.rsc.org/images/entities/char_e001.gif) O) groups on the surfaces of GO sheets37–43 are the two main contributors to fluorescence, whereas the carboxyl groups are thought to be pH-dependent components, and the epoxide and hydroxyl groups are regarded as responsible for non-pH-dependent emission.36 COOH-rich GO sheets have broad fluorescence peaks at long wavelengths (∼650 nm), and C–OH-rich GO sheets have relatively narrow peaks at short wavelengths (∼500 nm).37 Because the fluorescence of the prepared S-GO sample was pH-dependent and almost completely disappeared (especially at longer wavelengths) at pH 12–13 (Fig. S2, ESI†), we believe that the fluorescence of the sample originated mainly from the polyaromatic S-GO structure and the COOH groups at the edges. The TGA results (Fig. 4d) are also suggestive of a high quantity of COOH groups in the prepared S-GO sample (∼50 wt%).
O) groups on the surfaces of GO sheets37–43 are the two main contributors to fluorescence, whereas the carboxyl groups are thought to be pH-dependent components, and the epoxide and hydroxyl groups are regarded as responsible for non-pH-dependent emission.36 COOH-rich GO sheets have broad fluorescence peaks at long wavelengths (∼650 nm), and C–OH-rich GO sheets have relatively narrow peaks at short wavelengths (∼500 nm).37 Because the fluorescence of the prepared S-GO sample was pH-dependent and almost completely disappeared (especially at longer wavelengths) at pH 12–13 (Fig. S2, ESI†), we believe that the fluorescence of the sample originated mainly from the polyaromatic S-GO structure and the COOH groups at the edges. The TGA results (Fig. 4d) are also suggestive of a high quantity of COOH groups in the prepared S-GO sample (∼50 wt%).
As shown above, the use of CNHs as starting materials for GO preparation resulted in the production of large quantities of uniformly sized S-GO particles of 20–50 nm by a rather weak oxidation process. Given the characteristics of CNHs (i.e., a uniform size of ∼50 nm in length and many pentagonal and heptagonal defects on the walls),28 the unzipping of CNHs to GO sheets becomes relatively easy, and therefore, S-GO production is scalable. This differs from the production of similarly sized S-GO particles from nanotubes22,23 or graphite.21
2.2. Use of S-GO sheets as fluorescent labels for immunological applications
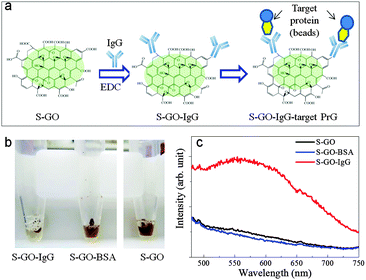
The strong fluorescence of the S-GO particles and the presence of abundant functional groups, particularly COOH groups, on their surfaces suggests their prospective use in biomedical applications, including drug delivery and bio-imaging systems, and as biosensors. In proof-of-concept experiments, we evaluated the effectiveness of the prepared S-GO sample as a fluorescent label for immunoassays. To this end, the carboxyl groups of the S-GO particles were reacted with the amino groups of an IgG antibody (Fig. 6a). The fluorescence of the S-GO–IgG conjugate was confirmed by measuring the spectrum at an excitation wavelength of 400 nm (Fig. S3, ESI†). In addition, the immunoreactivity of the conjugate was confirmed by immunoprecipitation (IP) with magnetic beads bound to protein G (PrG), which specifically couples with IgGs. After IP, the brown colour of the S-GO–IgG solution became almost colourless (Fig. 6b). On the other hand, control solutions of S-GO particles without IgG, or S-GO conjugated to bovine serum albumin (S-GO-BSA), failed to show any corresponding colour changes after IP, indicating that most of the prepared S-GO sheets were indeed conjugated to IgG.The fluorescence spectrum of the S-GO–IgG/PrG preparation eluted from the magnetic beads showed a peak at ∼560 nm when the excitation wavelength was 420 nm (Fig. 6c, red line), while the fluorescence spectrum of the PrG-beads alone showed no such peak (data not shown). In addition, the eluted control samples lacked the peak characteristics of the S-GO sample (Fig. 6c, blue and black lines), suggesting the utility of S-GO as a label in immunoassays.
A drawback of using S-GO as a label is that its fluorescence intensity decreases after reaction with IgG or BSA (Fig. S3, ESI†). Because the strong fluorescence of the S-GO sample was primarily associated with polyaromatic structures containing COOH groups at the edges, the consumption of COOH by the reaction with IgG or BSA might have caused the observed reduction in fluorescence intensity. Therefore, when S-GO is used as a fluorescent label, controlling the degree of COOH-mediated conjugation becomes a consideration.
2.3. Potential application of S-GO sheets for targeted drug delivery applications
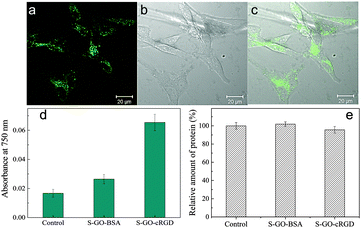
Peptide sequences containing RGD motifs bind preferentially to the αvβ3 integrin, which is overexpressed on the plasma membranes of endothelial cells derived from tumours, including pancreatic and breast cancers.44 Therefore, functionalization of S-GO particles with RGD-based peptides is a promising approach to deliver anticancer drugs or imaging agents to tumour cells or the tumour vasculature.42 An RGD derivative of cyclo[Arg-Gly-Asp-D-Phe-Lys] (cRGD) was conjugated with the prepared S-GO sample and incubated with αvβ3 integrin-overexpressing U-87 MG glioblastoma cells. The cells ingested the S-GO-cRGD particles far more readily than the control S-GO-BSA particles (Fig. 7d). Confocal microscopy analysis also showed that Alexa Fluor 488-labeled S-GO-cRGD sheets accumulated inside the cells (Fig. 7a–c). Additionally, Bradford assays revealed that the cytotoxicities of the S-GO-BSA and S-GO-cRGD samples were quite low (Fig. 7e and Fig. S4a, b, ESI†), whereas the size distributions of the S-GO-BSA and S-GO-cRGD particles were similar (Fig. S5, ESI†). Overall, these findings agree with previous reports,10–13 and suggest that S-GO sheets may be useful for biomedical applications.3. Conclusions
This study describes the large-scale production of S-GO sheets with board-like structures (length = 10–50 nm; width = 2–10 nm; number of layers = 5–10) by using CNHs as starting materials. Compared with those generated previously using various different methods, the obtained S-GO particles exhibited unique characteristics, including high solubility in aqueous solutions and some organic solvents, strong fluorescence, abundant oxygenated groups (particularly carboxylic groups), and easy modification. In addition, their small sizes and low toxicity suggest that they may be useful for biomedical applications.To demonstrate this possibility, we conjugated the S-GO sheets with an IgG antibody or a tumour-targeting RGD derivative. The S-GO–IgG conjugate could be immunoprecipitated with PrG-bound magnetic beads, indicating the probable use of S-GO as a fluorescent label in immunoassays. Furthermore, S-GO particles conjugated to cRGD were taken up by U-87 MG glioblastoma cells, which express the RGD receptor, αvβ3 integrin, on their surface. The uptake of S-GO-cRGD by U-87 MG cells was markedly higher than that of S-GO or S-GO-BSA. Based on these characteristics, we propose that the S-GO sheets prepared from CNHs can serve as promising nanoparticles for medical and diagnostic use.
4. Experimental section
4.1. S-GO preparation
The method used to prepare S-GO particles was similar to the Hummers method26 or the unzipping of CNTs,18 but was simplified by using CNHs as starting materials. The CNHs were obtained by CO2 laser ablation of graphite without the use of metal catalysts.25 The preparation of the S-GO sample (Fig. 1) was initiated by immersing CNHs (100 mg) in H2SO4 (10 ml, 98%; Wako) for 24 h with stirring. After adding KMnO4 (1 g; Wako) at room temperature, the mixture was stirred at 70 °C for 40 min and then cooled in an ice bath. Next, water (30 ml) was added to the mixture in the ice bath, and the sample was reheated to 70 °C. After continuous stirring at 70 °C for a further 30 min, the reaction was terminated by adding distilled water (22 ml) and 30% H2O2 solution (8 ml). The mixture was then washed by repeated centrifugation with a 15% HCl aqueous solution, followed by distilled water filtered through an Ultra-15 filter unit with Ultracel-100 membrane (Amicon) until the filtrate was neutralized. The obtained sample was dispersed in water (50 ml) using a horn-type sonicator at 300 W for 30 min, and centrifuged at 3000g for 20 min to remove large aggregates. The upper 90% of the supernatant was collected and used as the S-GO sample.4.2. Evaluation of the characteristics of S-GO sheets
S-GO particle sizes in aqueous solution were estimated using the DLS method, a FPAR-1000 instrument (Otsuka Electronic Co., Ltd), and the CONTIN fitting procedure included with the instrument's software. For direct observation of particle morphologies and sizes, the S-GO sheets were analysed using TEM (120 keV, 36 μA) with a Topcon 002B HRTEM instrument (Topcon Corporation) or AFM with a SPM 9600 instrument (Shimadzu). For TEM, a single drop of the S-GO dispersion was placed onto a copper grid coated with an ultrathin carbon film, dried at room temperature, and imaged. For AFM, the aqueous S-GO solution was dropped onto a silicon wafer, dried at room temperature, and imaged.To measure optical absorption and fluorescence spectra, the S-GO suspension was diluted in water to 0.1 mg ml−1 and analysed using a Lambda 1050 UV-Vis-NIR spectrometer (PerkinElmer Japan Co., Ltd) and a Fluorolog-3 fluorescence spectrometer (Horiba), respectively. For FT-IR measurements, one drop of the S-GO dispersion was placed onto a zinc selenide plate (Edmund Optics), vacuum-dried at room temperature, and analysed using a Spectrum One instrument (PerkinElmer). The S-GO suspension was also freeze-dried and weighed to estimate its concentration and yield. Freeze-dried S-GO was measured by TGA (heating rate = 10 °C min−1) in an atmosphere of oxygen using a Q500 instrument (TA Instrument) or in helium using a Thermo plus TG 8120 apparatus (Rigaku). The S-GO yield was estimated based on the quantity of freeze-dried sample, the starting amount of CNHs, and the TGA results in helium.
4.3. Conjugation of S-GO particles with IgG
S-GO particles were conjugated with IgG via a method similar to that reported previously.45 Briefly, the S-GO sample (2 ml; 1.5 mg ml−1) was mixed with 2-morpholinoethanesulfonic acid buffer solution (2 ml, 100 mM, pH 5.0) containing N-hydroxysuccinimide (2 mg) and N-(3-dimethylaminopropyl)-N-ethylcarbodiimide hydrochloride (2 mg) by stirring for 15 min. The mixture was then passed through a centrifugal ultrafilter (MW cut-off = 10 kDa) to remove excess N-hydroxysuccinimide and N-(3-dimethylaminopropyl)-N-ethylcarbodiimide hydrochloride. The obtained sample was redispersed in phosphate buffer (4 ml, pH 8.0) and mixed with rabbit serum IgG (1 mg; Sigma) by stirring for 2 h at room temperature. After the reaction, the S-GO suspension was passed through a centrifugal ultrafilter (MW cut-off = 300 kDa) to remove unreacted IgG, and then washed three times with PBS. The obtained S-GO–IgG was dispersed in Tris-HCl buffer (4 ml; pH 7.0) and stored at 4 °C. The fluorescence intensity of S-GO–IgG was measured at an excitation wavelength of 420 nm using a Fluorolog-3 fluorescence spectrometer.4.4. IP of S-GO–IgG conjugate
S-GO–IgG IP was achieved using PrG-bound magnetic beads (500 μl; Bio-Adembeads Protein G; Ademtech). According to the manufacturer's instructions, the PrG-bound beads were washed and dispersed in PBS containing 0.5% Tween 20, and the S-GO–IgG solution (500 μl) was mixed with the washed PrG-bound beads at room temperature for 15 min. The suspended S-GO–IgG/PrG-beads were collected using a magnet, and the supernatant was removed by two washes with 50 mM phosphate buffer (20 μl, pH 8.0). Finally, the S-GO–IgG particles were eluted by dispersing the beads in 0.2 M glycine solution (1 ml). The eluted solution was collected by removing the beads with a magnet, and its fluorescence was assessed using a Fluorolog-3 fluorescence spectrometer. To confirm the specific coupling of the S-GO–IgG conjugate with PrG, two control samples of S-GO alone and S-GO-BSA were employed. The method used to conjugate S-GO with BSA was the same as that used for S-GO–IgG conjugation, and the same IP processes were performed using S-GO and S-GO-BSA instead of S-GO–IgG.4.5. Generation of the S-GO-cRGD conjugate and cellular uptake experiments
The same method used to generate S-GO–IgG particles was used to conjugate S-GO sheets with the RGD derivative of cRGD (Peptide International). The obtained S-GO-cRGD material was dispersed in PBS at a concentration of 1 mg ml−1. For cell uptake assays, cRGD was labelled with Alexa Fluor 488 (molecular probes) prior to conjugation with S-GO. The labelled conjugate was designated S-GO-cRGD*.U-87 MG human glioma cells (ATCC) were cultured in Eagle's minimum essential medium (ATCC) containing 10% fetal bovine serum (Gibco) and 0.1% streptomycin/penicillin (Gibco). The cells were maintained at 37 °C in a 5% CO2 atmosphere. To observe the cellular uptake of S-GO-cRGD*, U-87 MG cells (3.5 ml, 2 × 10⁵ cells per ml) were seeded into a glass-bottomed dish and grown for 24 h. The medium was replaced with medium containing S-GO-cRGD* (0.05 mg ml−1), and the cells were incubated for a further 24 h. Subsequently, the medium was removed, and the cells were rinsed with PBS to eliminate the S-GO-cRGD* material that was not taken up by the cells. After the addition of fresh medium, the cells were observed using an LSM 5 PASCAL confocal laser scanning microscope (Carl Zeiss, Inc.).
For quantitative analyses of intracellular S-GO-cRGD or S-GO-BSA, the cells were seeded into six-well plates (2 × 10⁵ cells per ml) and grown for 24 h (n = 3 replicates). The cells were then washed twice with PBS, and CelLytic M solution (1 ml; Sigma) was added to each well. After incubation for at least 1 h, the cell lysates were collected and centrifuged for 40 min. An aliquot of the supernatant (0.02 ml) was removed from each well and used in a Bradford protein assay. To estimate the cellular uptake of the S-GO sheets, the residual cell lysate was ultra-sonicated (Vibra-Cell; Sonics Inc.) at 300 W for 10 min. The light absorbance of the sonicated cell lysate at 750 nm was then measured using a Lambda 1050 UV-Vis-NIR spectrophotometer. The uptake quantities of S-GO-cRGD or S-GO-BSA (relative to the uptake quantity of a control sample of medium lacking the addition of S-GO materials) were estimated by measuring the optical absorbance at 750 nm, as reported previously by our group for the estimation of CNH uptake quantities.15
Acknowledgements
This work was supported in part by the Japan Society for the Promotion of Science (JSPS) KAKENHI grant (Grant-in-Aid for Scientific Research C, No. 25390024).References
- S. Stankovich, D. Dikin, G. Dommett, K. Kohlhaas, E. Zimney, E. Stach, R. Piner, S. Nguyen and R. Ruoff, Nature, 2006, 442, 282 CrossRef CAS PubMed.
- S. Stankovich, R. Piner, X. Chen, N. Wu, S. Nguyen and R. Ruoff, J. Mater. Chem., 2006, 16, 155 RSC.
- S. Stankovich, D. Dikin, R. Piner, K. Kohlhaas, A. Kleinhammes, Y. Jia and Y. Wu, Carbon, 2007, 45, 1558 CrossRef CAS.
- Y. Xu, H. Bai, G. Lu, C. Li and G. Shi, J. Am. Chem. Soc., 2008, 130, 5856 CrossRef CAS PubMed.
- S. Park and R. Ruoff, Nat. Nanotechnol., 2009, 4, 217 CrossRef CAS PubMed.
- O. Compton and S. Nguyen, Small, 2010, 6, 711 CrossRef CAS PubMed.
- S. Mao, H. Pu and J. Chen, RSC Adv., 2012, 2, 2643 RSC.
- J. Zhao, S. Pei, W. Ren, L. Gao and H. Cheng, ACS Nano, 2010, 4, 5245 CrossRef CAS PubMed.
- S. Pan and I. Aksay, ACS Nano, 2011, 5, 4073 CrossRef CAS PubMed.
- Z. Liu, J. Robinson, X. Sun and H. Dai, J. Am. Chem. Soc., 2008, 130, 10876 CrossRef CAS PubMed.
- X. Sun, Z. Liu, K. Welsher, J. Robinson, A. Goodwin, S. Zaric and H. Dai, Nano Res., 2008, 1, 203 CrossRef CAS PubMed.
- K. Yang, S. Zhang, G. Zhang, X. Sun, S. Lee and Z. Liu, Nano Lett., 2010, 10, 3318 CrossRef CAS PubMed.
- X. Yang, X. Zhang, Y. Ma, H. Yi, Y. Wang and Y. Chen, J. Mater. Chem., 2009, 19, 2710 RSC.
- J. Kolosnjaj-Tabi, K. Harman, S. Boudjemaa, J. Ananta, G. Morgant, H. Szwarc, L. Wilson and F. Moussa, ACS Nano, 2010, 4, 1481 CrossRef CAS PubMed.
- M. Zhang, X. Zhou, S. Iijima and M. Yudasaka, Small, 2012, 8, 2524 CrossRef CAS PubMed.
- M. Zhang, T. Yamaguchi, S. Iijima and M. Yudasaka, Nanomedicine, 2013, 9, 657 CrossRef CAS PubMed.
- X. Li, X. Wang, L. Zhang, S. Lee and H. Dai, Science, 2008, 319, 1229 CrossRef CAS PubMed.
- X. Wang, Y. Ouyang, X. Li, H. Wang, J. Guo and H. Dai, Phys. Rev. Lett., 2008, 100, 206803 CrossRef PubMed.
- Z. Chen, Y. Lin, M. Rooks and P. Avouris, Phys. E, 2007, 40, 228–232 CrossRef CAS.
- M. Han, B. Ozyilmaz, Y. Zhang and P. Kim, Phys. Rev. Lett., 2007, 98, 206805 CrossRef PubMed.
- L. Zhang, J. Liang, Y. Huang, Y. Ma, Y. Wang and Y. Che, Carbon, 2009, 47, 3365–3368 CrossRef CAS.
- D. V. Kosynkin, A. L. Higginbotham, A. Sinitskii, J. R. Lomeda, A. Dimiev, B. K. Price and J. M. Tour, Nature, 2009, 458, 872 CrossRef CAS PubMed.
- L. Jiao, L. Zhang, X. Wang, G. Diankov and H. Dai, Nature, 2009, 458, 877 CrossRef CAS PubMed.
- D. Pan, J. Zhang, Z. Li and M. Wu, Adv. Mater., 2010, 22, 734 CrossRef CAS PubMed.
- S. Zhu, J. Zhang, C. Qiao, S. Tang, Y. Li, W. Yuan, B. Li, L. Tian, F. Liu, R. Hu, H. Gao, H. Wei, H. Zhang, H. Sun and B. Yang, Chem. Commun., 2011, 47, 6858 RSC.
- S. Fujii and T. Enoki, J. Am. Chem. Soc., 2010, 132, 10034 CrossRef CAS PubMed.
- W. Deen, J. Clin. Invest., 2004, 114, 1412 CrossRef CAS PubMed.
- S. Iijima, M. Yudasaka, R. Yamada, S. Bandow, K. Suenaga, F. Kokai and K. Takahashi, Chem. Phys. Lett., 1999, 309, 165 CrossRef CAS.
- W. S. Hummers and R. Offeman, J. Am. Chem. Soc., 1958, 80, 1339 CrossRef CAS.
- D. Marcano, D. Kosynkin, J. Berlin, A. Sinitskii, Z. Sun, A. Slesarev, L. Alemany, W. Lu and J. Tour, ACS Nano, 2010, 4, 4806 CrossRef CAS PubMed.
- C. Hontoria-Lucas, A. Lopez-Peinado, J. Lopez-Gonzalez, M. Rojas-Cervantes and R. Martin-Aranda, Carbon, 1995, 33, 1585 CrossRef CAS.
- T. Szabo, O. Berkesi and I. Dekany, Carbon, 2005, 43, 3186 CrossRef CAS.
- A. C. Ferrari, Solid State Commun., 2007, 143, 47 CrossRef CAS.
- K. Kinoshita, Carbon, Electrochemical and Physicochemical Properties, John Wiley & Sons, New York, Chichester, Brisbane, Toronto, Singapore, 1988 Search PubMed.
- S. Saxena, T. Tyson, S. Shukla, E. Negusse, H. Chen and J. Bai, Appl. Phys. Lett., 2011, 99, 013104 CrossRef.
- J. Shen, Y. Zhu, C. Chen, X. Yang and C. Li, Chem. Commun., 2011, 47, 2580 RSC.
- S. Cushing, M. Li, F. Huang and N. Wu, ACS Nano, 2014, 8, 1002 CrossRef CAS PubMed.
- Q. Mei, K. Zhang, G. Guan, B. Liu, S. Wang and Z. Zhang, Chem. Commun., 2010, 46, 7319 RSC.
- F. Jiang, D. Chen, R. Li, Y. Wang, G. Zhang, S. Li, J. Zheng, N. Huang, Y. Gu, C. Wang and C. Shu, Nanoscale, 2013, 5, 1137 RSC.
- X. Zhang, X. Shao and S. Liu, J. Phys. Chem. A, 2012, 116, 7308 CrossRef CAS PubMed.
- C. Galande, A. Mohite, A. Naumov, W. Gao, L. Ci, A. Ajayan, H. Gao, A. Srivastava, R. Weisman and P. Ajayan, Sci. Rep., 2011, 1, 85 Search PubMed.
- K. Loh, O. Bao, G. Eda and M. Chhowalla, Nat. Chem., 2010, 2, 1015 CrossRef CAS PubMed.
- M. Li, S. Cushing, X. Zhou, S. Guo and N. Wu, J. Mater. Chem., 2012, 22, 23374 RSC.
- F. Danhier, A. Breton and V. Preat, Mol. Pharmaceutics, 2012, 9, 2961 CrossRef CAS PubMed.
- Y. Iizumi, T. Okazaki, Y. Ikehara, M. Ogura, S. Fukata and M. Yudasaka, ACS Appl. Mater. Interfaces, 2013, 5, 7665 CAS.
Footnote |
| † Electronic supplementary information (ESI) available. See DOI: 10.1039/c5tb01800e |
| This journal is © The Royal Society of Chemistry 2016 |

