Improving the luminescence performance of quantum dot-based photonic crystals for white-light emission†
Heng
Li
a,
Zhaohua
Xu
*a,
Bin
Bao
b,
Ning
Sun
a and
Yanlin
Song
*b
aDepartment of Material Technology, Jiangmen Polytechnic, Jiangmen, Guangdong 529090, China. E-mail: xuzhaohua@iccas.ac.cn
bBeijing National Laboratory for Molecular Sciences (BNLMS), Key Laboratory of Green Printing, Key Laboratory of Organic Solids, Institute of Chemistry, Chinese Academy of Sciences, Beijing 100190, China. E-mail: ylsong@iccas.ac.cn
First published on 19th November 2015
Abstract
A very bright white light is fabricated by combining the advantages of red, green and blue (RGB) QDs with photonic crystal (PC) structures. The results show that the intensity of RGB emission on the PCs can be up to about 8-fold enhanced in comparison to that of the control sample because of the high reflectivity in the UV region of the PC structures, which possess a stopband centered at 366 nm to match an excitation source. Furthermore, the chromaticity coordinates of the RGB film with the PC structure remain almost unchanged, close to pure white light. Introducing the PCs into the white light fabrication process has improved not only the dispersion of QDs due to large surface-to-volume ratios of the inverse opal structures, but also the luminous intensity of the white light resulting from effective light-extraction by the PCs. The approach provides a promising strategy for developing an optical device with high performance.
Introduction
Solid state lighting technology using light emitting diodes (LEDs) offers great promise in meeting the challenge of reducing energy consumption.1,2 Bright and efficient white LEDs account for a large proportion of the LED market and are rapidly evolving for use in general illumination applications, including automobile headlamps, display backlighting, lamps and fixtures. Apart from increasing the internal quantum efficiencies of LED chips for multiple quantum well sources, improving the performance of luminescent materials for brightness, efficiency, and stability, together with packaging into luminaries of high light-extraction efficiency are examples of contemporary challenges. Quantum dots (QDs) are rising as promising candidates due to their advantageous optical properties, such as good photo-stability, high luminescence efficiency, and facile color tenability by the quantum confinement effect.3,4 Combined with a blue or near-UV LED chip, highly efficient QDs have been used as downconverters, taking advantage of the high excitation efficiency of QDs by blue or near-UV photons.5–7 Up to now, great efforts have been made to enhance the overall performance of white LEDs satisfying the requirements for practical applications by utilizing QDs as photometric and electric down-conversion phosphors. On the one hand, an efficient surface modification strategy to circumvent the oxidation of the QD surface and to maintain the excellent light emitting capability of QDs has been achieved.8–11 For example, Jang's team reported that a highly luminescent and photostable quantum dot-silica monolith substance was prepared by preliminary surface exchange of the QDs and base-catalyzed sol–gel condensation of silica.12 On the other hand, optimizing device structure within the QD active layers also offers a suitable approach.13–17 Recently, Nurmikko et al. developed new nanocomposite luminescent materials by adding an extra process step in the white LED device fabrication, where a targeted GaN layer within an epitaxial thin film structure is made nanoporous (NP-GaN). The hybrid device was demonstrated to include the benefits of enhanced light extraction.14 Although efforts to fabricate white LEDs with high performances are made, designing a simple and low-cost alternative with better luminescence performance for the development of white lighting is still underway.Herein, a strategy of combining the red, green and blue (RGB) QDs–photonic crystals (PCs) composites and UV LED chips is developed for white LEDs. This approach by introducing the PCs to a white-light system is shown to accomplish two things: (a) the effective dispersion of QDs in the PC surfaces due to large surface-to-volume ratios, which is the critical factor determining their performance, and more importantly (b) enhanced light extraction efficiency by the PCs. As we know, PCs have aroused wide research interest recently in many optical devices due to their special light manipulation properties.18–21 Especially, optical gain in PC science is regarded as optical amplification mediated by stimulated emission of photons.22–25 For example, Klimov et al. reported amplified spontaneous emission of semiconductor nanocrystals uniformly coated on opal polystyrene surfaces, which is mainly attributed to the reducing group velocity at the edge of the photonic stopband.26 Cunningham et al. demonstrated a 108-fold enhancement of fluorescence from quantum dots on PCs.27 Significant progress has been reported about highly efficient optical storage, TNT detection and so on, making use of fluorescence-amplifying methods based on the PCs in our previous work.28–31 Therefore, the improvement of luminescence signals by PCs is a powerful tool to develop optical devices with high performance.
In this work, a simple and innovative approach based on PCs was used to prepare white light with a highly uniform illumination distribution. The white QD-LED, consisting of three types of blue, green, and red QD–PC composites on a UV LED chip, is fabricated for a general lighting application, showing a bright luminescence. Furthermore, a PC film with a stopband centered at 366 nm to match the UV excitation source is designed purposefully. Importantly, an 8-fold increase of RGB emission is achieved simultaneously by the structural engineering and also provides a rational understanding of the device operation for the design of high performance white light towards practical realization. Thus, amplification of the luminescence signal by introducing the PCs into white-light systems can have a significant impact on the development of new devices.
Experimental
Preparation of the silica sol
A silica sol was prepared through the hydrolysis of tetraethyl orthosilicate (TEOS, 28%) using HCl (37%) and ethanol as the catalyst and the mutual solvent, respectively. The solution was allowed to react for 4 h under stirring at room temperature. The prepared silica sol suspension was transparent.Fabrication of ordered inverse opals of silica
Monodisperse latex spheres of poly(St-MMA-AA) were synthesized via our previous method.32 The resulting latex spheres were used directly without purification. The polydispersity of the latex spheres was about 0.5%, which was detected using ZetaPALS BI-90plus (Brookhaven Instrument). The opal photonic crystal (PC) films were fabricated on glass substrates using a vertical deposition method at an invariant temperature (80 °C) and humidity (80%). After the samples were dry, they were sintered at 85 °C for 30 min to increase the stability of the samples.The silica inverse opals were fabricated by firstly infiltrating SiO2 sol into the interstice of the as-prepared opal PC template followed by subsequent calcination to remove the opal template. The main process is as follows: the PC templates were placed vertically and the SiO2 sol was dropped on the template and they were fully wetted. Subsequently, the wetted samples were allowed to dry at room temperature for 2 h. Finally, the samples were calcined at 500 °C for 6 h to remove the PC template.
Preparation of the QD-based PC film
Three kinds of QD solutions were purchased from Sigma-Aldrich and used without purification. The blue, green, and red QD solutions (10 mg mL−1 chloroform) (mass ratio of R![[thin space (1/6-em)]](https://www.rsc.org/images/entities/char_2009.gif) :
:![[thin space (1/6-em)]](https://www.rsc.org/images/entities/char_2009.gif) G
G![[thin space (1/6-em)]](https://www.rsc.org/images/entities/char_2009.gif) :
:![[thin space (1/6-em)]](https://www.rsc.org/images/entities/char_2009.gif) B is = 7
B is = 7![[thin space (1/6-em)]](https://www.rsc.org/images/entities/char_2009.gif) :
:![[thin space (1/6-em)]](https://www.rsc.org/images/entities/char_2009.gif) 6
6![[thin space (1/6-em)]](https://www.rsc.org/images/entities/char_2009.gif) :
:![[thin space (1/6-em)]](https://www.rsc.org/images/entities/char_2009.gif) 3) for CdS, ZnS and ZnSeS, respectively, were added into a 1 mL transparent PMMA/chloroform solution (1 g of PMMA mixed with 10 mL of chloroform solution). The QD-based PC films were prepared by spin-coating QDs–PMMA–chloroform solutions with different concentrations onto inverse opal PCs, glass (as the control sample with a planar structure) and porous nonperiodic SiO2 substrates at 1200 rpm for 20 s.
3) for CdS, ZnS and ZnSeS, respectively, were added into a 1 mL transparent PMMA/chloroform solution (1 g of PMMA mixed with 10 mL of chloroform solution). The QD-based PC films were prepared by spin-coating QDs–PMMA–chloroform solutions with different concentrations onto inverse opal PCs, glass (as the control sample with a planar structure) and porous nonperiodic SiO2 substrates at 1200 rpm for 20 s.
Fabrication of QD-based LED devices
In order to make practical devices, QD-doped PMMA-based inverse opal PCs were coated on InGaN-based UV LED chips (λpeak = 365 nm). The PMMA-coated QD–PC plates were diced to a size similar to the LED chip and placed on top of the chip. Here, the performance of the white LEDs is defined mainly by the luminous intensity and the International Commission on Illumination (CIE) coordination.Characterization
The SEM images were obtained with a field-emission SEM (JEOL JSM-4800, Japan), after sputtering the samples with a thin layer of gold. The UV-Vis absorbance spectrum was obtained using a UV-Visible spectrophotometer (UV-2600, Japan). The photoluminescence spectrum was measured using a Hitachi F-4500 fluorescence spectrophotometer. The overall quantum yields were evaluated with a calibrated integrating sphere coated with BaSO4.33,34 The micro-reflectance spectrum observation of the PCs was carried out by combining a reflected microscope (Olympus MX40, Japan) and a fiber optic UV-Vis spectrometer (Ocean Optic HR 4000, USA). The illuminating light was focused onto the PC through an objective lens and the reflected light was collected by the same lens and then transported to the spectrometer through the optical fiber. The large-scaled fluorescence images were taken using a fluorescence scanner (ChampChemi Professional+, China) with 365 nm UV light excitation.Results and discussion
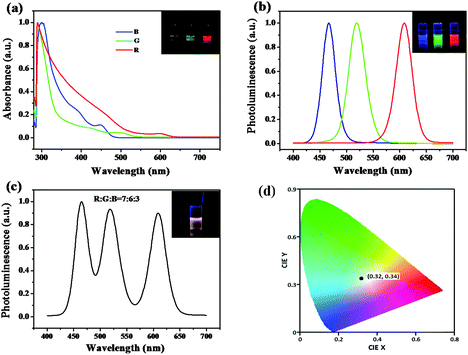
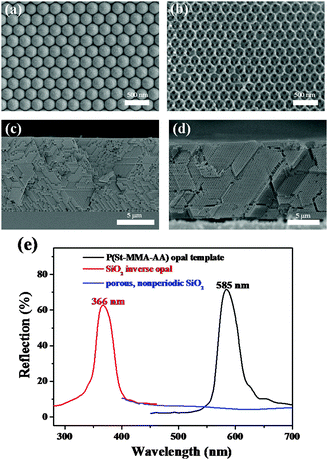
Three-component QD mixtures are employed in this work to yield efficient red, green and blue luminescence under a single UV light excitation. At first, UV-Visible absorption and photoluminescence (PL) spectroscopy of the trichromatic QDs in chloroform solution were used here and the results are presented in Fig. 1a and b. A trend of the absorption toward longer wavelengths is observed. The PL spectra of the three samples exhibited band-to-band emission centered at 467 nm, 520 nm and 610 nm, respectively. These PL spectra correlate well with the observed RGB emission as shown in the inset of Fig. 1b. Their respective PL spectra show large Stokes shifts, indicating that the emission can be dominated by defect-related mechanisms.35 It can be seen that their full width at half maximum values are about 30 nm, indicating their narrow size distribution. An example of a trichromatic QD mixture is shown in Fig. 1c. The amounts of each of the QD constituents are controlled to achieve equal RGB emission intensities, demonstrating a simple and effective method of fine color rendering capability for illumination devices. The intensities in each of the RGB spectrum regions were almost equal, producing the bright white color shown as a color photographic image in the inset of Fig. 1c. From analyzing the emission spectrum, the Commission Internationale de l'Eclairage (CIE) chromaticity coordinates for the white QD emission yield values of x = 0.32 and y = 0.34 lay in the white light region.Silica inverse opal PC was fabricated using a sacrificial polymer template method, which involves the self-assembly of polymer colloidal spheres, infiltration of silica sol and removal of polymer spheres.36 The topographical character of the P(St-MMA-AA) opal templates and the corresponding SiO2 inverse opals is investigated using scanning electron microscopy (SEM) in Fig. 2a and b. Fig. 2a shows images of P(St-MMA-AA) opal templates with diameters of 260 nm which illustrates that the colloid spheres are in a face-centered cubic arrangement with a close-packed (111)plane oriented parallel to the substrate. The close-packed arrangement can extend over a large area, which provides a simple and cheap method for the application of white LED devices. The corresponding SiO2 inverse opals with macropore diameters of 210 nm are shown in Fig. 2b, and are about 80% of the original colloidal sphere due to the shrinkage of the polymer spheres. Clearly, the latex spheres were arranged well in an orderly fashion in the as-prepared opal PC films, which contributed to the well-ordered periodicity of the inverse opal PCs. It also shows that the three dark regions inside each hollow region correspond to one air sphere of the underlying layer, indicating the formation of two layers of closely packed cavities. The large hole size of the air spheres is beneficial to the dispersion of the QDs. A cross-section SEM image of the inverse opals is shown in Fig. 1d. Each facet of the PC film shows a well-ordered structure over a large area, which ensures the excellent optical properties of the PCs, and will contribute to the amplitude of QD emission. Additionally, the porous nonperiodic SiO2 material is also obtained (Fig. S1 in ESI†) and the sample will serve as the reference sample to determine the enrichment effect from large surface areas. Fig. 2e exhibits the reflection spectra for the P(St-MMA-AA) opal templates and the corresponding SiO2 inverse opals, indicating the excellent stopband reflectance of the as-prepared PC films. Obviously, after removal of the polymer spheres by calcination, the stopband of the SiO2 inverse opals shifts to higher energies remarkably, compared with the stopbands of bare opals, which is due to a lower average refractive index caused by the air spheres instead of the polymer spheres and the shrinkage of the sphere diameter during calcination. The SiO2 inverse opal films with good optical properties are important for the modification of the light propagation and emission properties of QDs. It is noteworthy that microspheres with a suitable diameter should be selected to assemble into PCs with a given photonic bandgap for the aim of improving QD emission. Here, SiO2 inverse opals with macropore diameters of 210 nm were fabricated, where the photonic bandgap just overlapped the UV excitation light. It is also found that the porous nonperiodic SiO2 material as the reference sample has poor optical properties, which can determine the special light manipulation properties of the matched PCs.
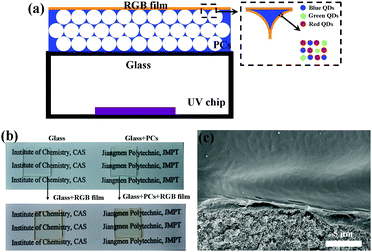
To combine the advantage of the QD and the PC structure, we tried to fabricate a white LED with a structure as shown in Fig. 3a. A homogeneous mixture of blue, green, and red emissive QDs was dispersed in a PMMA matrix, which was chosen as the matrix polymer because it is relatively transparent over the whole visible spectrum and has reasonable mechanical strength. There has even been a report that the luminescence properties of the QD layers are improved if the QDs are properly embedded in an optically transparent polymer matrix.37 The QDs–PMMA film is coated on the PCs with a UV-chip providing a 365 nm excitation light source to fabricate a white LED. The PC film is nearly transparent and becomes yellowish after spin-coating with RGB QDs–PMMA mixture solution, as shown in Fig. 3b, indicating that it has no interference with white light. Additionally, the thickness of the PMMA film loaded QDs can be readily controlled by varying the PMMA and QD concentration in the mixture solution. Fig. 3c presents a typical SEM image of the cross-section of SiO2 inverse opals coated with a RGB QD film with a uniform thickness of ∼1 μm.
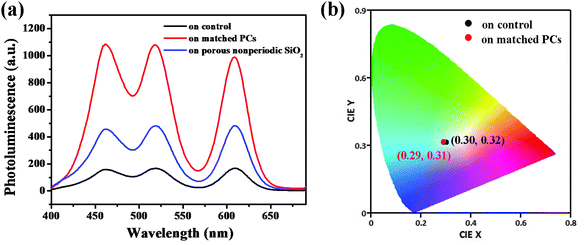
As shown in Fig. 4a, owing to the tricolor mixing with a suitable ratio, white light emission is satisfactorily achieved. Remarkably, a white-light emission film is obtained on the control sample with CIE coordinates of (0.30, 0.32) and is very close to the coordinates of pure white light (0.33, 0.33). The PL spectrum of this white-light emissive film shows three distinct emission bands, which correlate well with the emissions of pure films. This observation demonstrates that there is no significant interaction between the three QDs when they are doped in the matrix. However, the quantum efficiency of the control sample is only 14% due to most of the photon emission being restricted by the planar surface (Table 1). In contrast to the results from the QD emission under a single excitation source, the peak wavelength position remained almost unchanged, but the emission intensity from the matched PCs is significantly stronger than that from the control sample. In detail, about a 3-fold emission enhancement occurs for the porous nonperiodic SiO2 substrate, compared to that of the control sample. From the SEM (in ESI†), it can be clearly seen that the porous nonperiodic SiO2 material has a 3D channel structure with a large surface, while the control sample has a planar surface. Therefore, this enhancement mainly results from the enrichment effect from large surface areas.29 It is greatly exciting that an 8-fold enhancement is observed for the matched PC film compared to the control sample, confirming the light-extraction enhancement of PCs. The amplification of the emission can be attributed to the combined action of the macroporous structure and its periodic arrangement, especially as its periodically modulated structure interacts with excited light. The external excitation of the leaky modes leads to the formation of high-intensity near fields that serve to efficiently excite more red, green and blue QDs.38,39 More importantly, the quantum efficiency of the matched PC film can be up to about 60%. In addition, the color coordinates of white emission on the matched PCs shifted slightly from (0.30, 0.32) to (0.29, 0.31), which still lies in the white light region.
| Substrate | CIE (x, y) | Quantum efficiency (%) |
|---|---|---|
| Control (glass) | (0.30, 0.32) | 14 |
| Porous nonperiodic SiO2 | (0.31, 0.32) | 38 |
| Matched PCs | (0.29, 0.31) | 60 |
In order to further evaluate the spectral distribution of ternary QDs, luminescence intensities of a single color are measured. The red, green and blue spectral components are collected by the filter installed in the fluorescence scanner. The enhancements of each spectral component from the PCs over the control sample are shown in Fig. 5a. The enhancement ratio is observed among the red, green and blue QD emissions, which is in good accordance with the PL emission spectra (Fig. 4a). Moreover, photographic images of the RGB spectral component (with a pixel size of 1.0 × 1.0 cm2) in Fig. 5b show that the device structure can be applicable to large-sized applications. The films show a homogeneous RGB color with a strong brightness. It is clearly seen that the images on the matched PCs exhibit a higher brightness compared with that on the control, indicating that the PCs do amplify the luminescence intensity effectively to attain high brightness. By evaluating the relative intensity, the intensity on the PCs is evidently enhanced, which corresponds to high brightness of the PC surface. Therefore, amplification of the luminescence intensity on the PCs presents a feasible strategy for improving the brightness of white light.
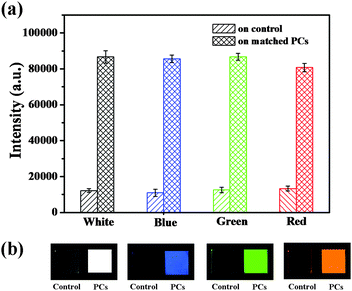 | ||
| Fig. 5 (a) PL intensity and (b) photographic images from left to right show white, blue, green and red colors under UV irradiation. | ||
Conclusions
In summary, we have presented very bright white light enabled by the combination of RGB QDs and PC structures. The experimental results show that the intensity of RGB emission exhibited a considerable enhancement because of the high reflectivity in the UV region by the PC structure, which possesses a stopband centered at 366 nm to match the excitation source. Introducing PCs into the white light fabrication process has improved not only the dispersion of QDs but also the luminous intensity of white light. The approaches and results in the present study represent remarkable progress in the device performances of white LEDs and also provide reasonable guidelines for the practicable realization of high performance white LEDs.Acknowledgements
This work is supported by the National Natural Science Foundation of China (Grant No. 51302107), the Natural Science Foundation of Guangdong Province, China (Grant No. 2015A030313804) and Training Special Funds of College Students' Innovation of Science and Technology of Guangdong Province, China (Grant No. pdjh2015a0812).Notes and references
- C. J. Humphreys, MRS Bull., 2008, 33, 459 CrossRef.
- E. F. Schubert and J. K. Kim, Science, 2005, 308, 1274 CrossRef CAS PubMed.
- X. Q. Li, Y. W. Wu, D. Steel, D. Gammon, T. H. Stievater, D. S. Katzer, D. Park, C. Piermarocchi and L. J. Sham, Science, 2003, 301, 809 CrossRef CAS PubMed.
- J. Y. Kim, O. Voznyy, D. Zhitomirsky and E. H. Sargent, Adv. Mater., 2013, 25, 4986 CrossRef CAS PubMed.
- Y. Shirasaki, G. J. Supran, M. G. Bawendi and V. Bulović, Nat. Photonics, 2013, 7, 13 CrossRef CAS.
- S. Kim, S. HyukIm and S.-W. Kim, Nanoscale, 2013, 5, 5205 RSC.
- K.-S. Cho, E. K. Lee, W.-J. Joo, E. Jan, T.-H. Kim, S. J. Lee, S.-J. Kwon, J. Y. Han, B.-K. Kim, B. L. Choi and J. M. Kim, Nat. Photonics, 2009, 3, 341 CrossRef CAS.
- C. Yoon, H.-G. Hong, H. C. Kim, D. Hwang, D. C. Lee, C.-K. Kim, Y.-J. Kim and K. Lee, Colloids Surf., A, 2013, 428, 86 CrossRef CAS.
- P. Tao, Y. Li, R. W. Siegel and L. S. Schadler, J. Mater. Chem. C, 2013, 1, 86 RSC.
- J. Ziegler, S. Xu, E. Kucur, F. Meister, M. Batentschuk, F. Gindele and T. Nann, Adv. Mater., 2008, 20, 4068 CrossRef CAS.
- P. Yang, H.-S. Chen, J. P. Wang, Q. Che, Q. Ma, Y. Q. Cao and Y. N. Zhu, RSC Adv., 2014, 4, 20358 RSC.
- S. Jun, J. Lee and E. Jang, ACS Nano, 2013, 7, 1472 CrossRef CAS PubMed.
- C. Sun, Y. Zhang, Y. Wang, W. Y. Liu, S. Kalytchuk, S. V. Kershaw, T. Q. Zhang, X. Y. Zhang, J. Zhao, W. W. Yu and A. L. Rogach, Appl. Phys. Lett., 2014, 104, 261106 CrossRef.
- C. Dang, J. Lee, Y. Zhang, J. Han, C. Breen, J. S. Steckel, S. Coe-Sullivan and A. Nurmikko, Adv. Mater., 2012, 24, 5915 CrossRef CAS PubMed.
- X. X. Fu, X. N. Kang, B. Zhang, C. Xiong, X. Z. Jiang, D. S. Xu, W. M. Du and G. Y. Zhang, J. Mater. Chem., 2011, 21, 9576 RSC.
- B. X. Zhao, D. L. Zhang, K. Sun, X. B. Wang, R. H. Mao and W. W. Li, RSC Adv., 2014, 4, 45155 RSC.
- K.-J. Chen, H.-C. Chen, K.-A. Tsai, C.-C. Lin, H.-H. Tsai, S.-H. Chien, B.-S. Cheng, Y.-J. Hsu, M.-H. Shih, C.-H. Tsai, H.-H. Shih and H.-C. Kuo, Adv. Funct. Mater., 2012, 22, 5138 CrossRef CAS.
- P. Lodahl, A. F. van Driel, I. S. Nikolaev, A. Irman, K. Overgaag, D. L. Vanmaekelbergh and W. L. Vos, Nature, 2004, 430, 654 CrossRef CAS PubMed.
- J. P. Ge, Y. X. Hu and Y. D. Yin, Angew. Chem., Int. Ed., 2007, 46, 7428 CrossRef CAS PubMed.
- A. C. Arsenault, D. P. Puzzo, I. Manners and G. A. Ozin, Nat. Photonics, 2007, 1, 468 CrossRef CAS.
- F. Jin, Y. Song, X. Z. Dong, W. Q. Chen and X. M. Duan, Appl. Phys. Lett., 2007, 91, 031109 CrossRef.
- J. Han, H. L. Su, D. Zhang, J. J. Chen and Z. X. Chen, J. Mater. Chem., 2009, 19, 8741 RSC.
- M. N. Shkunov, Z. V. Vardeny, M. C. DeLong, R. C. Polson, A. A. Zakhidov and R. H. Baughman, Adv. Funct. Mater., 2002, 12, 21 CrossRef CAS.
- H. J. Kim, S. Kim, H. Jeon, J. Ma, S. H. Choi, S. Lee, C. Ko and W. Park, Sens. Actuators, B, 2007, 124, 147 CrossRef CAS.
- F. Jin, L. T. Shi, M. L. Zheng, X. Z. Dong, S. Chen, Z. S. Zhao and X. M. Duan, J. Phys. Chem. C, 2013, 117, 9463 CAS.
- G. R. Maskaly, M. A. Petruska, J. Nanda, I. V. Bezel, R. D. Schaller, H. Htoon, J. M. Pietryga and V. I. Klimov, Adv. Mater., 2006, 18, 343 CrossRef CAS.
- N. Ganesh, W. Zhang, P. C. Mathias, E. Chow, J. Soares, V. Malyarchuk, A. D. Smith and B. T. Cunningham, Nat. Nanotechnol., 2007, 2, 515 CrossRef PubMed.
- Y. Q. Zhang, J. X. Wang, Z. Y. Ji, W. P. Hu, L. Jiang, Y. L. Song and D. B. Zhu, J. Mater. Chem., 2007, 17, 90 RSC.
- H. Li, J. X. Wang, Z. L. Pan, L. Y. Cui, L. Xu, R. M. Wang, Y. L. Song and L. Jiang, J. Mater. Chem., 2011, 21, 1730 RSC.
- H. Li, J. X. Wang, H. Lin, L. Xu, W. Xu, R. M. Wang, Y. L. Song and D. B. Zhu, Adv. Mater., 2010, 22, 1237 CrossRef CAS PubMed.
- B. Bao, M. Z. Li, Y. Li, J. K. Jiang, Z. K. Gu, X. Y. Zhang, L. Jiang and Y. L. Song, Small, 2015, 11, 1649 CrossRef CAS PubMed.
- J. X. Wang, Y. Q. Wen, H. L. Ge, Z. W. Sun, Y. M. Zheng, Y. L. Song and L. Jiang, Macromol. Chem. Phys., 2006, 207, 596 CrossRef CAS.
- J. C. de Mello, H. F. Wittmann and R. H. Friend, Adv. Mater., 1997, 9, 230 CrossRef CAS.
- Y. S. Zhu, W. Xu, H. Z. Zhang, W. Wang, S. Xu and H. W. Song, J. Phys. Chem. C, 2012, 116, 2297 CAS.
- W. Liu, Y. Zhang, W. Zhai, Y. Wang, T. Zhang, P. Gu, H. Chu, H. Zhang, T. Cui, Y. Wang, J. Zhao and W. W. Yu, J. Phys. Chem. C, 2013, 117, 19288 CAS.
- Y. Q. Zhang, J. X. Wang, X. Chen, L. Jiang, Y. L. Song and D. B. Zhu, Appl. Phys. A: Mater. Sci. Process., 2007, 87, 271 CrossRef CAS.
- M. Böberl, M. V. Kovalenko, S. Gamerith, J. W. List and W. Heiss, Adv. Mater., 2007, 19, 3574 CrossRef.
- J. I. L. Chen, E. Loso, N. Ebrahim and G. A. Ozin, J. Am. Chem. Soc., 2008, 130, 5420 CrossRef CAS PubMed.
- A. Mihi, F. J. Lopez-Alcaraz and H. Miguez, Appl. Phys. Lett., 2006, 88, 193110 CrossRef.
Footnote |
| † Electronic supplementary information (ESI) available. See DOI: 10.1039/c5tc02428e |
| This journal is © The Royal Society of Chemistry 2016 |

