The use of a quartz crystal microbalance as an analytical tool to monitor particle/surface and particle/particle interactions under dry ambient and pressurized conditions: a study using common inhaler components†
N. W.
Turner
ab,
M.
Bloxham
c,
S. A.
Piletsky
*bd,
M. J.
Whitcombe
bd and
I.
Chianella
b
aDepartment of Life, Health and Chemical Sciences, The Open University, Milton Keynes, MK7 6AA, UK
bCentre for Biomedical Engineering, School of Engineering, Cranfield University, Cranfield, Bedfordshire MK43 0AL, UK
cGSK Medicines Research Centre, Gunnels Wood Road, Stevenage, Hertfordshire SG1 2NY, UK
dDepartment of Chemistry, University of Leicester, Leicester, LE1 7RH, UK. E-mail: sp523@le.ac.uk
First published on 24th November 2016
Abstract
Metered dose inhalers (MDI) and multidose powder inhalers (MPDI) are commonly used for the treatment of chronic obstructive pulmonary diseases and asthma. Currently, analytical tools to monitor particle/particle and particle/surface interaction within MDI and MPDI at the macro-scale do not exist. A simple tool capable of measuring such interactions would ultimately enable quality control of MDI and MDPI, producing remarkable benefits for the pharmaceutical industry and the users of inhalers. In this paper, we have investigated whether a quartz crystal microbalance (QCM) could become such a tool. A QCM was used to measure particle/particle and particle/surface interactions on the macroscale, by additions of small amounts of MDPI components, in the powder form into a gas stream. The subsequent interactions with materials on the surface of the QCM sensor were analyzed. Following this, the sensor was used to measure fluticasone propionate, a typical MDI active ingredient, in a pressurized gas system to assess its interactions with different surfaces under conditions mimicking the manufacturing process. In both types of experiments the QCM was capable of discriminating interactions of different components and surfaces. The results have demonstrated that the QCM is a suitable platform for monitoring macro-scale interactions and could possibly become a tool for quality control of inhalers.
Introduction
Currently metered dose inhalers (MDI) and multidose powder inhalers (MDPI) are the most common therapies to treat chronic obstructive pulmonary diseases (OPD) and asthma.1–4 MDIs were introduced in the market in the 1950s and since then they have been growing in popularity. MDIs contain a therapeutically active ingredient together with excipients (e.g. lactose), dissolved or suspended in a propellant in a compact pressurized aerosol dispenser. An MDI dispenser may discharge up to several hundred metered doses. Although MDI is the most frequently utilized drug delivery system for OPD, MDPIs have being gaining importance as a replacement for or alternative to MDI.1–5 Dry powder inhalers were first introduced in the 1970s, but their uptake was initially slow as the devices available were only single-dose units with the drug contained in gelatin capsules.3 Today several types of MDPIs are available with the drugs either metered from a reservoir of free flowing powder6 or contained in individually filled blisters.7 Atmospheric factors such as humidity, electrostatic charges and oxidation affect the micronized powders, with an effect on the particles (e.g. aggregation), which diminishes the accuracy of the MPDI dosage.8 The charge on the materials is known to vary due to the conditions in which these samples are stored, and used, and the exact formulation.9,10 Currently, there are analytical techniques to determine the particle size of MDI such as inertial separation methods11 and laser diffraction analysis.12 There are also techniques to determine powder morphology and electrostatic charges in MDPI such as isothermal microcalorimetry, X-ray diffraction and scanning electron microscopy.13 Nevertheless, analytical tools to monitor the quality of materials in both MDI and MDPI during and after inhaler manufacturing do not exist. The existence of simple devices, which would ultimately enable the quality of MDI and MDPI to be monitored, would produce remarkable benefits for both the pharmaceutical industry and the users of inhalers. Therefore in this work we aimed to investigate whether a commercial quartz crystal microbalance (QCM) sensor could form the basis of such a tool.Briefly QCM sensors, which are the most common piezoelectric sensors, measure mass by monitoring the change in the frequency of a resonating piezoelectric quartz crystal, which is disturbed by the addition of materials to its working face.14 The QCM can operate both at the gas phase and liquid interfaces, thus making it useful to determine the properties of materials or the nature of physico-chemical interactions. A typical QCM sensor would be constructed by immobilizing an antibody or an antigen to the sensor working surface. The interactions with the corresponding antigen or antibody are detected through changes in the frequency of oscillation of the quartz crystal.15 When operating in the gas phase, changes in the oscillation frequency may be mathematically correlated to the mass changes on the QCM surface using the Sauerbrey equation.16 When measurements are performed in liquids the frequency change is correlated with the mass using more complex equations, which take into account several additional parameters including density and viscosity of the liquid.17,18 So far, QCM sensors have been applied in a variety of fields, such as medical diagnostics, environmental analysis, security monitoring and food safety.15,19
In this work the QCM was used in two ways. Firstly, to measure the addition of small amounts of powder compounds in a gas stream in the first example of its kind. This was done to measure particle/surface and particle/particle interactions on the macroscale amongst the components within a typical MDPI. Information on such interactions could prove invaluable for the understanding of existing and proposed new products. Current analytical platforms are unable to measure such small scale interactions within inhalers over relatively large sample sizes. Some techniques (e.g. atomic force microscopy) can give single particle information, but extending this to full powder systems is not always possible.
Secondly, the sensor was also used to measure different fluticasone propionate pedigrees in a pressurized system to assess the interactions of a typical MDI with different surfaces such as gold (standard QCM surface) and steel (equivalent to the materials used for construction of the manufacturing equipment) under conditions mimicking the manufacturing process utilized to produce the inhaler. This was done to investigate whether a QCM is suitable to discriminate between different MDI formulations at the manufacturing stage, in an attempt to identify a sensor technology for on-line quality control and to predict the loss of materials by its adhesion to the surfaces of the manufacturing equipment. QCM systems are used as pressure sensors,20 and to study absorption/desorption of materials to surfaces at high pressures,21 but the use of one in a pressurized environment to measure physicochemical interactions of this nature, to our knowledge has not been demonstrated.
Experimental
Materials and methods
Salmeterol (SX), fluticasone propionate standard (FPS) and lactose α monohydrate (Lac) were provided by GlaxoSmithKline (GSK). Different fluticasone pedigrees were donated by GSK and were given standard codes, replicated here as FPA, FPB, FPC, and FPD. These were received blind and the authors are not aware of the exact differences in the materials for commercial reasons, although these are known to have the same average particle size range (1.5–3.0 μm), but differing charge properties. The charge properties were not measured by the authors. This was partially due to the fact that the results obtained in a static analysis under ambient conditions would not be comparable to the conditions within the flow and pressure of the experimental conditions; and also due to the fact that the experimental sampling was performed blind. All samples were stored and used in the exact same manner to limit any environmental effect on the materials. FP is known to hold its charge for a reasonable period.8 Lac and SX particles provided were of the same average size as FP.The hydrofluoroalkane (HFA) propellant was kindly provided by GSK in cans of 8 mL capacity. Alongside this, FP samples, suspended in HFA were provided in cans of 4 mL. No excipient or other compound was present in the FP samples.
Tetrahydrofuran and 1,1,1,3,3,3,-hexafluoroisopropanol were obtained from Fisher Scientific, UK. Polyvinylchloride (∼62![[thin space (1/6-em)]](https://www.rsc.org/images/entities/char_2009.gif) 000 Mw) and polyacetal (∼100
000 Mw) and polyacetal (∼100![[thin space (1/6-em)]](https://www.rsc.org/images/entities/char_2009.gif) 000 Mw) were purchased from Sigma-Aldrich, UK.
000 Mw) were purchased from Sigma-Aldrich, UK.
AT-cut piezoelectric quartz crystals (10 MHz) were purchased from Gambetti Kenologia Srl, Italy. These were coated in gold, or in 312-steel. The steel crystal had a larger working face (3.142 cm2), than the gold (0.786 cm2), with it completely covering the surface of the crystal.
A Libra 3.1 quartz crystal microbalance (QCM) including accessories (batch-cells and Libra 3.1 software) was obtained from Technobiochip™, Italy. Tubing was made from PTFE and had an internal diameter of 2 mm. PEEK fittings, similar to those used in HPLC were used to connect the experimental setup.
Preparation of PVC and PA films on crystal surface
Solutions of polyvinylchloride (PVC) in tetrahydrofuran (2 mg mL−1) and of polyacetal (PA) in 1,1,1,3,3,3-hexafluoroisopropanol (2 mg mL−1, dissolved by stirring overnight) were prepared. A small aliquot (15 μL) of such solution was then deposited on the QCM crystals and the solution was spin-coated for 2 min at 600 rpm to evaporate the solvent. These were further dried under slight vacuum in a desiccator.Testing particle/surface interactions in a gas stream
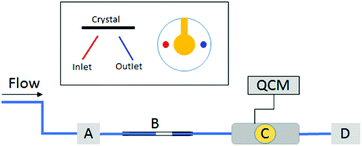
For testing in a gas stream, the QCM device was setup as illustrated in Fig. 1.A cell suitable for analysis in gas flow was attached to a dry nitrogen source. The tubes carrying the gas stream were attached to a three-way valve (A) which allowed switching of the nitrogen stream between the flow cell (flow on condition) and waste (flow off condition). A flow-meter was also used to monitor and maintain a constant flow rate of nitrogen. Two plastic pipette tips, one with the tip cut off and wedged inside the other, were used as a basic injection chamber for the drug powders (B), and were attached inline with the tubing just after the valve.
Bare gold crystals or crystals modified with PVC or PA were mounted in the flow cell (C) attached to the QCM (Libra 3.1). The Libra system, while not the highest sensitivity system available offered the highest level of flexibility in design towards the construction of suitable flow cells. Note that the crystal was positioned face down to ensure that any interactions were not due to gravity deposition. Initially the frequency was stabilized in the absence of any gas stream (200 seconds). Then a nitrogen stream with a flow rate of 1200 mL min−1 was applied and the frequency was allowed to stabilize again (200 seconds). When the signal stabilized, measurement of the frequency on the QCM was stopped, and the gas flow was interrupted inside the cell by opening valve A. Then set amounts of FP, SX and Lac (0.5–0.8 mg) were loaded into the pipette tips. The tips were reconnected inline with the gas inlet and the measurement of the frequency was started again. At the same time the nitrogen flow (1200 mL min−1) was re-established by switching the three-way valve (A). Changes in frequency due to particles interacting with the crystal surface were recorded for 200 seconds per “dry injection”. Several injections were performed in series. The whole process was repeated in triplicate. Waste was collected in a powder trap (D)
Testing particle/particle interactions in gas stream
To test particle/particle interactions Lac, FP and SX were individually immobilized on QCM crystals and the interactions with the other inhaler components were investigated following their injection into the gas stream. Lac was immobilized on the QCM crystal by entrapment in a PVC layer. For the immobilization, PVC (2 mg) was dissolved in tetrahydrofuran (THF, 2 mL). QCM crystals were cleaned with methanol and placed upon the spin coater. This was set to 500 rpm and aliquots (2 × 5 μL) of the PVC solution were added, leaving 1 minute between additions. A third aliquot (5 μl) was added at this time and allowed to spin for 20 seconds. After this period, the spinning was stopped and the chip was transferred face down into a bed of powdered lactose. A 10 g weight was added to the back of the crystal and this was left for 1 h. After this time the crystal was removed from the powder and the surface was blown with a nitrogen stream. The unbound lactose was removed by washing with methanol to leave a layer of lactose particles entrapped in PVC.In order to immobilize FP and SX a slightly modified procedure was adopted. After the deposition of the PVC layer as described above, the QCM crystal was placed face down in contact with a bed of the sample powder, with slight pressure applied to the back of the crystal. This was sealed in a vial, which was then placed in an oil bath for 2 hours at 95 °C. At this temperature the PVC softened. Removal from the oil bath followed by rapid cooling (cold water) allowed the PVC to solidify, entrapping particles of drug at the surface. Excess powder was removed by a high pressure nitrogen stream.
After immobilization of particles, the crystals were placed into the cell and particle–particle interactions were monitored, in the same manner as described in the previous section for bare and polymer-coated crystals.
Testing of fluticasone propionate in a pressurized liquid gas system mimicking the manufacturing process
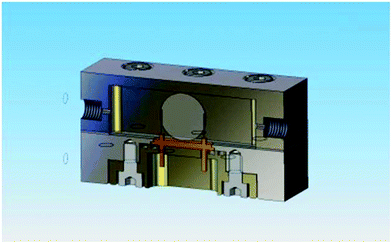
A custom designed high pressure flow cell (Fig. 2) was designed in order to perform the experiments. The cell was made in two parts, with the top, bottom and the crystal holder all insulated from each other. This was constructed from 316 steel and rated to 6000 psi.Two different types of QCM crystals were used in the experiment. These comprised ‘standard’ crystals with gold electrodes (as used in the experiments described above) and crystals with a coating of steel over the working face of the crystal. The active surface area of the steel-coated crystals is greater than that of standard gold crystals. This allowed greater sensitivity.
The grade of steel (312 steel) was the same as that in the manufacturing equipment. For the measurements, both hydrofluoroalkane (HFA), the volatile propellant and four different pedigrees coded here as FPA, FPB, FPC, and FPD were received blind and the authors were not aware of the exact differences in the materials, although these are known to have differing charge properties.
HFA was kindly provided by GSK in cans of 8 mL capacity and FP samples, suspended in HFA were provided in cans of 4 mL. No excipient or other compound was present in the FP samples. These were stored at room temperature.
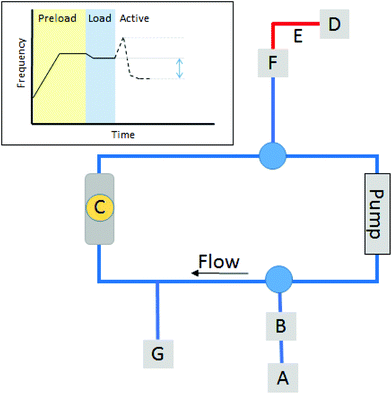
The experimental set-up was designed in order to minimize the effects of flow, gravity and pressure changes on the QCM crystal. A schematic of the equipment used for the experiments is shown in Fig. 3.
Before conducting the experiments the system was dismantled and washed with acetone and methanol three times and then dried in a stream of nitrogen for 15 minutes, ensuring that the tubing and cell were free from particulates. The equipment was reassembled and allowed to return to room temperature when all valves were closed. The crystals were suspended vertically from above, and placed laterally with respect to the flow direction (Fig. 2).
To prepare the system HFA (from 8 mL canister) was loaded through injector A with valve B opened until the system was filled and the pressure measured on gauge G was at 6.5 bar. Valve F was used to bleed any bubbles out of the system. Once filled, the pressure in the system was allowed to equilibrate to allow for the gas (under pressure) and the equipment (the crystal, flow cell and pump) to reach the same ambient temperature. During this period the QCM was active and measured, allowing for stabilization to be reached. This is marked as PRELOAD (see Fig. 3 inset). The temperature of the surrounding room (and hence ambient) was held at 21 °C, via an air conditioning system. Although a minor fluctuation was observed this was not within the same time scale as the experimental. Samples were stabilized at the same temperature. Once equilibrated a second load was made. This was known as LOAD (Fig. 3 inset). During this LOAD, valve F was opened, the sample was injected from the 4 mL can, via the injection port A until the red zone E was completely filled with liquid. This acted as a buffer zone allowing the sample to enter the main loop. The powder was visible in the tubing. This allowed the apparatus to be filled with the same amount of material at each measurement. Once the LOAD had been made, the system was allowed to equilibrate again. Once equilibrium was reached, which was observed by a stable QCM signal, the pump was switched on and valves and B and F opened, allowing the sample to enter the system. A visual inspection of the tubing allowed the particles to be seen flowing into the cell and to check for the absence of bubbles. Once loaded both valves were closed, and the system was left to equilibrate for 3 minutes before the pump was activated at a rate of 0.1 mL min−1. This was called the ACTIVE phase. Measurements were taken once the system reached an equilibrium, and taken against the reference point at the beginning of the ACTIVE phase.
Results and discussion
Testing particle/surface interactions in a gas stream
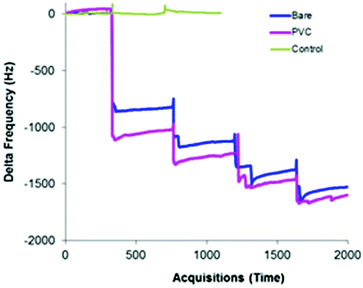
Microgravimetric systems such as a QCM are often used as sensor platforms, due to the high sensitivity generated by using a high frequency oscillator (in the MHz range) and the link generated by the Sauerbrey equation which mathematically links changes in frequency to mass bound. It should be noted here that a decrease in frequency indicates an addition of mass (binding) to the sensor surface, whereas an increase in frequency can be attributed to a loss of material or changes in viscosity.QCM gold crystals were modified with PVC or PVA as described above and the interactions of such surfaces with particles of FP, SX and lactose were tested on a gas stream as explained above. Fig. 4 shows a typical QCM response to injections of FP on a bare gold crystal and on a crystal modified with PVC. The figure also shows a control measurement performed by the same procedure without injecting any powder, in order to confirm that the decrease in frequency is really due to accumulation of particles and not due to a disturbance of the system. Similar graphs but with different responses were obtained on PA and with SX and Lac. The stepwise signal is due to the accumulation of materials.
All the sensor responses reported as delta frequency are summarized in Fig. 5. All the graphs are reported using the same scale of the Y axis for easy comparison, with the data points taken from the zero point to the equilibrium reached after injection.
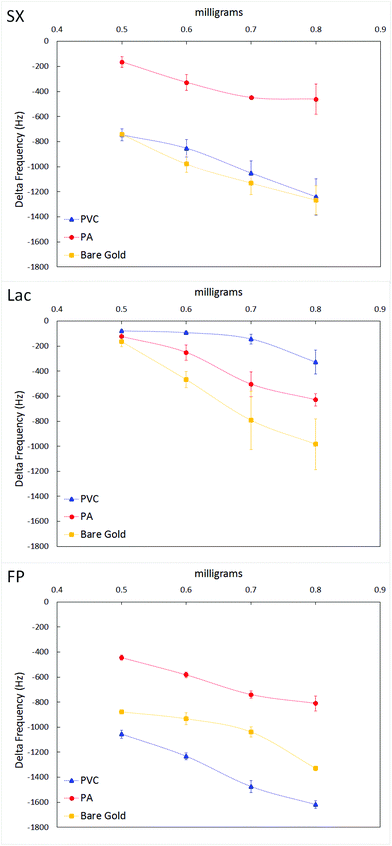 | ||
| Fig. 5 QCM response in gas phase to dry injection of SX (top), lactose (centre) and FP (bottom) onto bare gold (gold), PA (red) and PVC (blue) modified crystal surfaces. | ||
If we compare the three surfaces: PA binds FP > Lac > SX; PVC binds FP > SX > Lac; bare gold binds FP > SX ≥ Lac. This suggests that binding could be based on electrostatic interactions between the polymers and compounds. It also demonstrates that the QCM is able to identify between different compounds in their particulate format.
On the basis of the results obtained for the two active compounds FP and SX, PVC was selected as a standard surface material instead of PA as it appeared to perform in a similar manner to bare gold. Therefore in subsequent experiments, PVC was selected as a holding agent, in which the particles were immobilized to study particle/particle interactions.
Testing particle/particle interactions in a gas stream
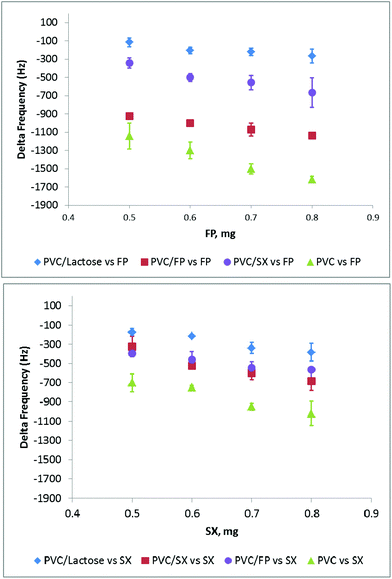
Particles of Lac, FP and SX were immobilized on the crystal surface by entrapment within a PVC layer as explained in the materials and methods section. In order to obtain more information about the entrapment of the compound in the PVC layer, the modified crystals were observed under an optical microscope with a 10× magnification objective. The homogeneous particles embedded relatively well and gave a fairly even coating. The immobilized particles were then challenged with the powder of the active compounds (FP and SX) in a gas stream, as done for the surface/particle interaction study. This was done to evaluate particle/particle interactions. The results of the study are reported in Fig. 6.Both graphs show that embedding particles on PVC significantly changes the accumulation of the active components on the sensor surface. In fact, generally, when particles were immobilized in PVC, a reduction in powder accumulation of the challenging compound was seen, with Lac producing the highest reduction. This suggests that by using a QCM it is possible to distinguish between the influence of embedded particles over the material used for embedding them (PVC). In addition the results might suggest that particle/particle interactions among the several inhaler components tested here are minimal, as their presence on the sensor surface disrupts the powder accumulation on the PVC layer.
The particle/particle interactions seen in the gas phase could be modulated by electrostatic charges.11 In surfaces such as PVC the charges cannot dissipate so the particles maintain their charges and binding abilities. FP also holds its charge relatively longer than the other compounds, which could be the reason for the more pronounced frequency changes observed for FP as compared with the other compounds.
Testing of fluticasone propionate in a system mimicking the manufacturing process
The encouraging results obtained above indicated that the interactions between the selected drugs and a range of materials could be accurately monitored and measured by using a QCM. Defined differences in the behavior of the drugs were observed when a range of surfaces, including materials matching those used in the construction of MDPIs, were challenged in the gas phase (particles in a constant gas stream). These results strongly suggested that particle aggregation, either with other particles or with a surface, can be measured using a QCM.Based on these findings we attempted to use a QCM to study the physical properties of fluticasone propionate (FP), one of the most commonly used active ingredients in MDPIs, under conditions mimicking the manufacturing process used to produce inhalers. Inhalers usually utilize HFA (hydrofluoroalkane) as the volatile propellant system in the formulation and therefore this was included in our investigation. It is important for the pharmaceutical industry producing the inhaler to understand the dynamics of the drug/HFA suspension system in order that drug particle/particle and particle/surface interactions can be ascertained. This would ultimately allow the development of a simple device for online quality control monitoring during production.
To do this, we aimed at measuring quantitatively, and with high sensitivity, the attractive or repulsive interactions of FP derived from different sources or process variations (FP pedigrees), with two different surfaces: gold and 312 stainless steel. This latter was selected as it is the equivalent of the materials used for construction of the manufacturing equipment, and would give us information about how the particles behave during production. Measurements were taken using a QCM set-up and a special pressurized flow cell (Fig. 2), which was designed in order to perform the experiments. The main feature of the measurement cell was that it allowed the crystal to sit in-line with a liquid flow, whilst mimicking the conditions found in the manufacturing system.
A schematic of each measurement run, consisting of a pre-loading (PRELOAD), a LOAD of the sample and an ACTIVE phase, is shown in Fig. 3 inset. During PRELOAD, it was possible to fill the cell and the system with HFA. The system was filled from bottom to top and tapping was used to ensure that bubbles in the system were removed. The top valve was used to bleed the system. During the LOAD phase the particles were observed filling the loop. It was noted that the samples would take the shorter route upwards, Fig. 3, therefore the tubing between the injection port and pump was deliberately shorter than that between the injection port and the cell to promote this route for the sample loading so it did not engage with the sensor at first pass. The system was allowed to stabilize at both the PRELOAD stage and LOAD stage.
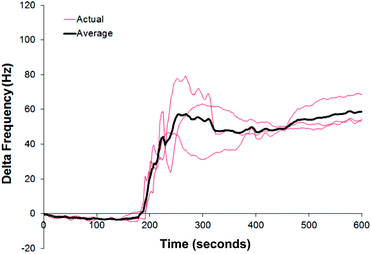
In order to obtain a baseline, HFA was firstly injected into the system at the loading stage. An acquisition of the frequency was taken every second. This allowed a reference signal to be obtained in the absence of the drug. Fig. 7 shows the QCM signal under flow circulation when just HFA was injected on a gold sensor, from the injection port. At three minutes (180 seconds) the pump was activated. This is an exciting step as to our knowledge QCM sensors have not been used in high pressure liquid gas systems, though they have been used at matching pressures before for gas phase analysis.22 To obtain a stable system the whole equipment needs to be kept at a constant temperature as changes under external conditions were picked up by the sensor, observed as fluctuations in frequency with temperature change. Besides, this was sensitive enough, over a longer period to observe air conditioning flow patterns within the laboratory (data not shown).
An increase in the signal was observed when the flow was started. As no solid material was present, this change was probably due to the effect of flow, changes in pressure and potentially slight temperature differences of the load sample. This therefore can be considered as the ‘standard’ response of the system (blank). Anything beyond this can be attributed to the interactions of the particles with the QCM surface.
It can be seen by observing the red traces that each experiment shows fluctuations from the average signal. This also demonstrates the sensitivity of the QCM to external factors. The fluctuations are probably due to turbulence caused by the flow through the cell and around the crystal. This fluctuation was observed in all signals.
The interactions between the fluticasone pedigrees (FP A–D) were studied using this technique. Each sample was run in at least triplicate and an average was taken of these. Data points were measured for the entirety on the run, allowing for the real time interactions to be studied.
Fig. 8 shows these data for the four pedigrees and controls against the gold surface. The inset table gives comparative data using the 480 second point (5 minutes after pump activation) as a reference point.
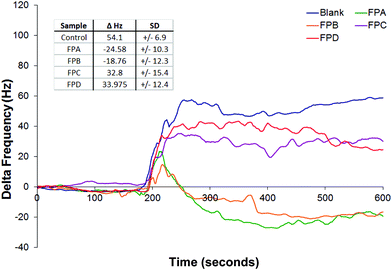 | ||
| Fig. 8 Average response of QCM versus unknown FP pedigrees in HFA, and the corresponding control (Fig. 7). Flow rate at 0.1 mL min−1. Pump activated at 180 seconds. Inset: Comparative data at 480 s, with standard deviations. Samples in at least triplicate. | ||
It also shows that all the FP pedigrees bound to the gold crystal to some level as shown by a decrease in frequency from the blank. We can see that it takes a short while for the particles to interact with the surface, as shown by the initial rise in all samples. FPC and FPD reach a point and stabilize below that blank suggesting some interaction. The other two start to rise and then a characteristic drop in frequency linked with binding is observed.
The samples provided were known to differ in their charge and properties. It is known that a slight change in the charge state will lead to different binding characteristics23 to uncoated gold. While we are unable to state exactly what these are we can clearly differentiate between the pedigrees. We can also suggest that the pedigrees labelled FPA and FPB are broadly similar to each other, and likewise FPC and FPD.
To study the effects on the steel surfaces two pedigrees with different properties (FPA and FPD) were selected from the gold study, those that showed different properties and were tested on the steel surface (Fig. 9). These were compared against the gold surface.
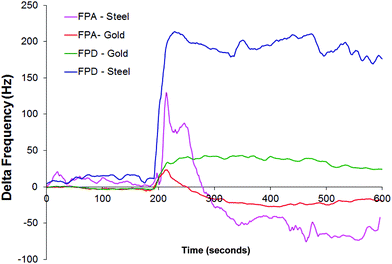 | ||
| Fig. 9 Average response of QCM versus unknown FP pedigrees FPA and FPD in HFA, against gold and 312 steel surfaces. Flow rate at 0.1 mL min−1. Pump activated at 180 seconds. | ||
We can see that the same pattern emerges but the signal is amplified by approximately by a factor of four, which is approximately the same as the difference in the working surface areas on the crystals. The blank signal for the steel (not shown) stabilizes at approximately +250 Hz.
We can draw several inferences from this. In this study gold and steel appear to act in a similar manner, in that they are able to bind particulates that are carried in a liquid gas phase, and that binding between the particles and the sensor surfaces can be measured by both surface types. As expected the size of the working face does bear a significant bearing on the intensity of the signal.
312 steel is used in the manufacture of equipment used to produce these particulate materials, and as demonstrated it is possible for the drug to bind to that type of surface, especially if it bears the properties as shown by FPA. Deposition of materials onto equipment surfaces could lead to effects further down the manufacturing process so this should be taken into account.
Conclusions
This proof-of-concept study explores the use of a QCM to measure the interactions between particles and different surfaces, and particles–particles. In the first part of this study different dry particulate compounds are exposed to different surfaces on a QCM sensor, from a nitrogen stream. The results show that differences can be observed between different compounds and the surfaces. Likewise differences in interactions between fixed particles on the surface and particles in the gas phase were observed suggesting that the QCM can be used to study interactions between the components in drug mixtures such as excipients and active compounds. While the work demonstrated is not quantitative, the qualitative analysis is still useful when predicting potential for particle–particle coagulation.The second part of the study shows the analysis of particles and surfaces in pressurised liquid gas. Here qualitative data show that the system can be used to discriminate between differences in the same compound. It is predicted that further studies of this nature could be used to predict particle coagulation, MDPI failure, or for further material analysis.
This is also an exciting step in terms of the capabilities of QCM use. The demonstration of the QCM in a liquid gas system is relatively novel and expands the range of capabilities of this form of device. The example here is a basic setup which allowed for the flexibility of designing a new flow cell. This design of pressure cell is adaptable and may potentially link to more complex QCM devices.
A further study using samples of known charge is under consideration. This would allow the qualitative data described here to be studied further, for example in dissipation mode, to potentially obtain quantitative data by the use of correct standards. Certainly this would offer access to understanding of the importance of charge, or of size of particles on their interactions with surfaces.
Acknowledgements
We gratefully acknowledge the support of GSK towards funding this project, their donation of samples, and aid in the construction of the pressure cell.References
- H. Chrystyn and C. Niederlaender, Int. J. Clin. Pract., 2012, 66, 309–317 CrossRef CAS PubMed.
- L. S. Hill and A. L. Slater, Respir. Med., 1998, 92, 105–110 CrossRef CAS PubMed.
- S. Newman, S. Malik, P. Hirst, G. Pitcairn, A. Heide, J. Pabst, A. Dinkelaker and W. Fleischer, Respir. Med., 2002, 96, 1026–1032 CrossRef CAS PubMed.
- M. V. Middle, J. Terblanché, V. L. Perrin and M. G. Hertog, Respir. Med., 2002, 96, 493–498 CrossRef CAS PubMed.
- I. J. Smith and M. Parry-Billings, Pulm. Pharmacol. Ther., 2003, 16, 79–95 CrossRef CAS PubMed.
- K. Wetterlin, Pharm. Res., 1988, 5, 506–508 CrossRef CAS.
- M. T. Newhouse, N. P. Nantel, C. B. Chambers, B. Pratt and M. Parry-Billings, Chest, 1999, 115, 952–956 CrossRef CAS PubMed.
- I. Ashurst, A. Malton, D. Prime and B. Sumby, Pharm. Sci. Technol. Today, 2000, 3, 246–256 CrossRef CAS PubMed.
- S. Hoe, D. Traini, H.-K. Chan and P. M. Young, Pharm. Res., 2010, 27, 1325–1336 CrossRef CAS PubMed.
- P. M. Young, A. Sung, D. Traini, P. Kwok, H. Chiou and H.-K. Chan, Pharm. Res., 2007, 24, 963–970 CrossRef CAS PubMed.
- P. M. Holzner and B. W. Muller, Int. J. Pharm., 1995, 116, 11–18 CrossRef CAS.
- S. A. Jones, G. P. Martin and M. B. Brown, Int. J. Pharm., 2005, 302, 154–165 CrossRef CAS PubMed.
- M. Murtomaa, V. Mellin, P. Harjunen, T. Lankinen, E. Laine and V.-P. Lehto, Int. J. Pharm., 2004, 282, 107–114 CrossRef CAS PubMed.
- C. K. O'Sullivan and G. G. Guilbault, Biosens. Bioelectron., 1999, 14, 663–670 CrossRef.
- B. Becker and M. A. Cooper, J. Mol. Recognit., 2011, 24, 754–787 CrossRef CAS PubMed.
- U. Latif, S. Can, O. Hayden, P. Grillberger and F. L. Dickert, Sens. Actuators, B, 2013, 176, 825–830 CrossRef CAS.
- M. Rodahl, F. Höök and B. Kasemo, Anal. Chem., 1996, 68, 2219–2227 CrossRef CAS PubMed.
- R. L. Bunde, E. J. Jarvi and J. J. Rosentreter, Talanta, 1998, 46, 1223–1236 CrossRef CAS PubMed.
- B. Van Dorst, J. Mehta, K. Bekaert, E. Rouah-Martin, W. De Coen, P. Dubruel, R. Blust and J. Robbens, Biosens. Bioelectron., 2010, 26, 1178–1194 CrossRef CAS PubMed.
- L. N. Liebermann and P. Salzmann, Quartz crystal pressure sensor, US patent, US5136885 A, 1992 Search PubMed.
- Y. Hussain, Y.-T. Wu, P.-J. Ampaw and C. S. Grant, J. Supercrit. Fluids, 2007, 42, 255–264 CrossRef CAS.
- W. Ding, M. Klumpp, H. Li, U. Schygulla, P. Pfeifer, W. Schwieger, K. Haas-Santo and R. Dittmeyer, J. Phys. Chem. C, 2015, 119, 23478–23485 CAS.
- M. A. Plunkett, P. M. Claesson, M. Ernstsson and M. W. Rutland, Langmuir, 2003, 19, 4673–4681 CrossRef CAS.
Footnote |
| † Electronic supplementary information (ESI) available. See DOI: 10.1039/c6an01572g |
| This journal is © The Royal Society of Chemistry 2017 |

