 Open Access Article
Creative Commons Attribution 3.0 Unported Licence
Thin layered drawing media probed by THz time-domain spectroscopy†
J.
Tasseva
ab,
A.
Taschin
a,
P.
Bartolini
a,
J.
Striova
c,
R.
Fontana
c and
R.
Torre
*ad
aEuropean lab. for Non-Linear Spectroscopy (LENS), Univ. di Firenze, via N. Carrara 1, I-50019 Sesto Fiorentino, Firenze, Italy. E-mail: torre@lens.unifi.it
bInstitute of Optical Materials and Technolgies Acad. J. Malinowski, Bulgarian Academy of Sciences, Acad. G. Bonchev Street, blok 109, 1113 Sofia, Bulgaria
cIstituto Nazionale di Ottica, INO-CNR, Largo Fermi 6, I-50125 Firenze, Italy
dDip. di Fisica e Astronomia, Univ. di Firenze, via Sansone 1, I-50019 Sesto Fiorentino, Firenze, Italy
First published on 21st November 2016
Abstract
Dry and wet drawing materials were investigated by THz time-domain spectroscopy in transmission mode. Carbon-based and iron-gall inks have been studied, some prepared following ancient recipes and others using current synthetic materials; a commercial ink was studied as well. We measured the THz signals on the thin films of liquid inks deposited on polyethylene pellicles, comparing the results with the thick pellets of dried inks blended with polyethylene powder. This study required the implementation of an accurate experimental method and data analysis procedure able to provide a reliable extraction of the material transmission parameters from a structured sample composed of thin layers, down to a thickness of a few tens of micrometers. THz measurements on thin ink layers enabled the determination of both the absorption and the refractive index in an absolute scale in the 0.1–3 THz range, as well as the layer thickness. THz spectroscopic features of a paper sheet dyed by using one of the iron-gall inks were also investigated. Our results showed that THz time-domain spectroscopy enables the discrimination of various inks on different supports, including the application on paper, together with the proper determination of the absorption coefficients and indices of refraction.
I. Introduction
THz pulse imaging and spectroscopy10 is an emerging non-invasive method for the characterization of cultural heritage artefacts that provides complementary information on traditional analytical tools. With respect to X-rays or UV radiation, THz radiation presents lower risks in terms of molecular stability due to its non-ionizing property as well as its ability of inducing very low thermal stress. Transmission/reflection geometries and time- or frequency domain set-ups are constantly developed for a variety of applications ranging from pharmaceutical chemical mapping, safe security to atmospheric sensing. The potential to provide non-destructive information in the cultural heritage field has been demonstrated on objects such as paintings,17 manuscripts,1,4,9 mural paintings,18 metal alloys5 and stones.8 In particular, Bardon et al.2 have reported the investigation of black inks by THz spectroscopy.T-ray technologies are supported by a series of commercial off-the-shelf systems that enable THz spectroscopic investigations. Designed for few specific applications other than cultural heritage, these systems are not open to full control of signal detection and processing. Therefore, a customized set-up was built for providing a more flexible and powerful application.
In this work, we explored artworks drawing materials with THz-Time Domain Spectroscopy (THz-TDS) extending the investigation to thin layers of inks that was never realized previously. We developed a specific experimental method and data analysis to disentangle multiple reflection signals. Our investigations are based on a well established technique, but the careful building of the THz-TDS experimental set-up and the acquisition procedure enables a very high signal to noise ratio that is not common in this type of experiment. Moreover, the accurate analysis of the data based on the successive iterations in the fitting algorithm enables the calculation of the absolute absorption coefficient and the index of refraction of the materials, as well as the sample thickness down to tens of microns both in single layer and bilayer configurations.
II. Materials and experimental procedures
The inks studied, both iron gall and carbon black inks (Table 1), are commonly used in artworks and can be prepared either following ancient recipes (Giovanni Alcherio 1411) or from synthetic materials.12 They have been sampled from pellets or thin layers; dried inks were blended with polyethylene (PE) powder with a concentration of approximately 33 wt% and pressed to form pellets of 13.2 mm diameter and a thickness of about 1 mm, wet inks were deposited on 10 μm thick PE pellicles to form films with a thickness of the order of tens of micrometers. Moreover, the iron gall ink (recipe B) was also studied when applied to pure cotton paper (Zecchi, Firenze). We investigated the THz spectrum of other inks (i.e. red cochineal, red ochre, indigotin-based and white lead) as well as the individual chemical constituents (i.e. iron(II) sulfate and gallic acid); these results are not reported here and will be discussed in a future publication.| Black | 1 | Iron gall ink with arabic gum (recipe A): 70 mL water, 10 mL white wine, 10 mL red vinegar, 5 g powdered oak galls, 1.25 g arabic gum, 1.25 g FeSO4·7H2O |
| 2 | Iron gall ink without arabic gum (recipe A): 70 mL water, 10 mL white wine, 10 mL red vinegar, 5 g powdered oak galls, 1.25 g FeSO4·7H2O | |
| 3 | Iron gall ink with arabic gum (recipe B): 14 mL distilled water, 1.14 g gallic acid, 0.29 g arabic gum, 0.29 g FeSO4·7H2O | |
| 4 | Iron gall ink commercial black ink (Zecchi, Firenze) | |
| 5 | Carbon-based ink: 14 mL red wine, 0.57 g carbon black (vegetal), 0.71 g arabic gum |
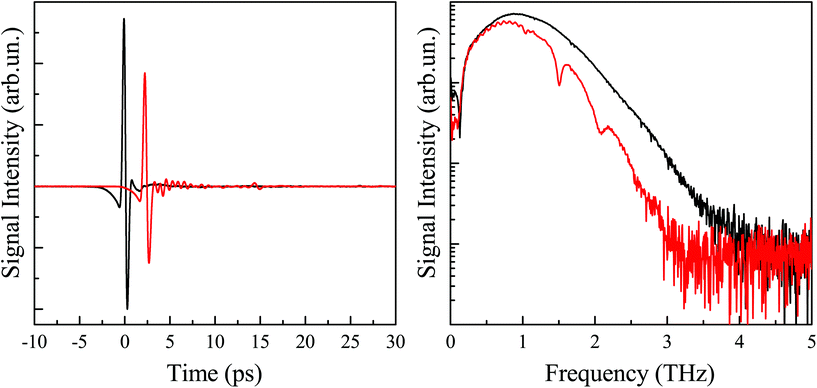
Our table top THz-TDS system enables measurements in the 0.1–4 THz range in transmission configuration. The sample and reference THz signals are cyclically acquired; for every sample scan we took a reference scan. Each single scan is a 300 second long acquisition with a continuous motion of the probe delay line at a velocity of 0.5 mm s−1. Each couple of sample and reference signals is Fourier transformed and their ratio, averaged over all the data, gives the experimental transfer functions defined in the next paragraph. A typical couple of reference and sample signals with their amplitude spectra is shown in Fig. 1 where the Black 3 ink signal from the pellet sample is reported. A detailed description of the experimental set-up and the sample preparation is reported in the ESI.†
III. THz transmission and sample parameters
The spectroscopic properties in the THz range of a material can be obtained by measuring the sample and the reference signals. The ratio between the Fourier transforms of the THz field transmitted through the sample, Et(ω), and of the incident field, Ei(ω), referred to as the transfer function of the material, H(ω), expresses how a plane wave of frequency ω is modified by the absorption and refraction from the medium it encounters. For a homogeneous dielectric slab of thickness d and complex refractive index![[n with combining circumflex]](https://www.rsc.org/images/entities/i_char_006e_0302.gif) s, surrounded by nitrogen, and for normal incidence, the theoretical expression of the transfer function can be written as:20
s, surrounded by nitrogen, and for normal incidence, the theoretical expression of the transfer function can be written as:20 | (1) |
 | (2) |
τ = 2n0/(n0 + ![[n with combining circumflex]](https://www.rsc.org/images/entities/i_char_006e_0302.gif) s) s) | (3) |
τ′ = 2![[n with combining circumflex]](https://www.rsc.org/images/entities/i_char_006e_0302.gif) s/(n0 + s/(n0 + ![[n with combining circumflex]](https://www.rsc.org/images/entities/i_char_006e_0302.gif) s), ρ′ = (n0 − s), ρ′ = (n0 − ![[n with combining circumflex]](https://www.rsc.org/images/entities/i_char_006e_0302.gif) s)/(n0 + s)/(n0 + ![[n with combining circumflex]](https://www.rsc.org/images/entities/i_char_006e_0302.gif) s) s) | (4) |
![[n with combining circumflex]](https://www.rsc.org/images/entities/i_char_006e_0302.gif) s = ns(ω) − iks(ω), where ns(ω) is the refractive index, ks(ω) is the extinction coefficient, and n0 is the real refractive index of nitrogen. Yet in eqn (1) and (2), c is the vacuum speed of light and FP(ω) represents the Fabry–Pérot effect due to the multiple reflections inside the sample.
s = ns(ω) − iks(ω), where ns(ω) is the refractive index, ks(ω) is the extinction coefficient, and n0 is the real refractive index of nitrogen. Yet in eqn (1) and (2), c is the vacuum speed of light and FP(ω) represents the Fabry–Pérot effect due to the multiple reflections inside the sample.
In a TDS transmission experiment the material can be characterized by measuring the experimental transfer function, Hexp(ω), given by the ratio between the complex Fourier transform of the sample signal and the reference signal, from which using eqn (1) and (2) the refractive index, ns(ω), the absorption coefficient, αs(ω) = 2ωks(ω)/c and the thickness could be in principle extracted.
However, a complete analytical solution of eqn (1) and (2) is not available, so the extraction of the sample parameters must be pursued following alternative methods. These are strongly dependent on the nature of the THz signal measured.
If the FP pulse reflections are distinguishable and separable from other contributions in the sample temporal signal, the transfer function can be obtained from the THz signals cutting off the pulse reflections. This simple method enables an immediate extraction of material parameters, but the sample thickness must be known a priori and the detection time-window is limited by the cut (i.e. the ns(ω) and ks(ω) spectra are characterized by a lower resolution).
If the FP pulse reflections are close in time and partially superimposed with the main pulse, due to a short optical path, the cutting process can't be applied. Also in the case where the reflection peaks are well separated but the sample signal shows a long time evolution after the main peak, because of a structured absorption of the medium, see Fig. 1, the simple method can give wrong evaluations of the material parameters. In these cases, the solution methods are based on an iterative process of calculation.7,13–16,19
We implemented a new method of data analysis, described in detail in the ESI,† which is an iterative fitting process based on a polynomial fit of the transmission parameters that enables the extraction of the real physical material parameters (i.e. the index of refraction, absorption coefficient and layer thickness). This method applies to both the free standing single slab or layer (i.e. our pellet samples) and a bilayer system, (i.e. the layered inks on PE pellicles).6,11
IV. Results and discussion
A. Ink–PE pellets
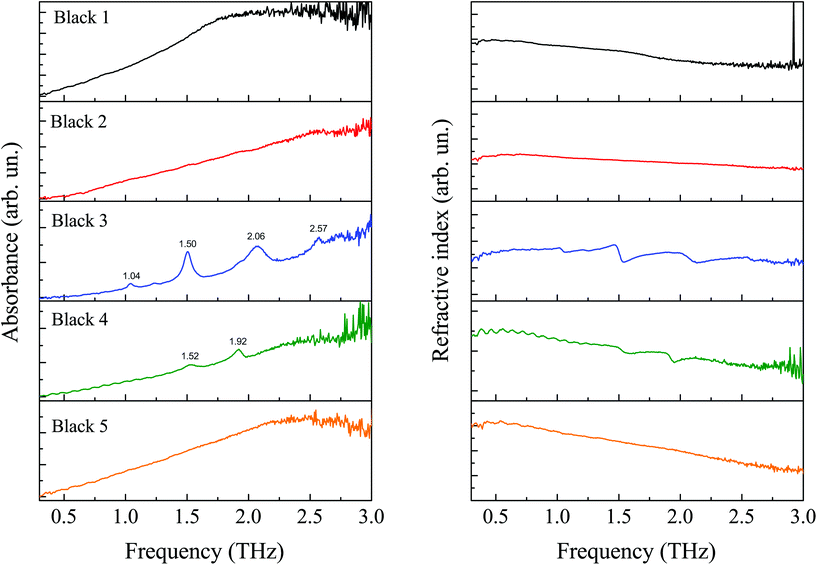
Fig. 2 shows the absorbance spectra and frequency evolution of the refractive indexes for all five black inks, see Table 1, measured on pellets. The inks prepared following the old recipe of mixing mainly iron(II) sulfate and oak gall powder (i.e. recipe A used for Black 1 and 2) show a featureless response in the THz range. The comparison between these two spectra suggests that the arabic gum weakly contributes to the spectral response with a smooth increase of the absorption in the higher frequency range. On the other hand, ink containing synthetic gallic acid (i.e. Black 3 prepared according to recipe B) and commercial ink (i.e. Black 4) show structured spectra with several peaks. Carbon black ink, Black 5, does not exhibit any spectral features. Moreover, the investigation of the Black 1 and 5 inks in the higher frequency range is somehow limited by the saturation phenomena.Our results are in agreement with other THz spectroscopic investigations on similar drawing media.2 The inks prepared following recipe A, Black 1 and 2, do not show any features related either to gallic acid or to iron(II) sulfate. Actually, it is known that under hydrolysis gallic acid is extracted from the oak galls and the related spectroscopic features should appear in the THz spectra. The absence of spectroscopic signatures of gallic acid and iron sulfate is probably due to the chemical processes taking place in the ink preparation. More likely, the iron–gallic complexes oxidized supporting the formation of iron–tannic complexes that are expected not to show any spectroscopic features in the 0.15–3 THz range.2 In the spectra of Black 3, prepared according to recipe B that uses ferrous sulfate and synthesized gallic acid instead of oak-gall powder, we can clearly see the spectroscopic signature of the gallic acid (peaks at about 1.04, 1.50, 2.06, and 2.57 THz) while no ferrous sulfate contribution is present in the spectra. This is likely due to the low molar ratio between the two chemical compounds, about 0.1, which prevents the observation of iron sulfate features.2 In contrast, the commercially available iron gall ink, Black 4, shows a couple of features typical of the iron sulfate (peaks at about 1.52, 1.92 THz) and lacks those of gallic acid.
B. Ink layers on PE
The pellet samples provide very good spectra of the drawing media, as shown in the previous paragraph, nevertheless they have several drawbacks. First of all, these spectra are not acquired on drawing materials in the form of inscriptions, brushstrokes, etc.Moreover, due to difficulties in calculating the molar concentration of inks in pellets, no absolute measurements of the molar absorption coefficient and refractive index may be obtained. Furthermore, scattering processes due to inhomogeneities in the sample must be taken into account as, for example, the band distortions in the absorption spectra, named the Christiansen effect, due to the phenomena of Mie scattering.3 The direct investigation of ink layers by THz-TDS overcomes the previous problems and enables the study of drawing media in their common forms. Nevertheless, this turns out to be a quite difficult task especially if the absolute measurement of the THz transmission parameters is searched for.
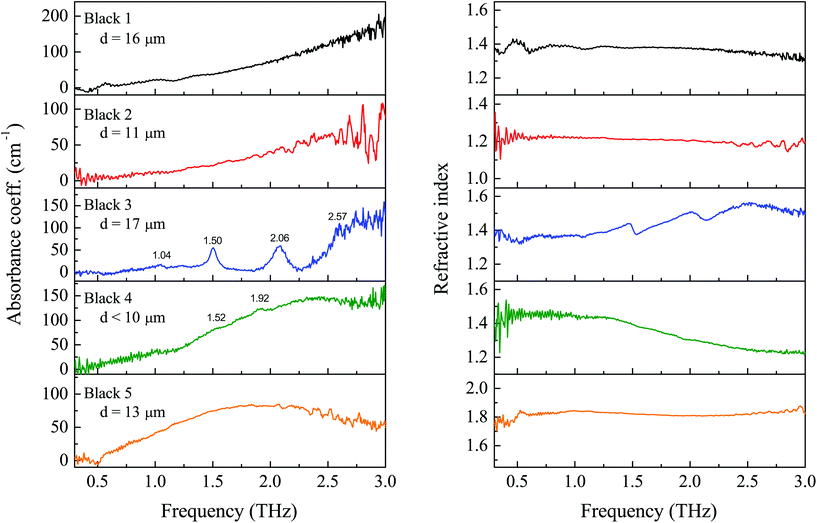
In Fig. 3 we show the optical parameters‡ in the THz range of thin bi-layer samples made by deposition of thin ink films on PE pellicles, as obtained from the data analysis of the TDS investigation. The analysed inks are from the same series reported in Table 1. Our experimental apparatus and data analysis procedure give spectra of a very good signal-to-noise ratio even for thin film samples. We highlight that the determined optical parameters and the layer thickness are in an absolute scale.
Ink layer data confirm the spectral features shown by the pellet samples; the layered inks prepared with oak gall powder (Black 1 and 2) again do not manifest spectral features; the ink prepared by recipe B (Black 3) reveals the presence of gallic acid by peaks in absorbance at 1.50 and 2.06 THz; the commercial iron-gall ink (Black 4) shows the 1.92 THz feature of ferrous sulfate. Therefore the THz-TDS technique proves to be able to distinguish among the various black inks even when they are in the form of a thin film.
C. Ink on paper
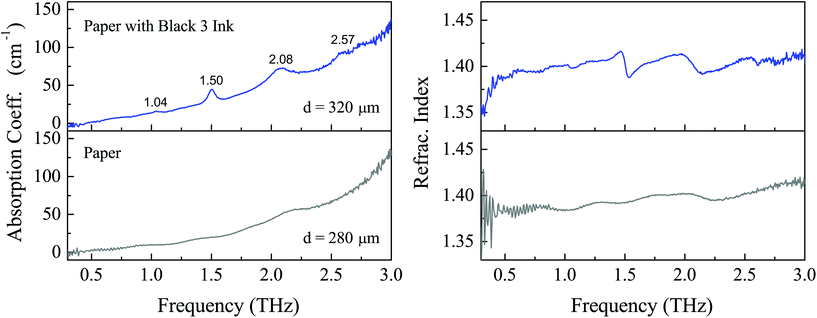
We applied the investigation by THz-TDS experiments on a sample prepared by depositing a few drops of Black 3 ink on a piece of drawing paper. This sample is quite different from the previous ones; in fact the ink penetrates into the paper forming a complex structure where ink particles and paper fibres are interpenetrated. We treated the sample as a homogeneous system. In Fig. 4 we report the results of data analysis. The paper sheet shows a relatively smooth THz spectrum characterized by some very weak absorption bands, after ink deposition, the spectrum shows clearly the signature of Black 3 ink with a calculated sample thickness of about 40 μm.V. Conclusions
We develop an original experimental procedure and a comprehensive method of data analysis to measure the optical parameters of drawing media in the THz spectral range. THz time-domain spectroscopy was applied to investigate black inks, as iron-gall and carbon based inks commonly used in artworks. We determined the absorption coefficient and refractive index spectra of pellet and layered ink samples. The THz spectroscopic measurements on thin films of ink enable the determination of the optical parameters in an absolute scale, making the present research unique and pushing the investigation to a complete quantitative analysis of the real-practice problems and suggesting potential applications of THz spectroscopy in the heritage field. We found that the THz-TDS techniques are able to discriminate between iron-gall black inks prepared either with an old recipe or with modern/commercial preparations both in the pellet sample and in the layered film. Measurements on inked paper, the most commonly utilized support for inks, confirm that it is possible to discern the spectroscopic features of ink also when it penetrates a paper sheet. The reported results point out some common challenges present in THz spectroscopy and imaging of artworks and suggest the possible methods to overcome them.Acknowledgements
We thank very much Dr C. Riminesi for his support on this research. This work was funded by Regione Toscana, prog. POR-CROFSE-UNIFI-26 and by Ente Cassa di Risparmio Firenze, prog. 2015-0857. The authors of INO-CNR acknowledge IPERION CH project GA 654028, funded by the EU community's H2020-research infrastructure program. We acknowledge M. De Pas, A. Montori, and M. Giuntini for providing their continuous assistance in the electronic set-ups; and R. Ballerini and A. Hajeb for the mechanical realizations.Notes and references
- E. Abraham, A. Younus, A. El Fatimy, J. C. Delagnes, E. Nguma and P. Mounaix, Opt. Commun., 2009, 282, 3104–3107 CrossRef CAS.
- T. Bardon, R. K. May, P. F. Taday and M. Strlic, Analyst, 2013, 138, 4859–4869 RSC.
- M. Franz, B. M. Fischer and M. Walther, Appl. Phys. Lett., 2008, 92, 021107 CrossRef.
- K. Fukunaga, Y. Ogawa, S. Hayashi and I. Hosako, IEICE Electron. Express, 2008, 5, 223–228 CrossRef.
- J. B. Jackson, J. Labaune, R. Bailleul-Lesuer, L. D'Alessandro, A. Whyte, J. W. Bowen, M. Menu and G. Mourou, Front. Optoelectron., 2015, 8, 81–92 CrossRef.
- B. Jin, C. Zhang, X. F. Shen, J. L. Ma, J. Chen, S. C. Shi and P. H. Wu, Sci. China Inform. Sci., 2014, 57, 1–10 CrossRef.
- S. Krimi, J. Klier, J. Jonuscheit, G. von Freymann, R. Urbansky and R. Beigang, Appl. Phys. Lett., 2016, 109, 021105 CrossRef.
- K. Krugener, M. Schwerdtfeger, S. F. Busch, A. Soltani, E. Castro-Camus, M. Koch and W. Viol, Sci. Rep., 2015, 5, 14842 CrossRef CAS PubMed.
- J. Labaune, J. B. Jackson, S. Pagé-Camagna, I. N. Duling, M. Menu and G. A. Mourou, Appl. Phys. A, 2010, 100, 607–612 CrossRef CAS.
- Yun-Shik Lee, Principles of terahertz science and technology, Springer, 2009 Search PubMed.
- D. L. MacFarlane and E. M. Dowling, J. Opt. Soc. Am. A, 1994, 11, 236–245 CrossRef.
- M. P. Merrifield, Original treatises on the arts of painting, Dover Publications, 1967 Search PubMed.
- I. Pupeza, R. Wilk and M. Koch, Opt. Express, 2007, 15, 4335–4350 CrossRef CAS PubMed.
- M. Scheller, Opt. Express, 2011, 19, 10647–10655 CrossRef PubMed.
- M. Scheller, C. Jansen and M. Koch, Opt. Commun., 2009, 282, 1304–1306 CrossRef CAS.
- M. Scheller and M. Koch, J. Infrared, Millimeter, Terahertz Waves, 2009, 30, 762–769 CrossRef CAS.
- C. Seco-Martorell, V. López-Domínguez, G. Arauz-Garofalo, A. Redo-Sanchez, J. Palacios and J. Tejada, Opt. Express, 2013, 21, 17800–17805 CrossRef CAS PubMed.
- G. C. Walker, J. W. Bowen, W. Matthews, S. Roychowdhury, J. Labaune, G. Mourou, M. Menu, I. Hodder and J. B. Jackson, Opt. Express, 2013, 21, 8126–8134 CrossRef PubMed.
- W. Withayachumnankul, B. Ferguson, T. Rainsford, S. P. Mickan and D. Abbott, Proc. SPIE, 2005, 221–231 CrossRef CAS.
- W. Withayachumnankul and M. Naftaly, J. Infrared, Millimeter, Terahertz Waves, 2014, 35, 610–637 CrossRef CAS.
Footnotes |
| † Electronic supplementary information (ESI) available. See DOI: 10.1039/C6AN02113A |
| ‡ To conform us with the previous literature, the transmission characteristics of the material are referred to as “optical parameters” even if they concern the THz spectral region that is outside the commonly defined optical region. |
| This journal is © The Royal Society of Chemistry 2017 |


