DOI:
10.1039/C6CE01924B
(Paper)
CrystEngComm, 2017,
19, 47-63
Occurrence of 3D isostructurality in fluorinated phenyl benzamidines†
Received
2nd September 2016
, Accepted 15th November 2016
First published on 16th November 2016
Abstract
In the current study, we report the existence of 3D isostructurality behaviour in pairs of isomeric molecules existing as E–Z isomers. The polymorphic forms E1 and E2 of (E)-2-fluoro-N′-(3-phenyl) benzimidamide are individually isostructural with (E)-2-fluoro-N′-phenylbenzimidamide and (E)-2-fluoro-N′-(2-fluorophenyl) benzimidamide, respectively. Furthermore, a similar compound, (Z)-3-fluoro-N′-(4-fluorophenyl) benzimidamide, is isostructural with (Z)-4-fluoro-N′-(4-fluorophenyl) benzimidamide. The structural feature has been analyzed in terms of the nature and energetics of the equivalent supramolecular building blocks associated with the presence of various intermolecular interactions in the crystal packing. The crystal packing similarities have been investigated quantitatively via XPac analysis and the energy vector model. It is noteworthy to observe the presence of a rarely observed N–H⋯F interaction which plays an important role in the crystal packing of [(Z)-3-fluoro-N′-(4-fluorophenyl) benzimidamide]/[(Z)-4-fluoro-N′-(4-fluorophenyl) benzimidamide]. The NCI isosurface signifies the “attractive” nature of the N–H⋯F and N–H⋯π interactions and the different types of C–H⋯F dimeric motifs. An analysis of the two-dimensional fingerprint plots also provides a quantitative understanding of the occurrence of isostructurality in these compounds.
Introduction
The design of novel supramolecular architectures utilizing non-covalent interactions in the development of novel pharmaceutical compounds is the current interest in crystal engineering.1 It is important to understand the role of intermolecular interactions in the design of similar molecular arrangements having equivalent structural motifs in molecular crystals.2 The control of the mutual arrangement of the molecules in the solid state to obtain the desired characteristics utilizing the intermolecular interactions is the art of crystal engineering.3,4 According to the IUCr definition of isostructurality, “Two crystals are said to be isostructural if they have the same structure, but not necessarily the same unit-cell dimensions nor the same chemical composition, with a comparable variability in the atomic coordinates to that of the cell dimensions and chemical composition”.5 It is of interest to study the phenomenon of isostructurality in isostructural polymorphs,6–11 isostructural co-crystals1,12,13 and isostructural solvates14 on account of their applications in the pharmaceutical industry.15–20 This behaviour is very common in similar related compounds having different types of structural equivalent functionalities like –H, –CH3, –F, –Cl, –Br and I.21–23 Gelbrich and co-workers have studied fourteen crystal structures of 4,5′-substituted benzenesulfonamido-2-pyridines with interchange of the substituent having those functionalities and observed the robustness of the supramolecular architectures having N–H⋯N bonded centrosymmetric dimers in three-dimensional (3D) isostructural molecular arrangement.23 Similarly related compounds can also exhibit 1D (one-dimensional) and 2D (two-dimensional) isostructural similarity instead of 3D (three-dimensional) isostructurality.24,25
N-Aryl benzamidines are an important class of compounds having interesting biological properties, including inhibitor activity towards tyrosine kinases26 and nitric oxide synthases,27 and can act as selective D1 dopamine receptor antagonists.28 In addition, antimicrobial29 and antiparasitic30–32 activities have also been reported.33 The presence of the fluorine atom in the molecule is responsible for the better physicochemical properties, chemical reactivity, and biological activity compared to the non-fluorinated analogues.34–37 Organic fluorine has been observed to behave differently in an organic environment, and its contribution in the context of crystal engineering is now widely established.38
Experimental
Synthesis
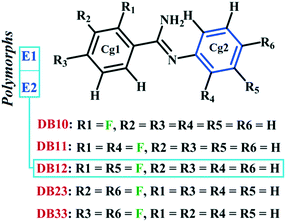
In this study, we have synthesized the four fluorinated benzamidine compounds (Schemes 1 and 2) DB10 [(E)-2-fluoro-N′-phenylbenzimidamide], DB11 [(E)-2-fluoro-N′-(2-fluorophenyl) benzimidamide], DB23 [(Z)-3-fluoro-N′-(4-fluorophenyl) benzimidamide] and DB33 [(Z)-4-fluoro-N′-(4-fluorophenyl) benzimidamide]. For this, a round bottom flask (10 mL) containing a stirrer bar and 0.70 g of powdered anhydrous aluminium chloride (∼1.2 eq.) was charged with 1 eq. of fluorinated benzonitrile at room temperature (25 °C) in a silicon oil bath placed on a magnetic stirrer. A guard tube (filled with anhydrous calcium carbonate) was attached on top of the round bottom flask. Then the mixture was heated up to 100 °C until a homogeneous melt (aluminium chloride–fluorobenzonitrile complex) was formed. After 30 minutes, 1 eq. of fluorinated aniline was added at a time into the melted mixture by using a syringe. The temperature was increased up to 120 °C and the whole mixture was stirred for 6 hours. Then the mixture was kept at room temperature until it cooled down. The resultant black solid was crushed and extracted with 20 ml aqueous NaOH (12%) solution and 20 ml dichloromethane (2–3 times) into a separating funnel. Then the organic layer was washed several times with water and dried over anhydrous Na2SO4, filtered and concentrated under reduced pressure. The final product was purified by silica gel chromatography. After purification the compounds were characterized via1H-NMR, FTIR, PXRD, DSC (Differential Scanning Calorimetry) [Fig. S1–S4†] and Single Crystal X-ray Diffraction (SCXRD).
 |
| | Scheme 1 | |
 |
| | Scheme 2 | |
Crystal growth and data collection
All the single crystals were obtained by the method of solvent evaporation at a slow rate. The synthesized compound was dissolved in a polar/non-polar solvent (HPLC grade) and then allowed to stand at different temperatures until the solvent had completely evaporated. The crystals of DB10, DB11 and DB23 were obtained from dichloromethane and hexane (4![[thin space (1/6-em)]](https://www.rsc.org/images/entities/char_2009.gif) :
:![[thin space (1/6-em)]](https://www.rsc.org/images/entities/char_2009.gif) 1) solvent using a layering method at 5 °C. The crystal of DB33 was obtained from toluene solvent at 25 °C. The single crystal diffraction data were collected on a Bruker APEX II diffractometer equipped with a CCD area detector using monochromated Mo Kα radiation using Bruker Apex II software.39 The frames were integrated by using the Bruker SAINT40 suite of programs. The crystal structures were solved by direct methods using the SIR 92 program.41 The data were corrected for absorption effects using SADABS.42 The structures were refined by the full matrix least squares method using SHELXL 201443 present in the program suite WinGX (version 2014.1).44 The non-hydrogen atoms were refined anisotropically and the hydrogen atoms bonded to C and N atoms were positioned geometrically and refined using a riding model with Uiso(H) = 1.2Ueq (C, N). The crystal packing diagrams were generated using the Mercury 3.5.1 (CCDC) program.45 Geometrical calculations were done using the programs PARST46 and PLATON.47Table 1 lists the details of the structure refinement for the four new crystal structures.
1) solvent using a layering method at 5 °C. The crystal of DB33 was obtained from toluene solvent at 25 °C. The single crystal diffraction data were collected on a Bruker APEX II diffractometer equipped with a CCD area detector using monochromated Mo Kα radiation using Bruker Apex II software.39 The frames were integrated by using the Bruker SAINT40 suite of programs. The crystal structures were solved by direct methods using the SIR 92 program.41 The data were corrected for absorption effects using SADABS.42 The structures were refined by the full matrix least squares method using SHELXL 201443 present in the program suite WinGX (version 2014.1).44 The non-hydrogen atoms were refined anisotropically and the hydrogen atoms bonded to C and N atoms were positioned geometrically and refined using a riding model with Uiso(H) = 1.2Ueq (C, N). The crystal packing diagrams were generated using the Mercury 3.5.1 (CCDC) program.45 Geometrical calculations were done using the programs PARST46 and PLATON.47Table 1 lists the details of the structure refinement for the four new crystal structures.
Table 1 Data collection and details of the structure refinement
| Sample code |
DB10
|
DB11
|
DB23
|
DB33
|
| Formula |
C13H11N2F1 |
C13H10N2F2 |
C13H10N2F2 |
C13H10N2F2 |
| Formula weight |
214.24 |
232.23 |
232.23 |
232.23 |
| Temperature (K) |
100(2) |
100(2) |
100(2) |
100(2) |
| Wavelength (Å) |
0.71073 |
0.71073 |
0.71073 |
0.71073 |
| Solvent system |
DCM + hexane, LT |
DCM + hexane, LT |
DCM + hexane, LT |
Toluene, RT |
| CCDC/refcode |
982077
|
982078
|
982081
|
982085
|
| Crystal system |
Monoclinic |
Monoclinic |
Monoclinic |
Monoclinic |
| Space group |
P21/c |
C2/c |
P21/c |
P21/c |
|
a (Å) |
12.5078(9) |
22.9004(12) |
9.4875(3) |
9.6935(3) |
|
b (Å) |
8.3906(6) |
11.9080(6) |
11.5929(4) |
10.9094(3) |
|
c (Å) |
11.3259(9) |
8.2228(5) |
10.3365(3) |
10.3672(3) |
|
α (°) |
90.00 |
90 |
90 |
90 |
|
β (°) |
116.232(4) |
104.178(3) |
93.915(2) |
94.576(2) |
|
γ (°) |
90.00 |
90 |
90 |
90 |
|
V (Å3) |
1066.21(14) |
2174.0(2) |
1134.23(6) |
1092.84(6) |
|
Z′, Z |
1, 4 |
1, 8 |
1, 4 |
1, 4 |
| Density (g cm−3) |
1.335 |
1.419 |
1.360 |
1.411 |
|
μ (mm−1) |
0.093 |
0.110 |
0.105 |
0.109 |
|
F (000) |
448 |
960 |
480 |
480 |
|
θ (min, max) |
1.82, 27.46 |
1.83, 30.16 |
2.15, 31.47 |
2.11, 27.39 |
| Treatment of hydrogens |
Fixed |
Fixed |
Fixed |
Fixed |
|
h
min,max, kmin,max, lmin,max |
(−16, 16), (−7, 10), (−14, 14) |
(−32, 32), (−16, 16), (−8, 11) |
(−13, 11), (−12, 17), (−15, 15) |
(−10, 12), (−9, 14), (−13, 13) |
| No. of ref. |
8359 |
11![[thin space (1/6-em)]](https://www.rsc.org/images/entities/char_2009.gif) 982 982 |
14![[thin space (1/6-em)]](https://www.rsc.org/images/entities/char_2009.gif) 067 067 |
8976 |
| No. of unique ref./obs. ref. |
2361, 1727 |
3220, 2579 |
3696, 2804 |
2452, 2163 |
| No. parameters |
150 |
96 |
158 |
154 |
|
R_all, R_obs |
0.0731, 0.0494 |
0.1010, 0.0850 |
0.0753, 0.0574 |
0.0433, 0.0380 |
| wR2_all, wR2_obs |
0.1388, 0.1250 |
0.2268, 0.2131 |
0.1511, 0.1413 |
0.1003, 0.0966 |
| Δρmin,max (e Å−3) |
−0.401, 0.272 |
−0.996, 1.269 |
−0.582, 0.856 |
−0.231, 0.249 |
| G. o. F. |
1.072 |
1.107 |
1.073 |
1.040 |
Crystallographic modelling of disorder
The occupancies of the disordered fluorine atom (connected with the carbon atom in the ortho and meta positions on the phenyl ring) at two positions were refined by using the PART command in SHELXL 2014, namely F1A and F1B and F2A and F2B (the ‘A’ part contains the higher occupancy and the ‘B’ part contains the lower occupancy for that atom). The anisotropic displacement parameter for these two sites was fixed using the EADP command. The disorder of the phenyl rings was modelled using the AFIX 66 command for DB11. The C–F bond distances were fixed using the DFIX command in the case of DB11 and DB23. Furthermore, the DFIX and FLAT commands were used to bring the minor part (F1B or F2B) of the fluorine atom in the plane (C1B > C6B) of the phenyl ring.
The previously investigated E isomer, in a similar class of compounds, DB12 [(E)-2-fluoro-N′-(3-phenyl) benzimidamide]48 has two polymorphic forms, namely E1 (form I) and E2 (form II) wherein the role of N–H⋯π induced E/Z isomerization has been studied. Fig. S5† shows the ORTEPs for all the six compounds. It is noteworthy that DB10 (E-isomer) is isostructural with the polymorphic form E1 (refcode: KUCSOS) and DB11 (E-isomer) is isostructural with the other polymorphic form E2 (refcode: KUCZAL). Furthermore, another similar class of compound, DB23 (Z-isomer), is isostructural with DB33 (Z-isomer).
Computational analysis
XPac analysis
The crystal packing similarities which exist between these compounds (DB10–E1, DB11–E2 and DB23–DB33) have been analyzed quantitatively using the XPac 2.0.249,50 program. It gives information about the extent of dissimilarity (dissimilarity index x) as well as the dissimilarity parameters (stretch parameter, change in angles and planes) between two crystal structures. For XPac analysis, we have taken all the atomic coordinates (in crystal geometry) except for the hydrogen and fluorine atoms.
Intermolecular interaction energy
The dimeric interaction energies associated with the various non-covalent interactions present in the crystal packing were estimated using the PIXEL (version 12.5.2014)51–57 program. The electron densities were calculated using the Gaussian 09 program58 at the MP2/6-31G** level to generate the required PIXEL input. The total lattice energy of the molecule is classified into the corresponding Coulombic, polarization, dispersion and repulsion terms. In this study, all the analysis has been performed by taking the atomic coordinates of the major conformer A.
Energy vector model
The crystal packing similarity of these sets of isostructural compounds was also analyzed in terms of the energy vector model59–61 using the processPIXEL method.62 This constitutes a diagrammatic representation of the distribution of intermolecular interaction energies which govern the formation of supramolecular architectures.62 The energy vector diagram represents the image of a molecule based on the energetic contribution (Coulombic, polarization, dispersion and repulsion) of each basic structural motif (BSM) related to the various symmetry operations in the crystal lattice. The vector length scaled against the total PIXEL energy for the corresponding pairwise intermolecular interactions is represented as:where Li is the scaled vector length for an interaction i, Ri is the distance between the molecular centers, Ei is the calculated interaction energy, and Emax is the most stabilizing calculated interaction energy in the structure.63 From eqn (1), the vector corresponding to the most stabilizing molecular fragment has a length equal to half of the centroid–centroid distance between two interacting fragments and the most stabilizing pair is highlighted by a continuous line joining the centroids of the interacting molecules.
QTAIM analysis
Furthermore, QTAIM64,65 analysis of some selected building blocks at the crystal geometry (with the hydrogen atoms moved to their neutron value) was performed at the MP2/6-311++G** level using the Gaussian 09 program. The formatted checkpoint file (fchk) was taken as the input file for AIMALL (version 13.05.06)66 calculation. The topological features at the bond critical points are computed: (i) electron density (ρb), (ii) Laplacian (∇2ρb), (iii) local potential energy (Vb), and (iv) kinetic energy density (Gb). The dissociation energies for the different intermolecular interactions were determined using the empirical approach: (i) Eint = −0.5Vb (in au).67,68
Results and discussion
Analysis of structural similarity
Table S1† lists the three relevant torsions and the angle between the two phenyl rings at the crystal geometry. The torsion angles of these structures show that the molecular conformations of DB10–E1 and DB11–E2 are similar, whereas the molecular conformations of DB23 and DB33 are different and the dihedral angle between the two phenyl rings is 56.6° in DB23 and 87.2° in DB33. XPac analysis shows that the isostructural compounds consist of three-dimensional (3D) supramolecular constructs with a dissimilarity index of 2.1 for DB10–E1 (Fig. 1), 2.2 for DB11–E2 (Fig. 2) and 9.7 for DB23–DB33 (Fig. 3). The δp/δa [where δa and δp are the angular parameters for the change in angle and plane, respectively] diagrams for all the cases (DB11–E1, DB11–E2 and DB23–DB33) contain a region with closely distributed data points at a low angle (δa = 1.0°, 1.6° and 3.6°). Similarly, X/δp diagrams which display the extent of stretching in the crystal packing of one structure compared to the other also show very closely distributed data points with stretch parameter = 0.06 Å and 0.10 Å for DB11–E1 and DB11–E2, respectively, whereas in the case of DB23–DB33, the distributed data points are relatively spread out, the stretch parameter being 0.18 Å. Thus, this analysis fully supports that the crystal packing arrangements of the two polymorphic forms E1 and E2 are individually similar to the molecular arrangements of DB10 and DB11, respectively.
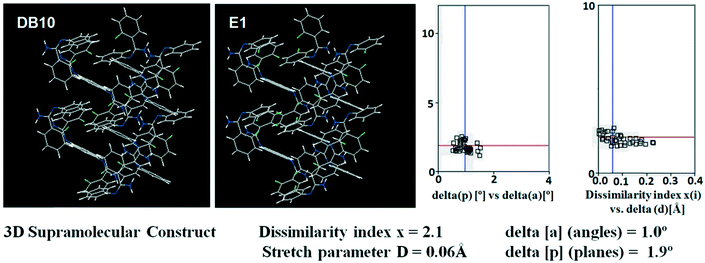 |
| | Fig. 1 3D supramolecular constructs obtained from XPac analysis of the isostructural molecules DB10 and E1. | |
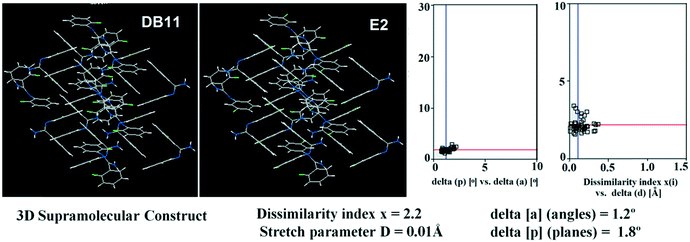 |
| | Fig. 2 3D supramolecular constructs obtained from XPac analysis of the isostructural molecules DB11 and E2. | |
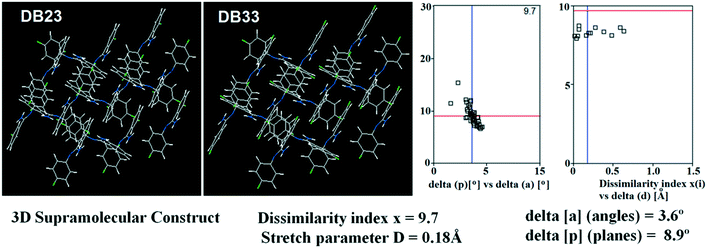 |
| | Fig. 3 3D supramolecular constructs obtained from XPac analysis of the isostructural molecules DB23 and DB33. | |
Isostructural DB10–E1
DB10 (Fig. S5a†) and E1 (Fig. S5b:† polymorphic form of DB12) crystallize in the monoclinic system in the centrosymmetric P21/c space group with four molecules in the unit cell (Z = 4). The difference between these two structures is that E1 has one extra fluorine atom attached at the meta position on the second phenyl ring (Cg2). The fluorine atom attached at the ortho position is positionally disordered and refined as F1A (major) and F1B (minor), F2A and F2B. Fig. 4 shows the overall molecular arrangement of (a) DB10 and (b) E1 down the ab plane. Table S2† lists the lattice energy of four new structures (DB10, DB11, DB23 and DB33). All the molecular pairs were extracted from the crystal packing and their stabilization energies were obtained using the PIXEL method. Each molecular pair of one structure has an equivalent molecular pair [Fig. 5 and Fig. S6(a) and (b)†] associated with the same or different intermolecular interactions present in the crystal packing of compounds which exhibit isostructurality. The total stabilization energy for each molecular pair is partitioned into coulombic, polarization, dispersion and repulsion terms. Table 2 lists all the molecular pairs of DB10 with their stabilization energies and the centroid–centroid distances. The molecular pairs of E1 and E2 were already mentioned (Table 2) in the previous report.48 The primary building blocks (I; ∼−42.5 kJ mol−1) associated with the strong N–H⋯N (dH⋯N = 2.11 Å and ∠N2–H2B⋯N1 = 149°) H-bonds and weak N–H⋯π (dH⋯Cg = 2.36 Å and ∠N2–H2A⋯Cg1 = 161°) interactions generate a molecular chain along the crystallographic b axis. These molecular chains are interlinked with each other down the ab plane via weak C–H⋯F and C–H⋯π interactions and π⋯π stacking. Thus, the N–H⋯π interaction plays an important role in the observed isostructurality between DB10 and E1. Fig. 6 shows the electrostatic and the dispersion contributions to the total stabilization for all the equivalent molecular pairs. In the case of the equivalent molecular pair DB10–I and E1–I (Fig. 5a), the electrostatic (64%) and the dispersion (36%) contributions to the total stabilization are comparable. The difference in the stabilization energies between the equivalent molecular pairs DB10–III (−21.2 kJ mol−1)/E1–IV (−19.3) (Fig. 5b) and DB10–IV (−19.9 kJ mol−1)/E1–III (−21.4 kJ mol−1) (Fig. 5c) is −1.9 kJ mol−1. Between the equivalent molecular pairs DB10–IV/E1–III, the latter has the intermolecular C–H⋯F interaction, but in the former case it is absent. Instead of a C–H⋯F interaction, there is the formation of a H⋯H contact with a distance of 2.35 Å (less than the sum of the vdW radii of hydrogen atoms). Because of this, E1–III has 6% more electrostatic contribution than DB10–IV. The equivalent molecular pairs DB10–V/E1–V (Fig. 5d) have a comparable energy of ∼−12.5 kJ mol−1. Between the structurally equivalent molecular pairs DB10–VI (−12.2 kJ mol−1) and E1–VI (−9.7 kJ mol−1) (Fig. 5e), E1–VI has short C–H⋯F interactions (dH⋯F = 2.40 Å) and a weak C–H⋯π interaction, but DB10–VI has only a weak C–H⋯π interaction. Thus, DB10–VI has 9% less electrostatic contribution compared to E1–VI. The equivalent molecular pairs DB10–VII/E1–VII (Fig. S6b†) and DB10–VIII/E1–VIII (Fig. 5f) also contribute to the stabilization of the crystal packing. The contributions from these molecular pairs are mainly of the dispersive (∼90%) type. In the case of the equivalent molecular pairs DB10–II (23.8 kJ mol−1) and E1–II (25.9 kJ mol−1) (case of parallel dipole⋯dipole interaction), the dispersion contribution is more dominant than the electrostatic contribution (Fig. S6a†). The centroid–centroid distances between two interacting molecules are 6.462 Å and 6.515 Å for DB10–II and E1–II, respectively. Hence the repulsion energy is less for E1–II.
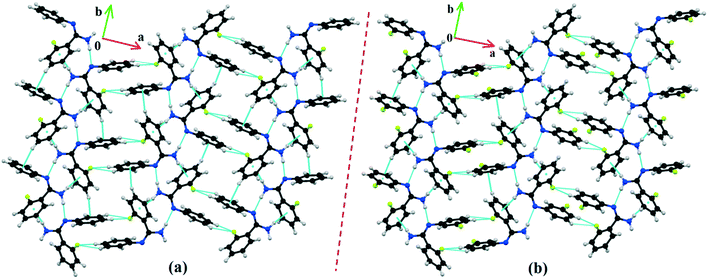 |
| | Fig. 4 The molecular arrangements of the isostructural compounds (a) DB10 down the ab plane and (b) E1 down the ab plane. | |
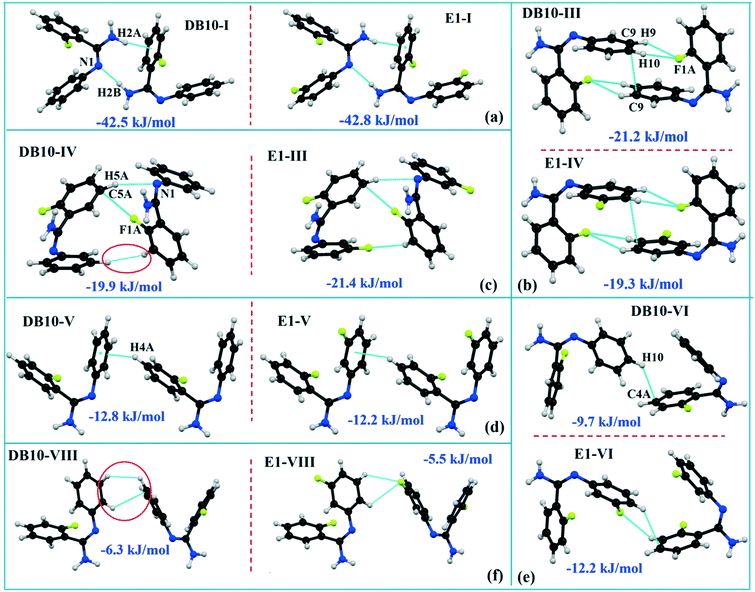 |
| | Fig. 5 The equivalent molecular building blocks (a–f) for the isostructural compounds DB10–E1. | |
Table 2 The stabilization energy (in kJ mol−1) of the molecular pairs for the DB10 and E1 [D = the centroid–centroid distance between two interacting molecules]
| Motifs |
Symmetry code |
D (Å) |
E
Coul
|
E
Pol
|
E
Disp
|
E
Rep
|
E
Tot
|
Possible interactions |
Geometry (Å/°) |
|
DB10
|
| I |
−x, y − 1/2, −z + 1/2 |
7.086 |
−36.3 |
−18.6 |
−30.3 |
42.7 |
−42.5 |
N2–H2B⋯N1 |
2.11, 149 |
| N2–H2A⋯Cg1 |
2.36, 161 |
| II |
−x, −y, 1 − z |
6.462 |
−9.4 |
−1.8 |
−15.9 |
3.3 |
−23.8 |
vdWaals, C12–H12⋯N2 |
3.04, 143 |
| C6A–H6A⋯N1 |
3.28, 158 |
| III |
1 − x, −y, 1 − z |
6.737 |
−6.1 |
−4.0 |
−32.2 |
21.1 |
−21.2 |
C10–H10⋯F1A |
2.54, 122 |
| C9–H9⋯F1A |
2.62, 119 |
| C9⋯C9 |
3.477(3) |
| IV |
x, −0.5 − y, 0.5 + z |
6.073 |
−6.6 |
−4.2 |
−29.5 |
20.5 |
−19.9 |
C5A–H5A⋯N1 |
2.59, 156 |
| C2A–F1A⋯C5A |
2.988(3), 136 |
| H3A⋯H11 |
2.35 |
| V |
x, 1 + y, z |
8.391 |
−7.3 |
−4.0 |
−18.9 |
17.6 |
−12.8 |
C4A–H4A⋯Cg2 |
2.56, 136 |
| VI |
1 − x, −0.5 + y, 1.5 − z |
8.101 |
−1.3 |
−1.0 |
−12.0 |
4.6 |
−9.7 |
C10–H10⋯C4A |
2.90, 136 |
| VII |
−x, −1 − y, 1 − z |
8.862 |
1.1 |
−1.2 |
−13.5 |
6.5 |
−7.0 |
C5A⋯C6A |
3.660(3) |
| VIII |
x, 0.5 − y, 0.5 + z |
8.396 |
−0.6 |
−0.8 |
−8.9 |
3.9 |
−6.3 |
H9⋯H11 |
2.70 |
| C8–H8⋯C11 |
2.99, 134 |
|
E1
|
| II |
2 − x, −y, 1 − z |
6.515 |
−12.1 |
−1.6 |
−14.0 |
1.8 |
−25.9 |
vdWaals, C12A−H12A⋯N2 |
3.44, 157 |
| C6A–H6A⋯N1 |
3.31, 142 |
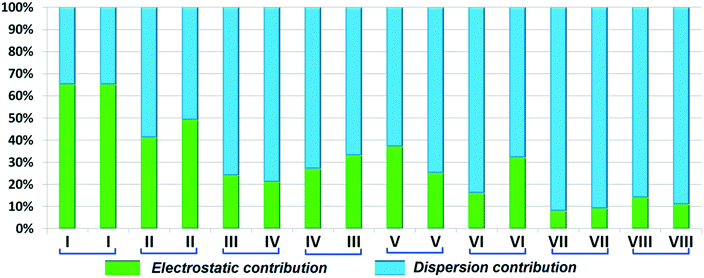 |
| | Fig. 6 Comparison of the percentage energy contribution towards total stabilization for the equivalent molecular pairs DB10 and E1. | |
Isostructural DB11–E2
The compounds DB11 (Fig. S5c†) and E2 (Fig. S5d†) crystallize in the centrosymmetric monoclinic space group C2/c with eight molecules in the unit cell (Z = 8). The difference between the two molecules is the change in fluorination on the second phenyl ring (Cg2), i.e. the fluorine atom is ortho-substituted for DB11 and meta-substituted for E2. In each case, the fluorine atom is disordered over two positions, namely F1A (major part) and F1B (minor part); F2A and F2B. The crystal packing arrangements for DB11 and E2 are similar wherein for both cases the crystal packing is mainly stabilized via the centrosymmetric N–H⋯N dimer which plays a crucial role resulting in a similar packing pattern with structurally equivalent building blocks (Fig. 7). In the presence of a strong hydrogen bond, the synergistic effect of weak intermolecular interactions (like C–H⋯F, C–H⋯π and π⋯π stacking) also provide additional stability to the crystal packing. From a detailed PIXEL analysis, all the molecular pairs were extracted from the crystal packing. Table 3 lists all the molecular pairs with their stabilization energies for DB11. The new molecular fragment III (centrosymmetric dimer associated with C–H⋯F interaction and π⋯π stacking) of E2 is equivalent to the molecular fragment III of DB11. All the equivalent molecular pairs with their stabilization energies are shown in Fig. 8 and S6c.† In most of the equivalent motifs [a (DB11–I and E2–II), b (DB11–II and E2–I), c (DB11–III and E2–III), d (DB11–IV and E2–IV) and e (DB11–V and E2–V)] the stabilization energies are comparable with each other. Subsequently, the energetic contributions (electrostatic and dispersion contribution) are also equivalent (Fig. 9). The centrosymmetric N–H⋯N dimer is the strongest molecular pair (having a stabilization energy of −45.4 kJ mol−1) for E2 and provides maximum stability to the lattice, whereas DB11–I (involving a strong N–H⋯N hydrogen bond and a weak N⋯C contact) is the strongest molecular pair for DB11. In the case of the C–H⋯F centrosymmetric dimer [DB11–VI and E2–VIII; Fig. 8f] the stabilization energy is −2.6 kJ mol−1 higher for the former DB11–VI (which does not contain a F⋯F contact) than that for E2–VII [having a F⋯F contact, at a distance of 3.118(2) Å]. Furthermore, the electrostatic contribution is 12% more than in the latter case. It is of interest to note that although DB11–VIII (−6.8 kJ mol−1) and E2–VI (−10.1 kJ mol−1), because of the existence of isostructurality, are the structurally equivalent motifs, following the robustness of the supramolecular architecture (Fig. 8g), their stabilization energies are different. In DB11–VIII, as only a H⋯H contact is present, hence the maximum contribution comes from the dispersion (16% electrostatic) whereas in E2–VI, there is a formation of bifurcated C–H⋯F interactions (41% electrostatic). Between the molecular pairs DB11–IX (−0.3 kJ mol−1; involving a short type I F1A⋯F1A contact with an “unusually short” distance of 2.456(4) Å) and E2–IX (−6.4 kJ mol−1; involving a short type I F1A⋯F1A contact with a distance of 2.711(2) Å) [Fig. 8h], the electrostatic contribution is 13% more and the repulsion energy is 10.3 kJ mol−1 less in the case of E2–IX in comparison to the former.
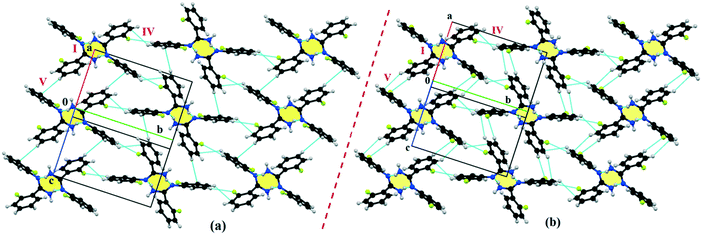 |
| | Fig. 7 The connectivity and the packing patterns for the isostructural (a) DB11 and (b) E2. | |
Table 3 The stabilization energy (in kJ mol−1) of the molecular pairs for DB11 and E2 [D = the centroid–centroid distance between two interacting molecules]
| Motifs |
Symmetry code |
D (Å) |
E
Coul
|
E
Pol
|
E
Disp
|
E
Rep
|
E
Tot
|
Possible interactions |
Geometry (Å/°) |
|
DB11
|
| I |
x, −y, 0.5 + z |
6.564 |
−30.7 |
−14.7 |
−36.7 |
40.0 |
−42.2 |
N2–H2B⋯N1 |
2.09, 156 |
| N2⋯C2A |
3.563(4) |
| II |
2 − x, −y, 2 − z |
7.692 |
−32.1 |
−10.3 |
−17.9 |
19.9 |
−40.4 |
N2–H2A⋯N1 |
2.39, 144 |
| III |
1.5 − x, 0.5 − y, 1 − z |
6.690 |
−9.7 |
−4.0 |
−30.8 |
18.3 |
−26.2 |
C4A–H4A⋯F2A |
2.48, 154 |
| C4A⋯C5A |
3.791(5) |
| IV |
x, 1 − y, 0.5 + z |
7.939 |
−4.2 |
−2.3 |
−16.2 |
10.3 |
−12.3 |
C9A−H9A⋯F1A |
2.67, 138 |
| V |
x, y, 1 + z |
8.223 |
−3.6 |
−1.7 |
−13.4 |
7.4 |
−11.4 |
C3A–H3A⋯π(C10A) |
3.01, 143 |
| VI |
1.5 − x, 0.5 − y, 2 − z |
7.645 |
−4.2 |
−1.4 |
−10.4 |
6.7 |
−9.3 |
C11A–H11A⋯F2A |
2.49, 147 |
| VII |
2 − x, 1 − y, 2 − z |
8.894 |
−1.4 |
−0.3 |
−7.0 |
1.4 |
−7.2 |
C9A–H9A⋯C8A |
3.14, 138 |
| VIII |
1.5 − x, 0.5 + y, 1.5 − z |
8.334 |
−0.8 |
−0.9 |
−9.0 |
3.9 |
−6.8 |
H11A⋯H6A |
2.64 |
| H10A⋯H5A |
2.40 |
| IX |
2 − x, y, 1.5 − z |
5.684 |
2.4 |
−3.0 |
−27.7 |
28.1 |
−0.3 |
F1A⋯F1A |
2.456(4) |
| C8A–H8A⋯F1A |
2.53, 123 |
|
E2
|
| III |
0.5 − x, 0.5 − y, 1 − z |
6.902 |
−7.4 |
−2.5 |
−22.3 |
8.4 |
−23.8 |
C4A–H4A⋯F2A |
2.59, 128 |
| C4A⋯C5A |
3.777(2) |
| VII |
1 − x, 1 − y, 2 − z |
8.685 |
−1.5 |
−0.2 |
−6.5 |
0.9 |
−7.3 |
C9A–H9A⋯C8A |
3.60, 136 |
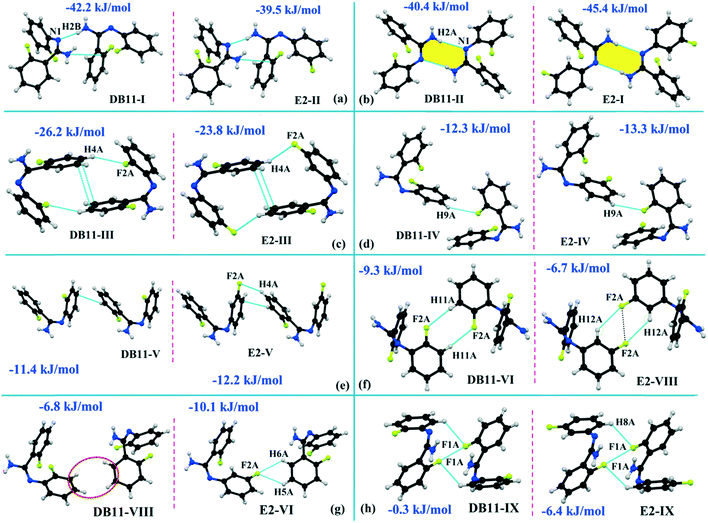 |
| | Fig. 8 The equivalent molecular building blocks (a–h) for the isostructural DB11–E2. | |
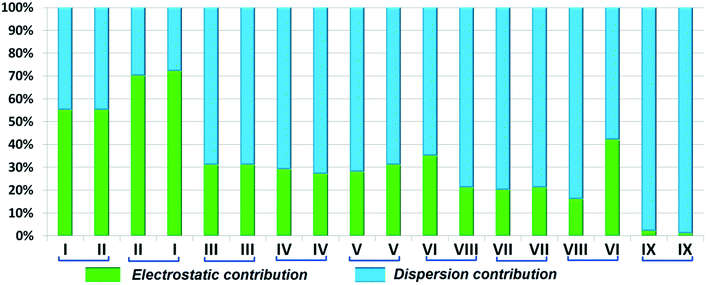 |
| | Fig. 9 Comparison of the percentage energy contribution towards the total stabilization of the equivalent molecular pairs for DB11 and E2. | |
Isostructural DB23–DB33
Both the compounds DB23 (Fig. S5e†) and DB33 (Fig. S5f†) crystallize in the centrosymmetric monoclinic P21/c space group with closely related unit cell parameters having four molecules in the unit cell (Z′ = 1, Z = 4). One fluorine atom is attached at the para position of the phenyl ring (Cg2) in both cases and the other fluorine atom is attached at the meta and para positions of the phenyl ring (Cg1) of DB23 and DB33, respectively (Scheme 2). The molecular arrangements were stabilized via strong N–H⋯N chains (DB23–I and DB33–I; ∼−42 kJ mol−1) associated with the weak C–H⋯N interactions along the c direction [Fig. 10(a) and (b)]. In addition, the weak intermolecular interactions like N–H⋯F, C–H⋯F, C–H⋯π and π⋯π also provide extra stability to the lattice. Table 4 lists the stabilization energy of each motif (extracted from the crystal packing) and the geometry of the interactions. All the equivalent structural motifs responsible for the formation of similar supramolecular architectures in isostructural DB23 and DB33 are shown in Fig. 11. Two parallel N–H⋯N chains were further connected with each other via a C–H⋯π intermolecular interaction (DB23–III and DB33–III) [Fig. 11c], the equivalent motif (DB23–VIII and DB33–V) [Fig. 11g], (DB23–IV and DB33–II) [Fig. 11d] and the occurrence of a “short (2.20 Å) and highly directional (151°)” N–H⋯F dimer (DB23–II and DB33–IV) in the crystalline lattice which is further associated with π⋯π stacking [Fig. 10(a) and (b)]. On viewing down the ab plane the molecules form a zigzag array [Fig. 10(c) and (d)] associated with the molecular chains (involving weak C–H⋯F and C–H⋯π interactions) utilizing the structural building blocks III, IV, VI and VII for DB23 and the motifs II, III, VI and VIII for DB33 which provide additional stability to the crystal packing. From the overall molecular arrangements, considering that all the centroids of the phenyl ring of this array are combined together, leading to the formation of a distorted six-membered ring down the ab plane [Fig. 10(c) and (d)]. The four structurally equivalent molecular motifs (a), (b), (c) and (h) are also energetically equivalent but in the case of (c) (5% more electrostatic contribution for DB33–III) and (h) (17% more electrostatic contribution for DB33–VIII) the energetic contributions are not the same (Fig. 11 and 12). Between DB23–IV (−24.6 kJ mol−1; having π⋯π stacking only) and DB33–II (−29.2 kJ mol−1; associated with π⋯π stacking and C–H⋯F interaction) the electrostatic contribution is 8% more for DB33–II in comparison to the former (Fig. 11d). The centrosymmetric C–H⋯F dimeric motif DB23–V (−10.0 kJ mol−1) is structurally (Fig. 11e) but not energetically equivalent to DB33–IX (−4.2 kJ mol−1) having only a type I F⋯F contact with a distance of 2.984 (2) Å and subsequently the dispersion contribution is 36% more (Fig. 12) for DB33–IX.
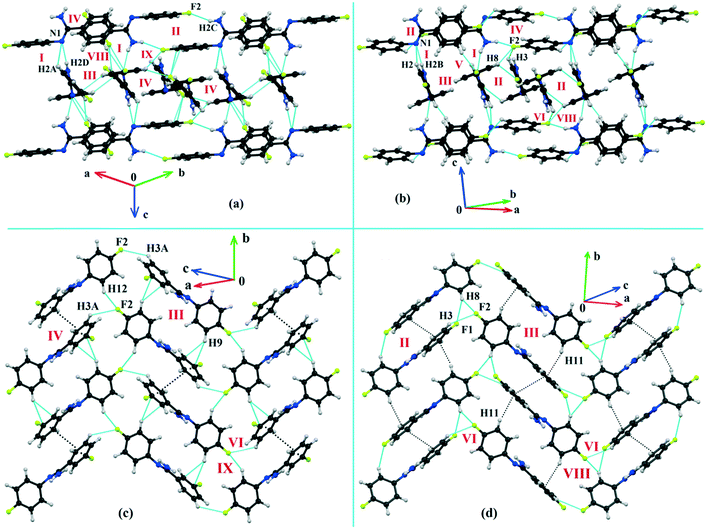 |
| | Fig. 10 The molecular arrangement of the isostructural compounds DB23 [(a) and (c)] and DB33 [(b) and (d)]. | |
Table 4 The stabilization energy (in kJ mol−1) of the molecular pairs for the isostructural molecules DB23 and DB33 [D = the centroid–centroid distance between two interacting molecules]
| Motifs |
Symmetry code |
D (Å) |
E
Coul
|
E
Pol
|
E
Disp
|
E
Rep
|
E
Tot
|
Possible interactions |
Geometry (Å/°) |
|
DB23
|
| I |
x, 0.5 − y, 0.5 + z |
5.272 |
−33.5 |
−15.1 |
−29.9 |
39.0 |
−39.5 |
N2–H2D⋯N1 |
2.05, 160 |
| C2A–H2A⋯N1 |
2.70, 133 |
| II |
−1 − x, 1 − y, 1 − z |
9.198 |
−17.9 |
−5.2 |
−25.2 |
20.9 |
−27.3 |
N2–H2C⋯F2 |
2.19, 156 |
| C10(π)⋯C10(π) |
3.367(2) |
| III |
−x, 1 − y, 1 − z |
5.138 |
−8.7 |
−3.9 |
−33.7 |
21.6 |
−24.7 |
C9–H9⋯π(C5A–C6A) |
3.03, 158 |
| IV |
−x, −y, 1 − z |
7.111 |
−7.3 |
−3.0 |
−30.3 |
16.1 |
−24.6 |
C2A⋯Cg1 |
3.550(2) |
| V |
1 − x, −y, 1 − z |
13.130 |
−5.5 |
−0.9 |
−6.5 |
3.0 |
−10.0 |
C4A–H4A⋯F1A |
2.63, 177 |
| VI |
1 + x, 0.5 − y, 0.5 + z |
10.541 |
−4.1 |
−1.2 |
−11.3 |
6.8 |
−9.9 |
C3A–H3A⋯F2 |
2.74, 116 |
| VII |
1 + x, y, z |
9.488 |
−1.4 |
−0.8 |
−7.5 |
3.6 |
−6.0 |
C12–H12⋯F1A |
2.57, 122 |
| VIII |
−x, 0.5 + y, 0.5 − z |
7.419 |
−1.6 |
−1.2 |
−10.6 |
7.5 |
−5.9 |
F1A⋯π(C9–C10) |
2.944(2) |
| IX |
−1 − x, 0.5 + y, 0.5 − z |
10.322 |
−1.2 |
−0.7 |
−5.2 |
2.7 |
−4.4 |
C12–H12⋯F2 |
2.52, 138 |
|
DB33
|
| I |
x, 0.5 − y, 0.5 + z |
5.230 |
−38.1 |
−17.0 |
−32.9 |
44.2 |
−43.8 |
N2–H2B⋯N1 |
2.09, 151 |
| C2–H2⋯N1 |
2.46, 162 |
| II |
1 − x, 1 − y, 2 − z |
6.440 |
−10.2 |
−4.3 |
−43.2 |
28.4 |
−29.2 |
C8–H8⋯F1 |
2.56, 128 |
| Cg1⋯Cg1 |
3.738(2) |
| III |
1 − x, −y, 2 − z |
5.131 |
−12.7 |
−5.7 |
−40.0 |
30.5 |
−27.9 |
C11–H11⋯Cg1 |
2.81, 152 |
| IV |
−x, −y, 2 − z |
9.303 |
−17.9 |
−5.8 |
−27.2 |
24.9 |
−26.0 |
N2–H2A⋯F2 |
2.20, 151 |
| π(C10)⋯π(C10) |
3.261(2) |
| V |
1 − x, −0.5 + y, 1.5 − z |
7.313 |
−5.1 |
−3.2 |
−16.6 |
13.9 |
−11.0 |
C5–H5⋯Cg2 |
2.61, 143 |
| VI |
1 + x, 0.5 − y, 0.5 + z |
10.644 |
−2.1 |
−1.3 |
−10.7 |
5.9 |
−8.2 |
C3–H3⋯F2 |
2.70, 135 |
| VII |
1 − x, 0.5 + y, 2.5 − z |
8.192 |
1.0 |
−1.8 |
−8.9 |
4.3 |
−5.4 |
Dipole⋯dipole interaction |
— |
| VIII |
−x, 0.5 + y, 1.5 − z |
10.280 |
−4.1 |
−1.6 |
−6.8 |
7.5 |
−5.0 |
C8–H8⋯F2 |
2.27, 146 |
| IX |
2 − x, 1 − y, 2 − z |
13.007 |
−0.6 |
−0.3 |
−4.7 |
1.4 |
−4.2 |
F1⋯F1 |
2.984(1) |
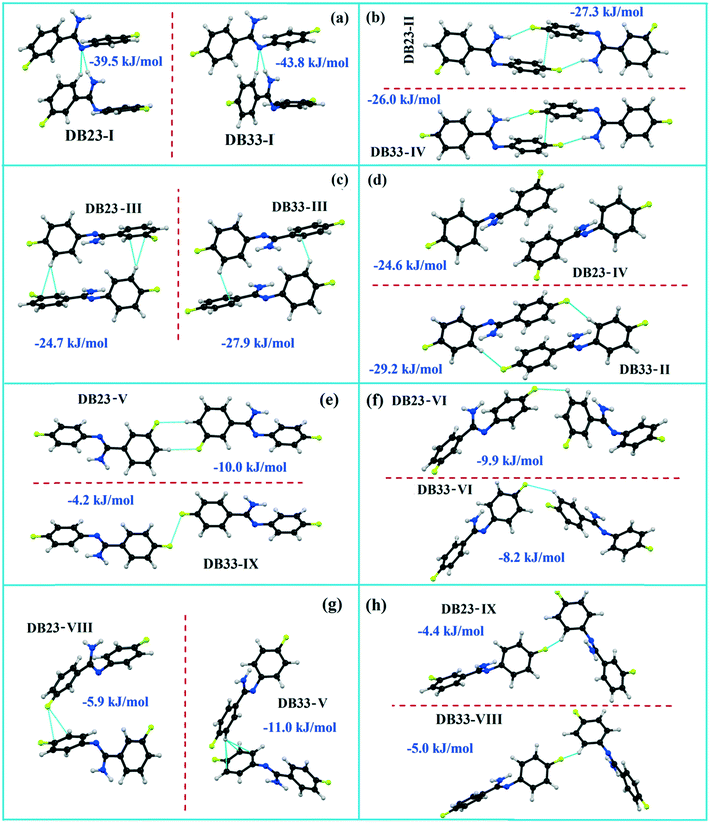 |
| | Fig. 11 The equivalent molecular building blocks (a–h) for the isostructural compounds DB23–DB33. | |
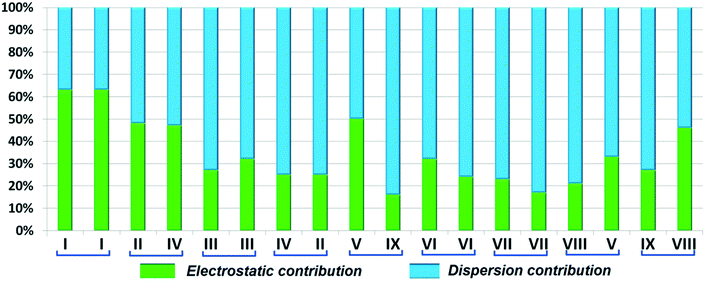 |
| | Fig. 12 Comparison of the percentage energy contribution towards total stabilization for the equivalent molecular pairs (DB23 and DB33). | |
Energy vector model
The energy vector models (magenta color) for DB10–E1 and DB11–E2 are shown in Fig. 13 and 14, respectively. The Coulombic (yellow color) and dispersion (green color) components were also scaled against the interaction energy of the most stabilizing molecular pair. In the case of DB10−E1, there is a formation of a zigzag continuous line (magenta colored) between the two interacting fragments I (∼−42 kJ mol−1), whereas for the other interacting fragments, a discontinuous magenta colored line with a smaller gap (relatively more stabilizing) and a higher gap (relatively less stabilizing) appeared in both cases. Table S3† shows the energy vector lengths of some selected equivalent molecular pairs for the isostructural molecules. In the case of DB11, there is a continuous magenta colored line between the two interacting fragments I (−42.2 kJ mol−1) and II (−40.4 kJ mol−1) for DB11; I (−45.4 kJ mol−1) and II (−39.5 kJ mol−1) for E2 having a comparable stabilization energy. Here, a discontinuous magenta colored line with a smaller gap and a higher gap is also observed for the other building blocks. The vector lengths (yellow color) for the coulombic component in molecular pairs I and II are longer than those of motif III whereas the vector lengths (green color) for the dispersion component in the molecular pair I and III are longer than those of motif III (Fig. 14a). In the case of E2 (Fig. 14b), a similar feature was observed. Energy vector models for DB23–DB33 are shown in Fig. S7.† In both cases, the strong N–H⋯N chain (I: more stabilizing) along the c axis leading to the formation of wave-like (magenta colored) columnar architectures is shown. Discontinuous lines (magenta colored) with less gap or higher gap were observed for other slightly less (II, III, IV) or more stabilizing molecular pairs. For DB23, the vector lengths for the Coulombic component (yellow color) in I and II are longer than those for the other motifs (Fig. S7a†), whereas the vector length for the dispersion component (green color) in DB33–II (Fig. S7b†) is longer than those of the other molecular fragments present in both DB23–DB33. Thus, according to the energy vector distribution patterns, DB10 is isostructural with E1, DB11 is isostructural with E2, and DB23 is isostructural with the compound DB33.
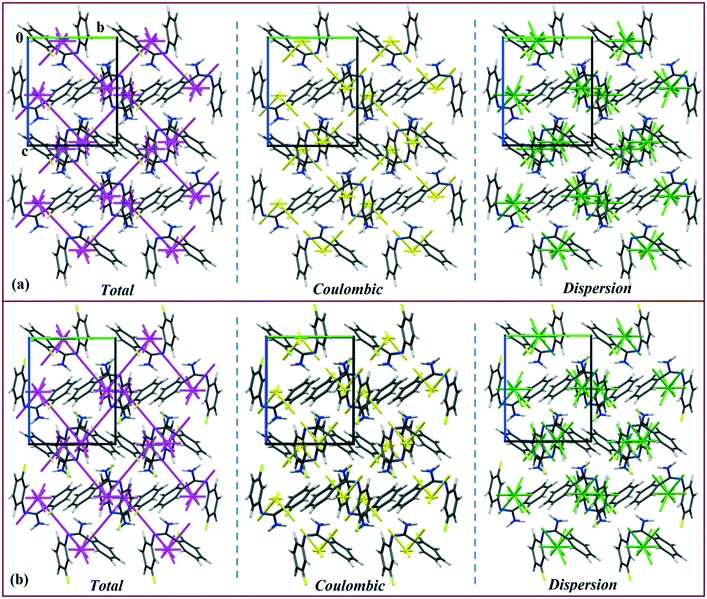 |
| | Fig. 13 Energy vector diagram for the isostructural (a) DB10 and (b) E1 down the bc plane. | |
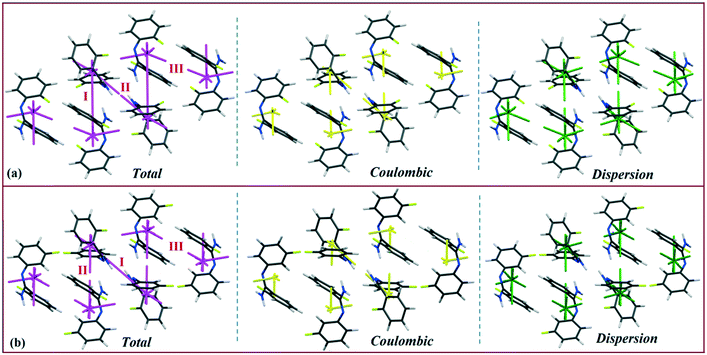 |
| | Fig. 14 Energy vector diagram for the isostructural (a) DB11 (b) E2 down the ab plane. | |
Hirshfeld surface analysis
Hirshfeld surface analysis69 was performed using CrystalExplorer 3.170 to further study the isostructurality behaviour between two sets of isostructural compounds, DB10–E1 (Fig. 15a and b), DB11–E2 (Fig. 15c and d) and DB23–DB33 (Fig. 16), to account for the similarities in the crystal environment. Hirshfeld surface associated fingerprint plots71,72 were analyzed to map the two-dimensional supramolecular blueprint to compare the three sets of isostructural compounds. The fingerprint plots and the relative contribution from the various atom⋯atom contacts are also shown. In the case of DB10–E1 and DB11–E2, it is observed that both the fingerprint plots containing the sharp spikes (blue colored triangles) for the strong N–H⋯N hydrogen bond and the wing regions for the other contacts show the similarity in the packing patterns. Subsequently, the contributions from different atom⋯atom contacts are also comparable due to the closely related supramolecular architectures. The small spikes (green colored triangles) in E2 signify the presence of short C–H⋯F interactions (E2–V) with a distance of 2.40 Å which is not observed in the fingerprint plot of DB10. In case of isostructural compounds DB23 and DB33, two types of sharp spikes were observed. The spikes denoted with blue colored triangle correspond to the strong N–H⋯N hydrogen bonds and the spikes denoted with green colored triangle correspond to the presence of short N–H⋯F interactions. The atom⋯atom contributions for the different contacts are also similar to each other in three sets of isostructural compounds.
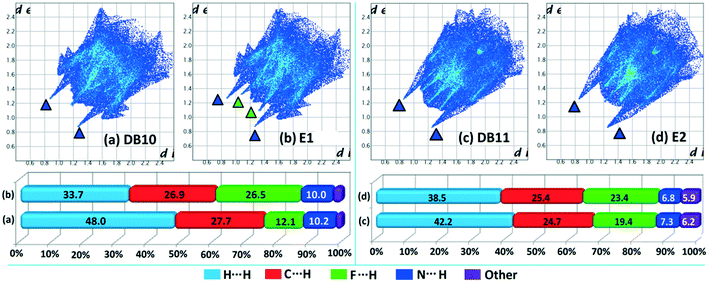 |
| | Fig. 15 The fingerprint plots and associated relative contribution of different atom⋯atom contacts in the crystal packing of isostructural compounds [(a) DB10 and (b) E1; (c) DB11 and (d) E2]. | |
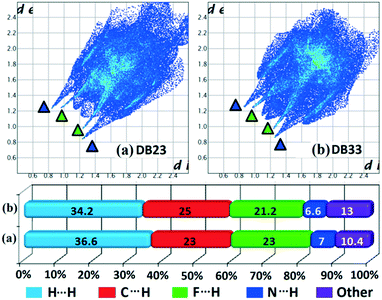 |
| | Fig. 16 The fingerprint plots and associated relative contribution of different atom⋯atom contacts in the crystal packing of isostructural compounds [(a) DB23 and (b) DB33]. | |
To obtain quantitative insights into the nature of various non-covalent interactions, QTAIM analysis was performed. In the ESI,† the molecular graphs for some selected building blocks (Fig. S8–S11†) for DB10, DB11, DB23 and DB33 are shown, where the bond critical points (3, −1) for the N–H⋯N, N–H⋯F, N–H⋯π, C–H⋯F, C–H⋯C, F⋯F interactions were obtained. The topological parameters [the electron density (ρBCP), the Laplacian (∇2ρBCP), local potential energy (Vb), kinetic energy density (Gb) and the dissociation energy DEV(int) (= −0.5Vb)] for these BCPs are shown in Table S4.† The positive Laplacian values signify the closed shell interaction between the atoms. For the equivalent molecular motifs, the topological parameters are comparable. The electron density and the Laplacian value at the BCP for the intermolecular N–H⋯π interaction (DB10) are 0.0634 e Å−3 and 0.726 e Å−5, respectively, which are comparable to the previously reported48 values for E1. In the case of equivalent molecular pairs (f) (C–H⋯F dimer), for the isostructural DB11–E2, the molecular graphs are shown in Fig. 17. For DB11–VI, there is only one (3, +1) ring critical point whereas in E2–VIII there are two ring critical points due to the formation of a F⋯F contact. The electron density value at the BCP for the C–H⋯F interaction is observed to be 0.0475 e Å−3 for DB11–VI and 0.0316 e Å−3 for E2–VIII and the magnitude of the Laplacian is observed to be 0.723 e Å−5 for DB11–VI and 0.527 e Å−5 for E2–VIII. The corresponding bond dissociation energies are 6.7 kJ mol−1 and 4.1 kJ mol−1 for DB11–VI and E2–VIII, respectively. To get more insights into the nature of the C–H⋯F dimer, NCI (non-covalent index)73,74 analysis was performed using the program NCImilano.75,76 It is a graphical visualization of the regions where the non-covalent interactions take place.77 The reduced density gradient (RDG) comes from the electron density (ρ) and its first derivative (gradient of the electron density):
| |  | (2) |
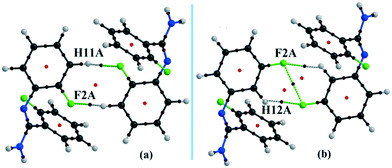 |
| | Fig. 17 Molecular graphs for the equivalent molecular pairs (a) DB11–VI and (b) E2–VIII associated with the C–H⋯F dimer [red color and deep red color depict the ring critical point and the bond critical point respectively]. | |
The reduced density gradient isosurface was generated at 0.6 (s) and plotted using MoleCoolQt78 software. The NCI based RDG isosurface was plotted with the color range −0.03 < ρ × sign (λ2) < 0.03 au around the ring critical points and the bond critical points for the C–H⋯F dimeric motif in real space (Fig. S12†). RDG isosurface is based on the three components of the electron density distribution: electron density (ρ), reduced density gradient (RDG) and the gradient of the electron density (∇ρ). The sign of the second Hessian matrix indicates whether the intermolecular C–H⋯F is stabilized (λ2 < 0) or destabilized (λ2 > 0). In the case of DB11–VI, the RDG isosurface is light green colored (disc-shaped) having a negative eigenvalue (λ2 < 0) around the BCP and shows the attractive nature of the C–H⋯F interaction. The 2D plots associated with the RDG vs. ρ × sign (λ2) indicate a sharp spike in the negative region corresponding to the BCP and another sharp spike (for the dumb-bell shaped dodger blue RDG isosurface) in the positive region corresponding to the ring critical point. But in the case of E2–VIII, there is a total of three light sky blue RDG isosurfaces, i.e., two disc-shaped which correspond to the BCP for the C–H⋯F interaction and the third one (dispersive nature) corresponds to the BCP for the F⋯F contact. Here the value of ρ × sign (λ2) is less negative compared to the value for the C–H⋯F present in DB11–VI. In addition, there is a total of two dodger blue RDG isosurface regions which correspond to the two ring critical points in E2–VIII.
In the occurrence of the isostructurality for DB23–DB33, the intermolecular N–H⋯F interaction plays an important role in the presence of a strong N–H⋯N chain. This interaction is rarely observed in the formation of organic solids, containing the N–H or NH2 functional group along with the C–F bond. Here, there is a formation of a centrosymmetric dimer utilizing the short and highly directional N–H⋯F interaction. Cambridge Structural Database79 (CSD: version 5.37) search has been performed taking the different constraints: dH⋯F = 2.0 to 2.3 Å, ∠N–H⋯F = 140 to 180°, R factor ≤ 0.1, not disordered, not polymeric, no errors, no ions, no powder structures, and only organic compounds. A CSD study reveals that the total number of hits is 19 for the compounds having the NH2 group (Fig. S13 and S14†). The NCI-based RDG isosurface for the N–H⋯F interaction also shows a green colored disc (Fig. 18) with a highly negative value (∼−0.0105 au) of ρ × sign (λ2) which indicates the attractive (stabilized) nature of this type of interaction. Furthermore, the NCI analysis of the N–H⋯π (DB10) interaction gives some interesting information about the nature of this interaction. It shows that there is formation of a “funnel-like” RDG isosurface (Fig. 19) in which the inside surface color of the funnel is green (stabilized interaction), and the outside surface color is light blue (destabilized). In addition, there is also one small light blue colored (destabilized) region around the bond critical point. The pink colored RDG isosurface (vertical spike) formed around the ring critical point inside the phenyl ring indicates the more destabilized interaction.
 |
| | Fig. 18 RDG isosurface (s = 0.6) for the intermolecular N–H⋯F interaction and the plot of reduced density gradient (RDG) versus electron density multiplied by the sign of the second Hessian eigenvalue [ρ × sign (λ2)] and electron density (ρ). | |
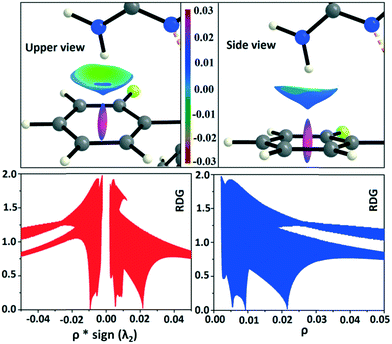 |
| | Fig. 19 RDG isosurface (s = 0.6) for intermolecular N–H⋯π interaction (DB10–I) and the plot of reduced density gradient (RDG) versus electron density multiplied by the sign of the second Hessian eigenvalue [ρ × sign (λ2)] and electron density (ρ). | |
Summary
In this study, the crystal structures of fluorine containing molecules, existing as E–Z isomers, are found to exhibit isostructurality, having equivalent supramolecular building blocks. Thus, the substitution at the fluorine atom on the phenyl ring is responsible for the observed isostructurality in isomeric fluorinated phenyl benzamidine compounds. Most of the structurally equivalent motifs present in the crystal packing are isoenergetic and the contribution of electrostatic and dispersion interactions is comparable in these compounds. The structural similarity analysis supports quantitatively the existence of isostructurality, and the NCI analysis establishes the N–H⋯F and N–H⋯π interactions to be “attractive” in nature. The energy distribution patterns for the energy vector models are similar in both sets of isostructural compounds. The Hirshfeld surface analysis also helps to verify the behaviour of isostructurality in terms of fingerprint plots associated with various non-covalent interactions in the crystal. This study once again illustrates the significance of weak and rare intermolecular interactions in the solid state and hence depict the pivotal point that the study and investigation of interactions in molecular crystals is an important exercise. This has special relevance and significance in the design of crystals with desired properties with implications in polymorphism, cocrystal formation, and the development of technologically important materials.
Acknowledgements
D. D. thanks IISER Bhopal for the research fellowship. D. C. and D. D. thank IISER Bhopal for the use of the research facilities and infrastructure, and SERB for research funding.
References
- G. Bolla, S. Mittapalli and A. Nangia, IUCrJ, 2015, 2, 389–401 CAS.
- T. Steiner, Angew. Chem., Int. Ed., 2002, 41, 48–76 CrossRef CAS.
- J. M. Pollino and M. Weck, Chem. Soc. Rev., 2005, 34, 193–207 RSC.
-
G. R. Desiraju, Crystal Engineering: the Design of Organic Solids, Amsterdam, Elsevier, 1989 Search PubMed.
- IUCr, http://reference.iucr.org/dictionary/Isostructural_crystals, Accessed 18/11/2014.
- D. Dey, S. P. Thomas, M. A. Spackman and D. Chopra, Chem. Commun., 2016, 52, 2141–2144 RSC.
- K. Dziubek, M. Podsiadlo and A. Andrzej, J. Am. Chem. Soc., 2007, 129, 12620–12621 CrossRef CAS PubMed.
- L. Fabian and A. Kalman, Acta Crystallogr., Sect. B: Struct. Sci., Cryst. Eng. Mater., 2004, 60, 547–558 CrossRef PubMed.
- T. Gelbrich, D. S. Hughes, M. B. Hursthouse and T. L. Threlfall, CrystEngComm, 2008, 10, 1328–1334 RSC.
- N. K. Nath, B. K. Saha and A. Nangia, New J. Chem., 2008, 32, 1693–1701 RSC.
- R. Thakuria, N. K. Nath, S. Roy and A. Nangia, CrystEngComm, 2014, 16, 4681–4690 RSC.
- M. C. Pfrunder, A. S. Micallef, L. Rintoul, D. P. Arnold, K. J. P. Davy and J. McMurtrie, Cryst. Growth Des., 2014, 14, 6041–6047 CAS.
- D. Cincic, T. Friscic and W. Jones, New J. Chem., 2008, 32, 1776–1781 RSC.
- T. Hosokawa, S. Datta, A. R. Sheth, N. R. Brooks, V. G. Young and D. J. W. Grant, Cryst. Growth Des., 2004, 4, 1195–1201 CAS.
- S. L. Childs, L. J. Chyall, J. T. Dunlap, V. N. Smolenskaya, B. C. Stahly and G. P. Stahly, J. Am. Chem. Soc., 2004, 126, 13335–13342 CrossRef CAS PubMed.
- A. V. Trask, D. A. Haynes, W. D. S. Motherwell and W. Jones, Chem. Commun., 2006, 51–53 RSC.
- A. V. Trask and W. Jones, Top. Curr. Chem., 2005, 254, 41–70 CAS.
- A. V. Trask, W. D. S. Motherwell and W. Jones, Chem. Commun., 2004, 890–891 RSC.
- A. V. Trask, W. D. S. Motherwell and W. Jones, Cryst. Growth Des., 2005, 5, 1013–1021 CAS.
- A. V. Trask, W. D. S. Motherwell and W. Jones, Int. J. Pharm., 2006, 320, 114–123 CrossRef CAS PubMed.
- S. Ebenezer, P. T. Muthiah and R. J. Butcher, Cryst. Growth Des., 2011, 11, 3579–3592 CAS.
- C. Capacci-Daniel, S. Dehghan, V. M. Wurster, J. A. Basile, R. Hiremath, A. A. Sarjeantb and J. A. Swift, CrystEngComm, 2008, 10, 1875–1880 RSC.
- T. Gelbrich, T. L. Threlfall and M. B. Hursthouse, CrystEngComm, 2012, 14, 5454–5464 RSC.
- S. J. Coles, T. L. Threlfall and G. J. Tizzard, Cryst. Growth Des., 2014, 14, 1623 CAS.
- A. Kalman, S. Parkanyi and G. Argay, Acta Crystallogr., Sect. B: Struct. Sci., 1993, 49, 1039–1049 CrossRef.
- W. Szczepankiewicz, J. Suwinski and Z. Karczmarzyk, Chem. Heterocycl. Compd., 2004, 40, 801 CrossRef CAS.
- A. Schmidpeter, R. K. Bansal, K. Karaghiosoff, F. Steinmuller and C. Spindler, Phosphorus, Sulfur Silicon Relat. Elem., 1990, 49/50, 349 CrossRef.
- L. Capuano, W. Fischer, H. Scheidt and M. Schneider, Chem. Ber., 1978, 111, 2497 CrossRef CAS.
- Y. G. Shermolovich, V. S. Talanov, V. V. Pirozhenko and L. N. Markovskii, Russ. J. Org. Chem., 1982, 18, 2240 Search PubMed.
- T. Asano, T. Yoshikawa, H. Nakamura, Y. Uehara and Y. Yamamoto, Bioorg. Med. Chem. Lett., 2004, 14, 2299–2302 CrossRef CAS PubMed.
- T. Asano, T. Yoshikawa, T. Usui, H. Yamamoto, Y. Yamamoto, Y. Uehara and H. Nakamura, Bioorg. Med. Chem., 2004, 12, 3529–3542 CrossRef CAS PubMed.
- H. Nakamura, Y. Sasaki, M. Uno, T. Yoshikawa, T. Asano, H. S. Ban, H. Fu-kazawa, M. Shibuya and Y. Uehara, Bioorg. Med. Chem. Lett., 2006, 16, 5127–5131 CrossRef CAS PubMed.
- P. A. Koutentis and S. I. Mirallai, Tetrahedron, 2010, 66, 5134–5139 CrossRef CAS.
-
I. Ojima, Fluorine in Medicinal Chemistry and Chemical Biology, Wiley- Blackwell, Chichester, West Sussex, PO19 8SQ, UK, 2009 Search PubMed.
- V. Gouverneur and K. Seppelt, Chem. Rev., 2015, 115, 563–565 CrossRef CAS PubMed.
- C. Isanbor and D. O'Hagan, J. Fluorine Chem., 2006, 127, 303–319 CrossRef CAS.
- I. Ojima, J. Org. Chem., 2013, 78, 6358–6383 CrossRef CAS PubMed.
- P. Panini and D. Chopra, Cryst. Growth Des., 2014, 14, 3155–3168 CAS.
-
Apex2, Version 2 User Manual, M86-E01078, Bruker Analytical X-ray Systems, Madison, WI, 2006 Search PubMed.
-
Siemens, SMART System, Siemens Analytical X-ray Instruments Inc., Madison, MI, 1995 Search PubMed.
- A. Altomare, M. C. Burla, G. Camalli, G. Cascarano, C. Giacovazzo, A. Gualiardi and G. Polidori, J. Appl. Crystallogr., 1994, 27, 435–436 Search PubMed.
-
G. M. Sheldrick, SADABS, Bruker AXS, Inc., Madison, WI, 2007 Search PubMed.
- L. J. Farrugia, J. Appl. Crystallogr., 1999, 32, 837–838 CrossRef CAS.
- G. M. Sheldrick, Acta Crystallogr., Sect. A: Found. Crystallogr., 2008, 64, 112–122 CrossRef CAS PubMed.
- C. F. Macrae, I. J. Bruno, J. A. Chisholm, P. R. Edgington, P. McCabe, E. Pidcock, L. Rodriguez-Monge, R. Taylor, J. Streek and P. A. Wood, J. Appl. Crystallogr., 2008, 41, 466–470 CrossRef CAS.
- M. Nardelli, J. Appl. Crystallogr., 1995, 28, 659 CrossRef CAS.
- A. L. Spek, Acta Crystallogr., Sect. D: Biol. Crystallogr., 2009, 65, 148–155 CrossRef CAS PubMed.
- D. Dey and D. Chopra, CrystEngComm, 2015, 17, 5288–5298 RSC.
- T. Gelbrich and M. B. Hursthouse, CrystEngComm, 2006, 8, 448–460 RSC.
- F. P. A. Fabbiani, B. Dittrich, A. J. Florence, T. Gelbrich, M. B. Hursthouse, W. F. Kuhs, N. Shankland and H. Sowa, CrystEngComm, 2009, 11, 1396–1406 RSC.
- J. D. Dunitz and A. Gavezzotti, Cryst. Growth Des., 2012, 12, 5873–5877 CAS.
- J. D. Dunitz and A. Gavezzotti, Chem. Soc. Rev., 2009, 38, 2622–2633 RSC.
- J. D. Dunitz and A. Gavezzotti, Angew. Chem., Int. Ed., 2005, 44, 1766–1787 CrossRef CAS PubMed.
- A. Gavezzotti, CrystEngComm, 2003, 5, 429–438 RSC.
- L. Maschio, B. Civalleri, P. Ugliengo and A. Gavezzotti, J. Phys. Chem. A, 2011, 115, 11179–11186 CrossRef CAS PubMed.
- J. D. Dunitz and A. Gavezzotti, Cryst. Growth Des., 2005, 5, 2180–2189 CAS.
- L. Carlucci and A. Gavezzotti, Chem. – Eur. J., 2005, 11, 271–279 CrossRef PubMed.
-
M. J. Frisch, G. W. Trucks, H. B. Schlegel, G. E. Scuseria, M. A. Robb, J. R. Cheeseman, G. Scalmani, V. Barone, B. Mennucci, G. A. Petersson, H. Nakatsuji, M. Caricato, X. Li, H. P. Hratchian, A. F. Izmaylov, J. Bloino, G. Zheng, J. L. Sonnenberg, M. Hada, M. Ehara, K. Toyota, R. Fukuda, J. M. HasegawaIshida, T. Nakajima, Y. Honda, O. Kitao, H. Nakai, T. Vreven, J. A. Montgomery Jr., J. E. Peralta, F. Ogliaro, M. Bearpark, J. J. Heyd, E. Brothers, K. N. Kudin, V. N. Staroverov, R. Kobayashi, J. Normand, K. Raghavachari, A. Rendell, J. C. Burant, S. S. Iyengar, J. Tomasi, M. Cossi, N. Rega, J. M. Millam, M. Klene, J. E. Knox, J. B. Cross, V. Bakken, C. Adamo, J. Jaramillo, R. Gomperts, R. E. Stratmann, O. Yazyev, A. J. Austin, R. Cammi, C. Pomelli, J. W. Ochterski, R. L. Martin, K. Morokuma, V. G. Zakrzewski, G. A. Voth, P. Salvador, J. J. Dannenberg, S. Dapprich, A. D. Daniels, Ö. Farkas, J. B. Foresman, J. V. Ortiz, J. Cioslowski and D. J. Fox, Gaussian 09, Revision D.01, Gaussian, Inc., Wallingford, CT, 2009 Search PubMed.
- O. V. Shishkin, V. V. Dyakonenko, A. V. Maleev, D. Schollmeyer and M. O. Vysotsky, CrystEngComm, 2011, 13, 800–805 RSC.
- O. V. Shishkin, V. V. Medvediev, R. I. Zubatyuk, O. O. Shyshkina, N. V. Kovalenko and J. M. Volovenko, CrystEngComm, 2012, 14, 8698–8707 RSC.
- O. V. Shishkin, V. V. Medvedieva and R. I. Zubatyuka, CrystEngComm, 2013, 15, 160–167 RSC.
- A. D. Bond, J. Appl. Crystallogr., 2014, 47, 1777–1780 CAS.
- O. V. Shishkin, V. V. Dyakonenko and A. V. Maleev, CrystEngComm, 2012, 14, 1795–1804 RSC.
-
R. F. W. Bader, Atoms in Molecules: A Quantum Theory, Oxford University Press, Oxford, U.K., 1990 Search PubMed.
-
V. G. Tsirelson, The Quantum Theory of Atoms in Molecules: From Solid State to DNA and Drug Design, ed. C. Matta and R. Boyd, Wiley-VCH, Weinheim, Germany, 2007, ch. 10, p. 45 Search PubMed.
-
T. A. Keith, AIMALL, version 13.05.06, TK Gristmill Software, Overland Park KS, 2013, aim.tkgristmill.com Search PubMed.
- I. Mata, I. Alkorta, E. Espinosa and E. Molins, Chem. Phys. Lett., 2011, 507, 185–189 CrossRef CAS.
- E. Espinosa, E. Molins and C. Lecomte, Chem. Phys. Lett., 1998, 285, 170–173 CrossRef CAS.
- M. A. Spackman and D. Jayatilaka, CrystEngComm, 2009, 11, 19–32 RSC.
-
S. K. Wolff, D. J. Grimwood, J. J. McKinnon, M. J. Turner, D. Jayatilaka and M. A. Spackman, CrystalExplorer, Version 3.1, University of Western Australia, Crawley, Australia, 2012 Search PubMed.
- M. A. Spackman and J. J. Mckinnon, CrystEngComm, 2002, 4, 378–392 RSC.
- J. J. Mckinnon, D. Jayatilaka and M. A. Spackman, Chem. Commun., 2007, 3814–3816 RSC.
- E. R. Johnson, S. Keinan, P. Mori-Sanchez, J. Contreras-Garcia, A. J. Cohen and W. Yang, J. Am. Chem. Soc., 2010, 132, 6498–6506 CrossRef CAS PubMed.
- J. Contreras-Garcia, E. R. Johnson, S. Keinan, R. Chaudret, J.-P. Piquemal, D. N. Beratan and W. Yang, J. Chem. Theory Comput., 2011, 7, 625–632 CrossRef CAS PubMed.
- G. Saleh, L. L. Presti, C. Gatti and D. Ceresoli, J. Appl. Crystallogr., 2013, 46, 1513–1517 CAS.
- G. Saleh, C. Gatti, L. L. Presti and J. Contreras-Garc, Chem. – Eur. J., 2012, 18, 15523–15536 CrossRef CAS PubMed.
- M. P. Johansson and M. Swart, Phys. Chem. Chem. Phys., 2013, 15, 11543–11553 RSC.
- C. B. Hubschle and B. Dittrich, J. Appl. Crystallogr., 2011, 44, 238–240 CrossRef PubMed.
- F. H. Allen, Acta Crystallogr., Sect. B: Struct. Sci., 2002, 58, 380–388 CrossRef.
|
| This journal is © The Royal Society of Chemistry 2017 |
Click here to see how this site uses Cookies. View our privacy policy here.  Open Access Article
![[thin space (1/6-em)]](https://www.rsc.org/images/entities/char_2009.gif) :
:![[thin space (1/6-em)]](https://www.rsc.org/images/entities/char_2009.gif) 1) solvent using a layering method at 5 °C. The crystal of DB33 was obtained from toluene solvent at 25 °C. The single crystal diffraction data were collected on a Bruker APEX II diffractometer equipped with a CCD area detector using monochromated Mo Kα radiation using Bruker Apex II software.39 The frames were integrated by using the Bruker SAINT40 suite of programs. The crystal structures were solved by direct methods using the SIR 92 program.41 The data were corrected for absorption effects using SADABS.42 The structures were refined by the full matrix least squares method using SHELXL 201443 present in the program suite WinGX (version 2014.1).44 The non-hydrogen atoms were refined anisotropically and the hydrogen atoms bonded to C and N atoms were positioned geometrically and refined using a riding model with Uiso(H) = 1.2Ueq (C, N). The crystal packing diagrams were generated using the Mercury 3.5.1 (CCDC) program.45 Geometrical calculations were done using the programs PARST46 and PLATON.47Table 1 lists the details of the structure refinement for the four new crystal structures.
1) solvent using a layering method at 5 °C. The crystal of DB33 was obtained from toluene solvent at 25 °C. The single crystal diffraction data were collected on a Bruker APEX II diffractometer equipped with a CCD area detector using monochromated Mo Kα radiation using Bruker Apex II software.39 The frames were integrated by using the Bruker SAINT40 suite of programs. The crystal structures were solved by direct methods using the SIR 92 program.41 The data were corrected for absorption effects using SADABS.42 The structures were refined by the full matrix least squares method using SHELXL 201443 present in the program suite WinGX (version 2014.1).44 The non-hydrogen atoms were refined anisotropically and the hydrogen atoms bonded to C and N atoms were positioned geometrically and refined using a riding model with Uiso(H) = 1.2Ueq (C, N). The crystal packing diagrams were generated using the Mercury 3.5.1 (CCDC) program.45 Geometrical calculations were done using the programs PARST46 and PLATON.47Table 1 lists the details of the structure refinement for the four new crystal structures.
![[thin space (1/6-em)]](https://www.rsc.org/images/entities/char_2009.gif) 982
982![[thin space (1/6-em)]](https://www.rsc.org/images/entities/char_2009.gif) 067
067


