Acceleration of the crystal growth rate of low molecular weight organic compounds in supercooled liquids in the presence of polyhydroxybutyrate
Takafumi
Sato
ab and
Lynne S.
Taylor
*a
aDepartment of Industrial and Physical Pharmacy, College of Pharmacy, Purdue University, West Lafayette, Indiana 47907, USA
bProduction Division, CMC R&D Center, Kyowa Hakko Kirin Co., Ltd., 1188 Shimotogari, Nagaizumi-cho, Sunto-gun, Shizuoka 411-8731, Japan. E-mail: lstaylor@purdue.edu; Fax: +765 494 6545; Tel: +765 496 6614
First published on 18th November 2016
Abstract
Modification of the crystallization kinetics of amorphous systems is an important topic, in particular in the area of drug delivery. Herein, we studied the impact of polyhydroxybutyrate (PHB), a biocompatible polymer with a low glass transition temperature (Tg), on crystal growth rates from the supercooled liquid phase of a variety of organic compounds. Low levels of PHB were mixed with the supercooled liquid and growth rates were monitored using optical microscopy at several temperatures above the Tg of the mixture. Growth rates were determined from a plot of crystal size as a function of time. It was found that PHB inhibited the growth of low Tg compounds, while accelerated crystal growth was observed for compounds that had a much higher Tg (>50 °C) than the polymer. The observations were rationalized based on the extent of mobility differences between the crystallizing compound and the polymer. This is the first reported example of a polymer having compound specific inhibitory or accelerator effects on crystal growth.
Introduction
Active pharmaceutical ingredients are often dispersed in a polymer matrix for the purpose of enhancing drug delivery. One area of particular interest is amorphous solid dispersions, where the drug is formulated in an amorphous state by mixing at a molecular level with a pharmaceutically acceptable polymer.1–3 Recent trends of new drug candidates having very low aqueous solubility make amorphous formulations an attractive approach to enhance bioavailability. As the amorphous form is a high energy state, it temporarily exhibits a higher dissolution rate and solubility and thus can enhance the absorption of the drug in vivo.2,4 However, because of its high energy state, it tends to transform to thermodynamically stable crystalline phase and the advantage of the amorphous form is lost.5 Therefore, in order to successfully develop an amorphous formulation, the crystallization of the amorphous compound must be prevented for the shelf life of the product.Typically, polymers are added to the formulation in order to reduce the rate of crystallization. There are numerous examples demonstrating that improved physical stability against drug crystallization can be achieved through the use of polymers.1,6–9 The stabilizing mechanism of polymers in terms of preventing crystallization of the drug is currently poorly understood, although several mechanisms have been suggested to be important. These include increasing the glass transition temperature (Tg) of the dispersion and thus reducing the mobility at the storage temperature,10 acting as a diluent thereby decreasing the chemical potential of the drug, and by forming specific drug–polymer interaction and thus restricting the mobility at a local scale.6,8,11
For oral drug delivery, drugs are typically dispersed in water soluble polymers in order to ensure rapid release of the drug during the gastrointestinal transit time period. However, drugs may also be dispersed with water-insoluble polymers for more sustained drug delivery from implantable formulations. The physical state of the drug in the formulation will be highly dependent on the production method, and approaches such as melt extrusion are likely to lead to an amorphous formulation. PHB (poly-3-hydroxybutyrate) is liner polyester produced by many strains of bacteria.12,13 This polymer is semi-crystalline and has numbers of properties comparable to petroleum based plastics, such as high melting temperature (175 °C) and relatively high tensile strength (30–35 MPa).14 Because of its biodegradability and biocompatibility, PHB has recently attracted interest for medical applications, including as a material for tissue engineering,15,16 target specific therapy for cancer and tuberculosis17,18 and nano or micro beads for drug delivery.19–21 Biodegradable polymers can be loaded with a drug and then used for localized drug delivery whereby the release of the drug can take place over a period of months. As such, the phase behavior of the drug in the matrix is of interest, since changes such as crystallization may impact the release rate. While there have been several studies evaluating the impact of cellulose derivatives and synthetic polymers such as polyvinyl pyrrolidone on the crystal growth rates of organic compounds, PHB does not appear to have been evaluated to date.
In this study, several model drug compounds were mixed with PHB to form amorphous solid dispersions. The crystallization behavior of the compound from the resultant amorphous film was then investigated as a function of temperature. An unexpected acceleration of the compound crystal growth rate was found for some systems. Additional studies were then conducted in order to better understand this phenomenon.
Materials and methods
Acetaminophen (APAP), flutamide (FLU), griseofulvin (GRI), (R)-(−)-3,5-dinitro-N-(1-phenylethyl)benzamide (DPB) and (S)-(−)-2-amino-1,1,3-triphenyl-1-propanol (ATP) were purchased from Sigma-Aldrich (St. Louis, MO, USA). Celecoxib (Cel) was a kind gift from Pfizer Inc. (Groton, CT). Polyhydroxybutyrate (molecular weight 50![[thin space (1/6-em)]](https://www.rsc.org/images/entities/char_2009.gif) 000) was purchased from Advanced Polymer Materials (Montreal, QC, Canada). Poly(vinylacetate) (molecular weight 350
000) was purchased from Advanced Polymer Materials (Montreal, QC, Canada). Poly(vinylacetate) (molecular weight 350![[thin space (1/6-em)]](https://www.rsc.org/images/entities/char_2009.gif) 000) was purchased from Scientific Polymer Products Inc.
000) was purchased from Scientific Polymer Products Inc.
The chemical structures of the compounds and the polymers are given in Fig. 1.
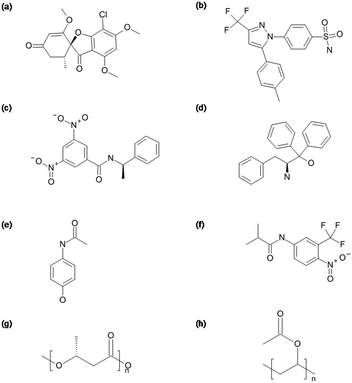 | ||
| Fig. 1 Chemical structures of (a) GRI, (b) CEL, (c) DPB, (d) ATP, (e) APAP, (f) FLU, (g) PHB and (h) PVAc. | ||
Sample preparation
GRI–PHB mixtures were prepared at a 5% and 20% w/w polymer concentration by first mixing 500 mg of powder in a mortar and pestle and then cryomilling for 10 min in a 6750 freezer mill (Spex Sampleprep, Metuchen, New Jersey). The same method was used to prepare blends of PHB with CEL, APAP and FLU and a blend of PVAc with GRI. DPB–PHB mixtures were prepared at 5%, 10%, 20%, and 50% w/w polymer concentration by first dissolving the compound and polymer in a 1![[thin space (1/6-em)]](https://www.rsc.org/images/entities/char_2009.gif) :
:![[thin space (1/6-em)]](https://www.rsc.org/images/entities/char_2009.gif) 1 mixture of dichloromethane and ethanol followed by solvent removal using rotary evaporation. The resultant powder was lightly triturated in a mortar and pestle. ATP–PHB mixtures were prepared using a similar method.
1 mixture of dichloromethane and ethanol followed by solvent removal using rotary evaporation. The resultant powder was lightly triturated in a mortar and pestle. ATP–PHB mixtures were prepared using a similar method.
Growth rate measurements
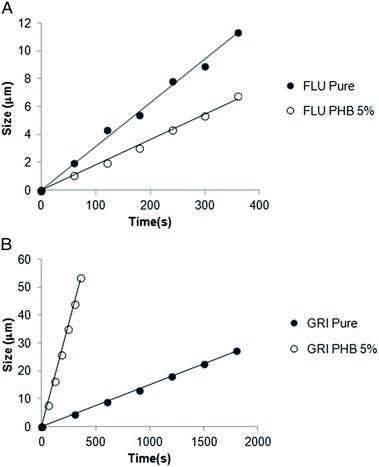
Crystal growth rate measurements were performed by melting approximately 3 mg of sample between two clean coverslips at around 5 °C above melting point of the compound followed by immediate quenching to room temperature to yield a clear film. The samples were confirmed to be noncrystalline by visual observation under cross-polarized light using a microscope (Nikon Eclipse E600 POL microscope, Nikon Corp, Tokyo, Japan). The samples were subsequently heated to and maintained at different temperatures using a hot stage (Linkam THMS 600, Surrey, UK). The growth of the spherulitic crystals (Fig. 2) was recorded by time lapse photography and the growth rate was determined from the slope of the line obtained by plotting the diameter versus time. The change in diameter with time was found to be linear. All growth rates experiments were performed in triplicate. Two crystal morphologies of APAP were observed in the presence of PHB, but only the growth rate for the same morphology as in the absence of polymer is reported.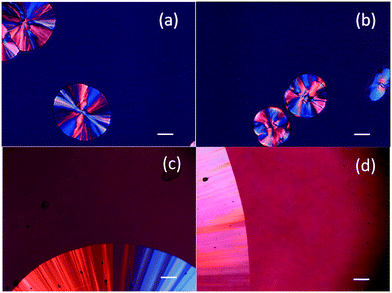 | ||
| Fig. 2 Photomicrographs of FLU without 5% PHB (a) and with 5% PHB (b) at 40 °C and DPB without 5% PHB (c) and with 5% PHB (d) at 100 °C. | ||
Fourier transform infrared (FTIR) spectroscopy
FTIR spectroscopy was performed in transmission mode using a Bio-Rad FTS 6000 (Bio-Rad, Cambridge, MA). The samples were prepared by melting the compound and polymer mixture between a KRS-5 substrate and a glass coverslip, immediately quenching to room temperature followed by removal of the coverslip.The spectra were then obtained by coadding 128 scans over the wavenumber region of 4000–400 cm−1 while maintaining close to 0% RH with a dry air purge.
Thermal analysis
Thermal analysis of the compound and its mixtures was performed using a differential scanning calorimeter (DSC) (TA Q2000, TA Instruments, New Castle, DE, USA) attached to a refrigerated cooling system. Dry nitrogen was used as the purge gas and was maintained at a flow rate of 50 mL min−1. The instrument was calibrated for temperature using indium and tin, and enthalpy was calibrated using indium. The samples were placed in aluminum pans with a pinhole in the lid. Determination of the glass transition temperature (Tg) was performed by cooling the melt at 10 °C min−1 to at least 50 °C below the Tg, and then reheating at 10 °C min−1. The melting temperature was also measured from physical mixtures of the compound and polymer at a heating rate of 10 °C min−1. The onset glass transition temperature and the peak melting temperatures are reported.Results
Growth rate kinetics
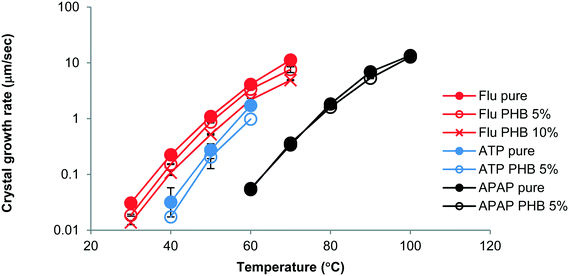
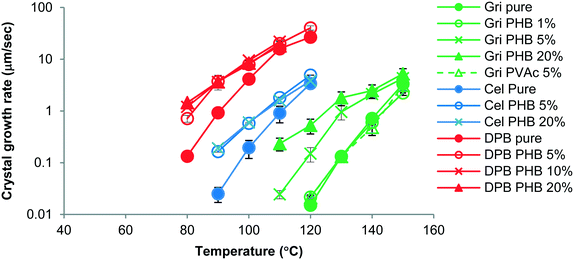
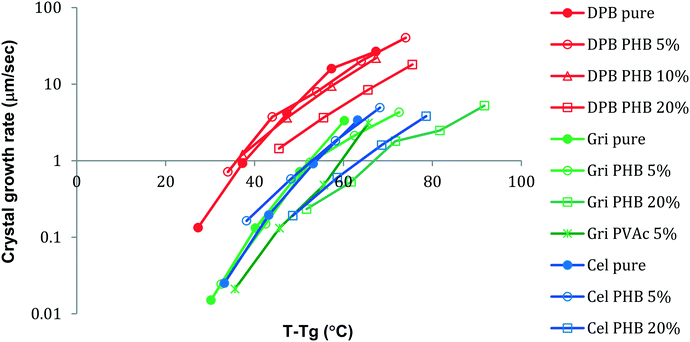
The growth morphology of flutamide and DPB in the presence and absence of 5% PHB is shown in Fig. 2. The compounds crystallized as spherulites with a well-defined interface with the supercooled liquid, both in the presence and absence of the polymer. The crystal growth rates of each compound alone or in the presence of PHB, as a function of temperature, are shown in Fig. 3 and 4. Growth rate experiments were also conducted with another polymer, PVAc. This polymer was selected since it has a low Tg, and is likely to have weak interactions with the compounds. The impact of PHB addition on crystal growth could be separated into two categories: a) little effect or a slight inhibition of growth rate, b) an increase of growth rate. For FLU, APAP and ATP, the growth rate was either delayed in the presence of PHB, or was essentially the same as for the pure compound, depending on PHB concentration. In contrast, GRI, CEL and DPB showed an increase in crystal growth rate in the presence of PHB relative to the compound alone. The inhibitory effect of PHB on FLU and the acceleratory impact on GRI crystal growth rates are shown in Fig. 5A and B respectively. In general, differences in growth rate in the presence and absence of the polymers were greater for growth rate measurements performed at lower temperatures. PVAc had little impact on the crystal growth rate of GRI.Thermal analysis
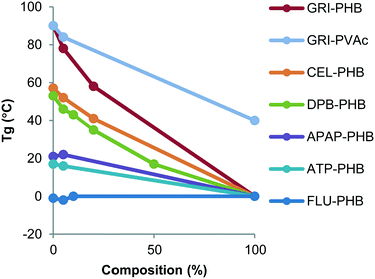
Thermal analysis of each compound, physical mixtures of crystalline drug and the polymer, as well as the dispersions was carried out in order to determine the effect of polymers on the glass transition temperature (Tg) and melting temperature (Tm). The values of Tg and Tm are summarized in Table 1. The Tg of PHB, a partially crystalline polymer, was found to be around 0 °C, while PVac had a Tg of around 40 °C. The Tg of compounds ranged from −0.6 °C (FLU) to 89.8 °C (GRI). The Tgs of the mixtures were dependent on the amount of polymer that was present, being unchanged at low amounts of polymer and decreasing as the mass of polymer increased, with the exception of FLU systems, where the Tg was invariant across all compositions (Fig. 5). The melting point of the various compounds was not influenced to a large extent by the presence of the polymers.| Sample | T g (°C) | T m (°C) |
|---|---|---|
| PHB | 0 | 176 |
| PVAc | 40 | — |
| Pure GRI | 90 | 221 |
| GRI 1% PHB | 85 | 220 |
| GRI 5% PHB | 78 | 221 |
| GRI 20% PHB | 58 | 219 |
| GRI 5% PVAc | 84 | 220 |
| Pure APAP | 21 | 171 |
| APAP 5% PHB | 22 | 170 |
| Pure ATP | 17 | 145 |
| ATP 5% PHB | 16 | 146 |
| Pure DPB | 53 | 161 |
| DPB 5% PHB | 46 | 161 |
| DPB 10% PHB | 43 | 160 |
| DPB 20% PHB | 35 | 160 |
| Pure CEL | 57 | 164 |
| CEL 5% PHB | 52 | 163 |
| CEL 20% PHB | 41 | 160 |
| Pure FLU | −1 | 113 |
| FLU 5% PHB | −2 | 112 |
| FLU 10% PHB | 0 | 112 |
FTIR spectroscopy
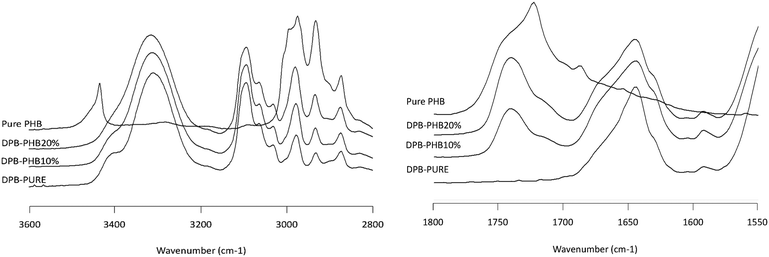
Infrared spectroscopy is a well-established technique for characterizing intermolecular interactions such as hydrogen bonding and has been extensively applied to probe drug–polymer interactions. Fig. 7–10 show the IR spectra of various solid dispersion in the NH stretching region and the C![[double bond, length as m-dash]](https://www.rsc.org/images/entities/char_e001.gif) O stretching region. In the NH stretching region, there was no change in the peak position of the functional groups. In the C
O stretching region. In the NH stretching region, there was no change in the peak position of the functional groups. In the C![[double bond, length as m-dash]](https://www.rsc.org/images/entities/char_e001.gif) O stretching region, the spectrum of the dispersion represents the simple summation of the spectra of the two pure components. From these results, there seems to be no significant drug–polymer interaction in the solid dispersions prepared in this study. However, it was noted that PHB, a semi-crystalline polymer in the pure state, underwent a considerable change in IR spectrum when dispersed with the drugs (Fig. 6), indicating that it was in amorphous form in the presence of the drug.
O stretching region, the spectrum of the dispersion represents the simple summation of the spectra of the two pure components. From these results, there seems to be no significant drug–polymer interaction in the solid dispersions prepared in this study. However, it was noted that PHB, a semi-crystalline polymer in the pure state, underwent a considerable change in IR spectrum when dispersed with the drugs (Fig. 6), indicating that it was in amorphous form in the presence of the drug.
Discussion
The most notable finding of this study is that the polymer, PHB, can either accelerate or inhibit the crystal growth rate in the supercooled liquid depending on the compound evaluated and the concentration of the polymer. These results are of interest, since to date, only one other polymer has been noted to accelerate crystal growth of low molecular weight organic materials,22 and in this instance only an acceleratory effect was noted rather than the variation in behavior that we observed in this study. The crystal growth rate (u) from the supercooled liquid is expected to depend on both thermodynamic and kinetic factors as shown by eqn (1).23 | (1) |
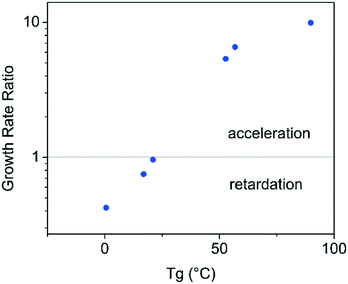
It is apparent from the data shown in Fig. 3 and 4 that compounds with a higher Tg appear to show an acceleration of growth rate in the presence of PHB, while the compounds with a lower Tg do not show this phenomenon. The growth rate data was further evaluated by plotting the ratio of the growth rate in the presence of polymer to that in the absence of polymer, as a function of compound Tg in order to further explore this relationship, with results shown in Fig. 12. This plot is very revealing regarding the impact of PHB on crystal growth rates, in that it is clear that the polymer can accelerate or retard the crystal growth rate in a manner that depends on the Tg of the compound evaluated. It should be noted that the growth rates were evaluated from the liquid at temperatures 30–40 °C above the compound Tg. Yu and coworkers evaluated the impact of low levels of polymers with different pure Tg values on the crystal growth rates of nifedipine in both the glass and liquid states. They found that the polymer with the lowest Tg, polyethylene glycol, (PEG) resulted in growth acceleration, whilst all other polymers either had minimal impact or retarded growth.22 A log–linear relationship between nifedipine crystal growth rate and polymer Tg was observed in their study. The acceleration or retardation of the growth rate by different polymers was attributed to polymer mobility whereby a low Tg polymer is expected to have a high segmental mobility and vice versa. Polymer mobility in turn is postulated to impact the ability of molecules of the crystallizing component to join the crystal resulting in the observed growth rate acceleration by the lowest Tg polymer, PEG. The authors further pointed out the effectiveness of the polymer on modifying the solvent mobility (herein the low molecular weight organic compound is considered as analogous to a solvent) should depend on the difference between the mobility of the polymer and the host molecules. Thus the observations of the current agreement are in broad agreement with the findings and explanation given by Yu and coworkers. The difference in mobility between PHB and the model drugs is greatest for the high Tg compounds, leading to an acceleration of growth rate. As the mobility difference between PHB and the drug decreases, as for APAP, ATP and FLU, all of which have much lower Tg's, the polymer no longer accelerates crystal growth and begins to have a retardation effect. This retardation effect most likely stems from the polymer molecules physically impeding transport of the crystallizing molecules to the crystal surface.
Interestingly, PVAc did not exhibit the same acceleratory effect on the growth rate of GRI. This drug–polymer combination has a Tg difference of around 50 °C, which is comparable to that observed for PHB and CEL, however in the latter system the polymer was found to accelerate the growth rate. Clearly Tg is only a crude indicator of mobility and more sophisticated indicators22 are likely to provide greater mechanistic insight into the observed differences between the two polymers.
Conclusions
A small amount of polyhydroxybutyrate was found to have a different effect on crystal growth rates from the supercooled liquid depending on the compound investigated. Compounds with Tg's much higher than that of the polymer (>50 °C higher) showed acceleration of crystal growth in the presence of the polymer suggesting that the polymer increased the molecular mobility of the crystallizing compound. In contrast, for compounds with Tg's closer to the Tg of the polymer, the polymer was able to act as a crystal growth inhibitor, reducing the transport rate of molecules to the growing crystal. This is the first reported example of a polymer having compound specific inhibitory or accelerator effects on crystal growth. These observations are of importance in the context of the stabilization of organic compounds to crystallization for applications such as drug delivery.Acknowledgements
We acknowledge the financial support provided by Kyowa Hakko Kirin Co., Ltd. (Tokyo, Japan). Dr. N. S. Trasi is thanks for helpful discussions.References
- T. Matsumoto and G. Zografi, Pharm. Res., 1999, 16, 1722–1728 CrossRef CAS.
- W. L. Chiou and S. Riegelman, J. Pharm. Sci., 1971, 60, 1281–1302 CrossRef CAS PubMed.
- Y. Kawabata, K. Wada, M. Nakatani, S. Yamada and S. Onoue, Int. J. Pharm., 2011, 420, 1–10 CrossRef CAS PubMed.
- B. C. Hancock and G. Zografi, J. Pharm. Sci., 1997, 86, 1–12 CrossRef CAS PubMed.
- V. Andronis and G. Zografi, J. Non-Cryst. Solids, 2000, 271, 236–248 CrossRef CAS.
- L. Taylor and G. Zografi, Pharm. Res., 1997, 14, 1691–1698 CrossRef CAS.
- K. Khougaz and S. D. Clas, J. Pharm. Sci., 2000, 89, 1325–1334 CrossRef CAS PubMed.
- T. Miyazaki, S. Yoshioka, Y. Aso and S. Kojima, J. Pharm. Sci., 2004, 93, 2710–2717 CrossRef CAS PubMed.
- B. Van Eerdenbrugh and L. S. Taylor, Mol. Pharmaceutics, 2010, 1058–1066 Search PubMed.
- G. Van den Mooter, M. Wuyts, N. Blaton, R. Busson, P. Grobet, P. Augustijns and R. Kinget, Eur. J. Pharm. Sci., 2001, 12, 261–269 CrossRef CAS PubMed.
- U. S. Kestur and L. S. Taylor, CrystEngComm, 2010, 12, 2390 RSC.
- H.-M. Müller and D. Seebach, Angew. Chem., Int. Ed. Engl., 1993, 32, 477–502 CrossRef.
- M. Lemoigne, Bull. Soc. Chim. Biol., 1926, 8, 770–782 CAS.
- V. Thakur and M. Thakur, Handbook of sustainable polymers: Processing and applications, 2016 Search PubMed.
- L. Ricotti, A. Polini, G. G. Genchi, G. Ciofani, D. Iandolo, H. Vazão, V. Mattoli, L. Ferreira, A. Menciassi and D. Pisignano, Biomed. Mater., 2012, 7, 035010 CrossRef PubMed.
- E. I. Shishatskaya, T. G. Volova, A. P. Puzyr, O. A. Mogilnaya and S. N. Efremov, J. Mater. Sci.: Mater. Med., 2004, 15, 719–728 CrossRef CAS PubMed.
- A. Althuri, J. Mathew, R. Sindhu, R. Banerjee, A. Pandey and P. Binod, Bioresour. Technol., 2013, 145, 290–296 CrossRef CAS PubMed.
- N. A. Parlane, K. Grage, J. Mifune, R. J. Basaraba, D. N. Wedlock, B. H. A. Rehm and B. M. Buddle, Clin. Vaccine Immunol., 2012, 19, 37–44 CrossRef CAS PubMed.
- K. Grage, A. C. Jahns, N. Parlane, R. Palanisamy, I. A. Rasiah, J. A. Atwood and B. H. A. Rehm, Biomacromolecules, 2009, 10, 660–669 CrossRef CAS PubMed.
- A. C. Kassab, K. Xu, E. B. Denkbaş, Y. Dou, S. Zhao and E. Pişkin, J. Biomater. Sci., Polym. Ed., 1997, 8, 947–961 CrossRef CAS PubMed.
- E. I. Shishatskaya, A. V. Goreva, O. N. Voinova, E. V. Inzhevatkin, R. G. Khlebopros and T. G. Volova, Bull. Exp. Biol. Med., 2008, 145, 358–361 CrossRef CAS PubMed.
- C. T. Powell, T. Cai, M. Hasebe, E. M. Gunn, P. Gao, G. Zhang, Y. Gong and L. Yu, J. Phys. Chem. B, 2013, 117, 10334–10341 CrossRef CAS PubMed.
- P. C. Hiemenz and T. P. Lodge, Polymer chemistry, CRC press, 2007 Search PubMed.
- S. Umemoto and N. Okui, Polymer, 2002, 43, 1423–1427 CrossRef CAS.
- K. Naito, Chem. Mater., 1994, 6, 2343–2350 CrossRef CAS.
- U. Kestur and L. S. Taylor, CrystEngComm, 2010, 14, 1691–1698 Search PubMed.
- B. Van Eerdenbrugh and L. S. Taylor, CrystEngComm, 2011, 13, 6171 RSC.
- K. Kothari, V. Ragoonanan and R. Suryanarayanan, Mol. Pharmaceutics, 2015, 12, 162–170 CrossRef CAS PubMed.
- L. Wu, M. Lisowski, S. Talibuddin and J. Runt, Macromolecules, 1999, 32, 1576–1581 CrossRef CAS.
| This journal is © The Royal Society of Chemistry 2017 |

