 Open Access Article
Determination of the thermal, oxidative and photochemical degradation rates of scintillator liquid by fluorescence EEM spectroscopy†
N. L. P.
Andrews
,
J. Z.
Fan
,
R. L.
Forward
,
M. C.
Chen
and
H.-P.
Loock
*
Department of Chemistry, Queen's University, Kingston, ON K7L 3N6, Canada. E-mail: hploock@queensu.ca
First published on 23rd November 2016
Abstract
The thermal, oxidative and photochemical stability of the scintillator liquid proposed for the SNO+ experiment has been tested experimentally using accelerated aging methods. The stability of the scintillator constituents was determined through fluorescence excitation emission matrix (EEM) spectroscopy and absorption spectroscopy, using parallel factor analysis (PARAFAC) as an multivariate analysis tool. By exposing the scintillator liquid to a well-known photon flux at 365 nm and by measuring the decay rate of the fluorescence shifters and the formation rate of their photochemical degradation products, we can place an upper limit on the acceptable photon flux as 1.38 ± 0.09 × 10⁻¹¹ photon mol L−1. Similarly, the oxidative stability of the scintillator liquid was determined by exposure to air at several elevated temperatures. Through measurement of the corresponding activation energy it was determined that the average oxygen concentration would have to be kept below 4.3–7.1 ppbw (headspace partial pressure below 24 ppmv). On the other hand, the thermal stability of the scintillator cocktail in the absence of light and oxygen was remarkable and poses no concern to the SNO+ experiment.
Introduction
The Sudbury Neutrino Observatory, SNO, was built at the 6800-foot level in the Vale Creighton mine near Sudbury, Ontario.1 Its successor, the upcoming SNO+ project, uses an organic solvent as the liquid scintillator (replacing the heavy water that was in SNO) to detect neutrinos. The SNO+ project will study solar neutrinos, reactor and geo antineutrinos, supernova neutrinos, and especially neutrinoless double beta decay (0νββ).2 If neutrinos are Majorana particles (as opposed to Dirac particles), and thereby their own antiparticles, double-beta decay events may occur without neutrino emission. To observe 0νββ experimentally, a double-beta decaying isotope, 130Te, will be used. The search for the ββ-decay process can be achieved by detecting the light emission generated by the β-particles from decaying 130Te nuclei as they interact with the scintillator cocktail. The scintillator is an organic solvent mixture, which also contains the dissolved or emulsified tellurium. Several thousand photomultiplier tubes (PMTs) are dedicated to detecting the emission in the visible region of the spectrum and the liquid scintillator cocktail therefore contains several fluorescence shifters, i.e. dyes that absorb the primary UV emission and fluoresce at longer wavelengths. In addition to the primary fluorophore, which also acts as a solvent, the scintillator cocktail contains strongly fluorescent compounds that through absorption of the primary fluorescence and subsequent fluorescence emission at longer wavelength, shift the emission to the optimum wavelength for optimal light detection. Specifically, for the SNO+ experiment, the scintillator cocktail under consideration comprises of a mixture of the primary fluorophore, linear alkylbenzene (LAB), a secondary fluorophore, 2,5-diphenyloxazole (PPO), and a tertiary fluorophore, 1,4-bis(2-methylstyryl)benzene (bis-MSB). Telluric acid, Te(OH)6, is not readily soluble in LAB and may either be encapsulated by micelles of dodecylbenzenesulfonic acid 2-propanamine, a surfactant, or may reacted with e.g. diols to form a soluble complex. The fluorescence shifters are selected such that the emission by LAB is absorbed by PPO and the PPO emission is absorbed by bis-MSB. The emission of PPO and bis-MSB falls into a window of high optical transparency of the primary fluorophore and solvent LAB as well as into a sensitive region of the photodetector response spectrum. Similar mixtures of fluorophores are also used in other neutrino detectors such as the Daya Bay Reactor Neutrino Experiment and the Reactor Experiment for Neutrino Oscillations (RENO).3,4 The acrylic vessel for the SNO+ experiment will hold approximately 780 tonnes of liquid scintillator loaded with around 3.9 tonnes of tellurium. Over 9500 PMTs surround the SNO+ vessel to detect the light emission from the fluorescing species in solution.It is anticipated that 0νββ is, at best, an extremely rare process producing only a few events per year, and the SNO+ experiment will have to be conducted for around seven years in a largely inert atmosphere at around 12 °C. During this period, the scintillator cocktail may start to decompose, thereby reducing the overall quantum yield of the cocktail. This would be detrimental to the SNO+ experiment, since the stability of the detector light yield is important for determining the energy of detected neutrinos and especially critical for the double-beta decay search. Also, colored degradation products may reduce the transparency of the cocktail and thereby reduce the intensity of the detectable emission.
In this study we independently consider thermal decomposition, oxidative destruction, and photochemical degradation. For these three processes we obtain rate constants and associated activation energies. This allows us to estimate the tolerances that are acceptable to maintain a functioning scintillator liquid.
A replica of the scintillator cocktail, not containing tellurium, was artificially aged at several high temperatures either under inert atmosphere or with exposure to air. The scintillator cocktail was also exposed to UV (365 nm) light. At high temperatures these thermal and photochemical aging processes take several days rather than several years. Rate constants and activation energies were determined and the decay rate at ambient temperatures was estimated by extrapolation. Fluorescence excitation emission matrix spectroscopy (EEMS) was used to quantify the concentrations of fluorophores while absorption spectroscopy helped determine the product formation rates.
Fluorescence EEMS combined with a multivariate analysis method is commonly used to classify compounds such as foodstuff,5 environmental,6 and industrial liquids.7,8 EEMS is also a powerful but possibly underused technique uniquely suited to follow the kinetics of fluorescent compounds for example in estimating the remaining useful life of engine lubricants.7–9 By comparison to other analytical techniques such as gas chromatography (GC) and high-performance liquid chromatography (HPLC), EEMS is non-destructive, does not require sample preparation and can be used with a fiber probe for on-line analysis, i.e. it might be useful in at-line quality monitoring – not only of scintillation liquids. In EEMS the sample is excited at a large number of wavelengths and the entire emission spectrum is recorded at each excitation wavelength. This generates three-dimensional fluorescence maps that allow the observation of all of the fluorescing compounds within the excitation boundaries. These second-order EEM spectra can be interpreted using a multivariate analysis technique such as parallel factor (PARAFAC) analysis to identify and quantify the spectroscopic components within the cocktail. In some cases, such as the present study, these PARAFAC components may be correlated to the fluorescent chemical compounds or compound classes.10,11
Our study is intended to guide the scintillator composition of the SNO+ project, and allow us to specify the conditions that permit the scintillator to function throughout the several year duration of the SNO+ experiment. It may also serve as an example on the application of fluorescence EEM in determining chemical decay kinetics.
Experimental section
Sample preparation
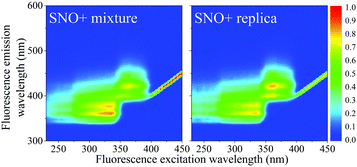
Samples contained 2 g L−1 PPO (Top Grade, PerkinElmer), 15 mg L−1 bis-MSB (Aldrich, Milwaukee, WI) all dissolved in LAB (Petresa Canada Inc.). The modified replicate cocktail was identical to that proposed for SNO+ with the exception of the tellurium-containing micelles consisting of Te(OH)6 and surfactant. These compounds do not contribute or alter the fluorescence of the scintillator (Fig. 1).Aging experiments
Absorption measurements
Absorption spectra were acquired for 91 of the 101 degraded scintillation solutions (Ocean Optics USB4000 spectrometer coupled to an Ocean Optics USB-ISS-UV-Vis light source). Since thermal aging under an inert atmosphere had no measurable effect, not all samples from this experiment were analysed. For each sample 10 spectra were averaged with an integration time of 60 ms. The oxidized samples were placed in a 1 mm cuvette and were diluted with LAB.Excitation emission matrix spectroscopy
A double-grating fluorescence spectrometer (Varian, Cary Eclipse) was used to collect EEM spectra of all 101 aged sample solutions. Approximately 3.5 mL of each sample was placed into a 10 × 10 × 45 mm quartz-fused cuvette. The spectra acquisition was performed in the dark to ensure minimal exposure to ambient light. A custom-built bifurcated fiber-optic cable bundle was coupled directly to the spectrometer. The design of the fiber probe is discussed in detail in a previously published paper.9 The custom probe was used instead of conventional right angle fluorescence collection, since it is less affected by the secondary absorption by the fluorophores, which is inherent in scintillation cocktails.All EEM spectra for PARAFAC analysis were collected in an excitation range of 200–450 nm with an emission range of 300–600 nm. The excitation and emission wavelengths had step increments of 5 nm and 2 nm, respectively. Both of the excitation and emission monochromator slits were set to 5 nm and auto-filters were used to remove second-order diffraction light from exciting the sample. A scan rate of 1200 nm per minute was used for the fluorescence collection and each of the 101 spectra took approximately 28 minutes to collect.
Parallel factor (PARAFAC) analysis
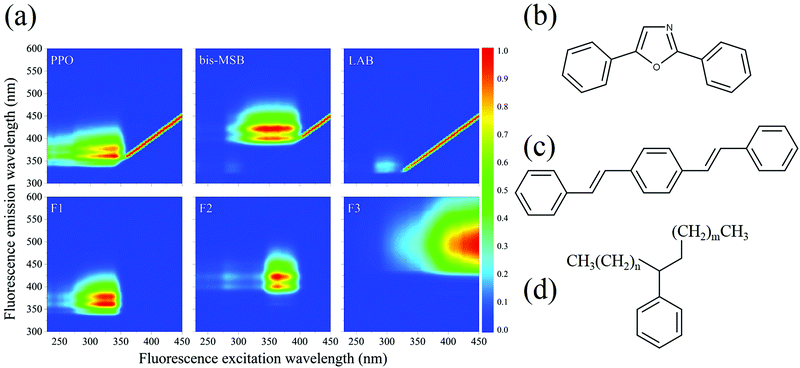
All 101 EEM spectra were analyzed together using multivariate analysis. PARAFAC analysis was performed using the drEEM toolbox in Matlab™ to identify specific fluorescent compounds in the SNO+ cocktail.10,11 In contrast to most other multivariate methods PARAFAC can sometimes help identify specific fluorophores or classes of fluorophores. In our case of initially well-characterized samples, whose composition evolves with time, PARAFAC is a particularly useful technique. The PARAFAC analysis algorithm was applied 10 times to the data set, with random initialization, non-negativity constraints, and a convergence criterion of 1 × 10⁻¹⁰. The spectra were also normalized before analysis to give equal weights to those samples having weak fluorescence.The analysis of the complete data set of 101 EEM spectra gave an excellent fit to only three distinct components, as shown in Fig. 2, with a “percent explained” of 96.0% and a core consistency of 96.7%, meaning that the components are largely orthogonal. Two of the components—F1 and F2—clearly relate to the two scintillation shifters—PPO and bis-MSB, respectively.10,11,15 Their EEM spectra were recorded independently in the solvent LAB and were very similar to those of the two components in Fig. 2. The differences between the spectra are attributed to inner filter effects. The third component F3, which is red-shifted from F1 and F2 is most likely attributable to dimers and oligomers formed as the SNO+ scintillation solution is aged. The identity of these compounds is discussed below.
Notably, fluorescence of LAB is not observed. LAB exhibits an excitation maximum near 300 nm and emission at around 330 nm. LAB fluorescence is not observed in the presence of PPO, since PPO absorbs the fluorescence of LAB. The LAB peak is faintly observed in the bis-MSB sample, however.
In addition, the absorption spectra (67 oxidized and 7 thermally aged in inert conditions) were analyzed using the same PARAFAC analysis to determine any increased absorption due to the formation of products from the degradation of the scintillator solution. The 17 absorption spectra of the photo-degraded samples underwent a separate PARAFAC analysis. Since the drEEM toolbox requires a 3-dimensional data cube, the square root of the 2-D absorption spectra were multiplied by the square root of their transpose (decimated by 10) to generate a mock-EEM spectrum that could be analyzed.16 This ensured that the same number of components was present in both dimensions and that the magnitude of absorption matched that of the sample.
Kinetic model
The concentration of both fluorophores, bis-MSB and PPO, may be described with a simple kinetic model based on pseudo-first order reactions. As the scintillation solution is heated either with or without oxygen, or degraded using UV radiation, the fluorophore, X, degrades into one or more products, such as an oxidation product, a dimer or higher oligomer. Also, it is likely that, when heated or photochemically excited, bis-MSB isomerizes from its trans- to cis-form. In the cis-configuration a reversible pericyclic reaction can occur where the cis-conjugated triene forms a cyclohexadiene, which in this case is a dihydrophenanthrene.17 With the addition of an oxidizer such as O2 the dihydrophenanthrene intermediate can form phenanthrene.18,19 PPO when heated in the presence of oxygen will form an ozonide.20 This will break the conjugation and thus reduce the fluorescence in the visible region. The ozonide can then further react to form ketones and aldehydes.21 In the presence of UV radiation PPO can undergo a photochemical rearrangement to form 3,5-diphenylisoxazole with 2,4-diphenyloxazole.22 The identity of the products is not of great relevance to this study, but their collective fluorescence and absorption properties are important. We model a generic decomposition of fluorophore X using the following reactions. | (R1) |
 | (R2) |
 | (R3) |
 | (R4) |
 | (1) |
 | (2) |
 | (3) |
 and
and  . With these assumptions we can integrate the three independent reactions (R1)–(R3) to give
 | (4) |
 | (5) |
 | (6) |
 | (7) |
 | (8) |
 | (9) |
Results and discussion
Oxidative aging
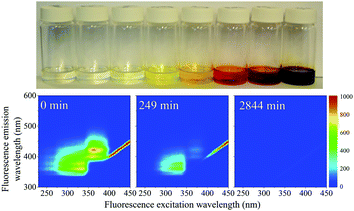
When the SNO+ scintillator replica was heated while being exposed to air, the solution transformed from a colorless transparent liquid to a black viscous solution containing solid particulates (Fig. 3). As the sample was oxidized, its fluorescence also decreased substantially.In Fig. 4 we show the normalized scores of the three components F1, F2 and F3, which correlate to the concentration of the fluorophores PPO, bis-MSB and what appears to be a product of bis-MSB degradation. As expected, at higher temperatures the sample degrades more quickly. F3 is likely a dimer or oligomer of bis-MSB due to its red shifted spectra. In some experiments it is evident that the scores of F3 increase and then subsequently decay as the scintillation solution is aged, indicating that this primary oxidation product further decomposes.
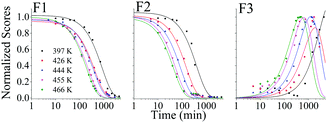 | ||
| Fig. 4 Normalized PARAFAC scores of the three fluorescent components, F1, F2 and F3 of Fig. 2, after aging the scintillator liquid in breathing grade air. The lines for F1 and F2 are single exponential decay curves obtained by fitting to eqn (4). The solid lines through the F3 data represent a fit to eqn (8). | ||
The rate constants  were obtained by fitting to eqn (4) and (8), and are given in Table 1. Activation energies associated with the pseudo-first-order rate constants are obtained from an Arrhenius plot. For the thermal degradation of F1 (PPO) and F2 (bis-MSB) in the presence of oxygen the activation energies are found to be 32.5 ± 3.7 kJ mol−1 and 48.0 ± 2.7 kJ mol−1, respectively (Fig. 5(a)). With these activation energies, the rate constants,
  , at room temperature (298 K) and the temperature of the SNO+ experiment (285 K) can be determined by extrapolation (Table 1). These rates were then used to determine the fraction of F1 (PPO) and F2 (bis-MSB) remaining. Fig. 5(b) shows that in the presence of oxygen, PPO in the SNO+ scintillation replica degrades to 90% (99%) in only about 3 (0.3) days at 285 K. Once bis-MSB and PPO are degraded to less than 99% of their original concentration the scintillator function is affected. Oxygen at ambient concentration (22% in air) will degrade the scintillator liquid within a few days and must therefore be removed to ensure its longevity. By reducing the oxygen concentration the pseudo-first order rate constant,
  , is correspondingly reduced and the lifetime can be extended. An oxygen partial pressure in the headspace never exceeding 24 ppmv (100 ppmv) would reduce the two rate constants to
  and thus allow the fluorescence of PPO (bis-MSB) to remain within 99% of its initial value over the anticipated 7 year lifespan.
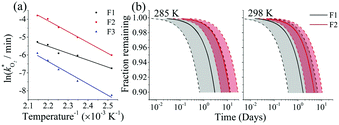 | ||
Fig. 5 (a) Arrhenius plot of the rate constants,  , obtained from the fits in Fig. 4. The slopes give the activation energies of F1 (PPO) and F2 (bis-MSB) as 32.4 ± 3.5 kJ mol−1 and 50.5 ± 1.9 kJ mol−1 respectively. The slope of F3 formation gives an activation energy of 52.4 ± 4.4 kJ mol−1 similar to the decay rate of bis-MSB. (b) The fraction remaining of F1 (black) and F2 (red) at 285 K and 298 K. The shaded area between the dashed lines represent the upper and lower boundary using one standard deviation of the activation energy. From these activation energies, rate constants were obtained by extrapolation to room temperature (298 K) and the temperature of the SNO+ experiment (285 K). , obtained from the fits in Fig. 4. The slopes give the activation energies of F1 (PPO) and F2 (bis-MSB) as 32.4 ± 3.5 kJ mol−1 and 50.5 ± 1.9 kJ mol−1 respectively. The slope of F3 formation gives an activation energy of 52.4 ± 4.4 kJ mol−1 similar to the decay rate of bis-MSB. (b) The fraction remaining of F1 (black) and F2 (red) at 285 K and 298 K. The shaded area between the dashed lines represent the upper and lower boundary using one standard deviation of the activation energy. From these activation energies, rate constants were obtained by extrapolation to room temperature (298 K) and the temperature of the SNO+ experiment (285 K). | ||
One may now estimate the maximal permissible concentration of dissolved O2 in the scintillator cocktail. The solubility of O2 in LAB is not given in the literature. However, Battino et al. have performed a comprehensive investigation of the solubility of O2 in a number of related solvents.23,24 The solubility of oxygen in LAB may be approximated with that of long chain hydrocarbons such n-decane or hexadecane, and the solubility in aromatic hydrocarbons such as butylbenzene. The dissolved mole fraction of O2 in n-decane, hexadecane and butylbenzene are 22 × 10−4, 24 × 10−4 and 15 × 10−4, respectively, at an oxygen pressure of 101.35 kPa.23,24 Thus it is expected that in our experiment using a partial O2 pressure of 0.22 × 101.35 kPa O2 the dissolved mole fraction of O2 in LAB is about 3.2–5.3 × 10⁻⁴.
To protect the scintillator liquid against oxidation the headspace oxygen concentration should not exceed a partial pressure of 2.4 Pa (24 ppmv) which corresponds to an estimated dissolved O2 mole fraction of 3.5–5.8 × 10⁻⁸ (4.3–7.1 ppbw), if the gas in the headspace was completely equilibrated with the liquid.
In addition, the formation of colored oxidation products poses additional limits on the oxygen concentration as is shown in the ESI.† Absorption spectroscopy was used to determine the rate of formation of colored products, but since several products contribute to the spectra and these oxidative reactions occur through several intermediates, it is difficult to unambiguously determine rate constants and activation energies. Even though we were not able to quantitatively establish an upper allowable oxygen concentration, the rate constants for the oxidation product formation obtained through absorption measurements were consistent with those obtained by measuring the degradation of the reactants through fluorescence.
Thermal aging under inert conditions
The fluorescence EEM spectra of the thermally aged scintillation replica under inert, oxygen-free, conditions are given in Fig. 6. Even when kept at the highest temperature of 513 K, the sample retains its original fluorescence intensity for nearly two months. The normalized scores obtained by PARAFAC analysis are given in Fig. 7(a) and are fit to an exponential decay function, to model a first-order reaction, eqn (5). As the scores do not decrease enough to generate a reliable exponential decay, a worst case scenario was implemented, by adding an extra data point located at 50% of the normalized score at the next, future, time interval (200 days). This time interval was determined using the same fit to the exponential decay function, separately for both components.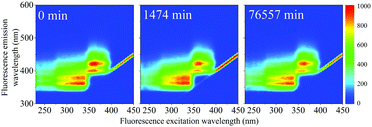 | ||
| Fig. 6 EEM spectra of samples obtained after heating to 513 K under inert conditions. The fluorescence remains strong even after aging for nearly 2 months. | ||
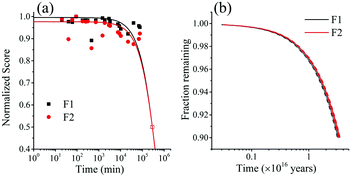 | ||
| Fig. 7 (a) Normalized PARAFAC scores of components F1 (PPO) and F2(bis-MSB) obtained by analysis of the EEM spectra after heating to 513 K. Component F3 was excluded as its contribution was negligible. The colored lines represent single exponential decay fits through the scores using eqn (5). The hollow data points at 50% were added to help the exponential fit and are used as a worst case scenario. (b) Fraction remaining of F1 (black) and F2 (red) at 285 K if the scintillator is kept under inert conditions. The remaining fraction was obtained by calculating the Gibbs free energy of activation, ΔG‡, obtained from the rates in Fig. 10(a) with eqn (10). The shaded areas between the dashed lines represent one standard deviation of the rate at 285 K. | ||
The rate constants obtained in the fit of Fig. 7(a) are given in Table 2. The Gibbs free energies of activation, ΔG‡, were obtained using the Eyring–Polanyi equation below and are also given in Table 2.
 | (10) |
| Temperature (K) | ΔG‡ (kJ mol−1) | ||
|---|---|---|---|
| 285# | 513 | ||
| k T(F1) (s−1) | 1.03 (0.03) × 10−24 | 2.39 (0.04) × 10−6 | 200.7 (0.1) |
| k T(F2) (s−1) | 0.98 (0.03) × 10−24 | 2.32 (0.04) × 10−6 | 200.8 (0.1) |
The rate at 285 K – the temperature of the SNO+ experiment—could then be determined by extrapolation. Using eqn (10), the fraction of F1 (PPO) and F2 (bis-MSB) remaining in the SNO+ scintillation replica was determined and is shown in Fig. 7(b). As observed, even in a worst case scenario, the SNO+ scintillation replica is extremely stable when kept under inert conditions. It will take approximately 3.4 × 10¹⁵ (3.2 × 10¹⁴) years for the bis-MSB concentration to degrade to 90% (99%) of its original concentration.
As expected, the absorption (not shown) does not noticably change as the sample is aged under inert conditions and, similar to the EEM spectra, the absorption spectra at 0 and 76557 min remain nearly identical.
Photochemical aging
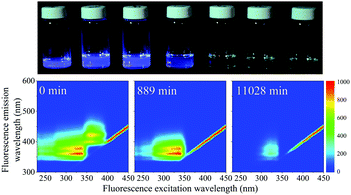
When exposed to UV light at 365 nm, the fluorescence of the SNO+ scintillation solution replica rapidly diminishes as shown in Fig. 8. This is clearly visible as the blue fluorescence decreases after samples were illuminated by UV radiation. The normalized scores obtained by PARAFAC analysis are given in Fig. 9 and are fit to an exponential decay. Inner filter effects are apparent through the slight increase of the PPO fluorescence until bis-MSB has degraded. Thus, only the scores of PPO after the maximum were used to determine the rate constants from the fit to eqn (6).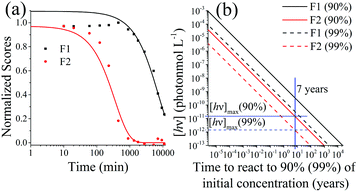 | ||
| Fig. 9 (a) Normalized scores of F1 (PPO) and F2 (bis-MSB) of the photo-degraded samples obtained using PARAFAC analysis. The lines represent single exponential decay processes and are fit to eqn (6). The fit for F1 was only conducted on the decreasing portion of the data, due to inner filter effects. (b) Concentration of photons to degrade the SNO+ scintillation replica to 90% (Solid lines) or 99% (dashed lines) of its original concentration at 285 K. The solid blue line represents the 7 years of the SNO+ experiment and the horizontal blue lines show the maximum concentration of allowed photons that the solution can be constantly exposed to in order to ensure a 90% or 99% effective solution. These were obtained by calculating the Gibbs free energy of activation, ΔG‡. | ||
Dividing the pseudo-first order rate constants,  by the photon concentration of [hν] = 4.25 ± 0.17 × 10⁻⁷ photon mol L−1 allows us to obtain the second order rate constants, kP (Table 3). As with the thermally aged samples, the Gibbs free energies of activation, ΔG‡, of the photoreaction were obtained using eqn (10). With ΔG‡, the rate of degradation at the SNO+ experiment conditions, 285 K, was determined by extrapolation. The photon concentrations required to degrade the SNO+ scintillation solution replica to 99% and 90% of the fluorophores original concentration are given in Fig. 9(b). Fig. 9 shows that bis-MSB is much more sensitive than PPO to photochemical decomposition under UV-radiation. The maximum concentration of UV photons at 365 nm that can irradiate the scintillation solution to remain 90% (99%) fluorescent over 7 years was determined to be 1.38 ± 0.09 × 10⁻¹¹ photon mol L−1 (1.32 ± 0.08 ×10⁻¹² photon mol L−1).
 where [hν] = 4.25 ± 0.17 × 10⁻⁷ photon mol L−1. The column marked with # gives predicted rate constants obtained using the listed value for ΔG‡. The values for [hν]max represent the maximum concentration of UV photons allowed to ensure the solution remains 90% and 99% fluorescent over the 7 years. These values are shown graphically in Fig. 9(b) for F2
| Temperature (K) | ΔG‡ (kJ mol−1) | [hν]max (×10−10 photon mol L−1) | |||
|---|---|---|---|---|---|
| 285# | 298 | 90% remaining | 99% remaining | ||
| k P(F1) (L photon mol−1 M− 1s−1) | 1.458 (0.052) | 5.41 (0.18) | 68.84 (0.08) | 3.27 (0.11) | 0.312 (0.011) |
| k P(F2) (L photon mol−1 M−1 s−1) | 34.6 (2.3) | 111.7 (7.0) | 61.33 (0.16) | 0.138 (0.009) | 0.0132 (0.0008) |
| k P(AP1) (L photon mol−1 M−1 s−1) | 5.58 (0.32) | 19.5 (1.1) | 65.66 (0.13) | ||
| k P(AP2) (L photon mol−1 M−1 s−1) | 1.58 (0.34) | 5.8 (1.2) | 68.65 (0.51) | ||
Absorption spectra of the UV aged samples, Fig. 10(a), show that the absorption also decreases with increased exposure. PARAFAC analysis of the 17 photodegraded sample absorption spectra led to a two component fit which is given in Fig. 10(b). Component AP1 resembles the absorption spectrum of PPO, Fig. S1(b) in the ESI†, and its scores decrease with a first order decay. A fit to eqn (6) with [hν] = 4.25 ± 0.17 × 10⁻⁷ photon mol L−1 gives kP(AP1) = 19.5 (1.1) L photon mol−1 M−1 s−1 at 298 K. Although the absorption spectrum matches that of PPO this decay rate does not match the decay constant of the fluorescence component F1(PPO), kP(F1) = 5.41 (0.18) L photon mol−1 M−1 s−1. AP1 must then be attributed to both the degradation of PPO and another process that occurs much faster—the degradation of bis-MSB as a possible example.
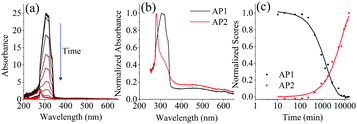 | ||
| Fig. 10 (a) Absorption spectra of the photo degraded samples. As the samples are exposed to UV light the absorbance decreases. (b) The two components determined using PARAFAC (AP1, AP2) on the 17 UV degraded samples. (c) Shows the normalized absorbance scores of both components shown in b. The lines represent fits to the data using eqn (6) and (9). | ||
The second component, AP2, which has λmax ≈ 280 nm increases as the sample is degraded and a fit to eqn (9) gives kP(AP2) = 5.8 (1.2) L photon mol−1 M−1 s−1 at 298 K. This matches the rate of the degradation of F1 (PPO) from the fluorescence data (Table 3) and it is therefore likely that component AP2 is a primary PPO photodegradation product. Given that the absorption peak of AP2 at 280 nm (Fig. 10(b)) is similar to those of phenyl groups it is plausible that PPO photochemically degrades by breaking its conjugation. The above paragraph illustrates that the interpretation of absorption spectra to extract the reaction kinetics of a complex degradation process is neither simple nor unambiguous.
Conclusions
Excitation–emission matrix spectroscopy was combined with parallel factor analysis to determine the stability of the SNO+ scintillation solution under oxidative, thermal, and photochemical stress and to specify the necessary conditions needed to ensure its function for the anticipated 7 year duration of the SNO+ experiment.25 It was determined that the presence of O2 in the scintillation flask or headspace is very detrimental to the SNO+ experiment and the amount of O2 must be below a partial pressure in the headspace of 2.4 Pa (24 ppmv) corresponding to an approximate dissolved mole fraction of 3.5 to 5.8 × 10⁻⁸ (4.3–7.1 ppbw). This condition must be fulfilled to ensure that the solution would remain 90% fluorescent after 7 years – the anticipated duration of the SNO+ experiment. The absorption data shown in the ESI† are consistent with these values.We note that oxygen can be removed quite effectively from water and other solvents by bubbling purified nitrogen gas through solution. It was shown previously that about 500 ppbw of O2 (mole fraction of 4.1 × 10⁻⁶) remain dissolved in water after purging with nitrogen.26 This concentration would be equilibrated to a concentration of 2700 ppmv in the headspace. Simple purging of the scintillator liquid with N2 may therefore not be sufficient to ensure the longevity of the solution, if the scintillator was allowed to equilibrate with an infinitely large headspace. In the SNO+ experiment, however, the headspace volume is very small compared to the volume of the liquid and the supply of O2 is limited. In both estimates of the maximum allowable O2 concentration it was assumed that the concentration of O2 in the headspace was constant. If the SNO+ flask was kept airtight and the headspace very small, the oxidation process would terminate as soon as the O2 supply is depleted. Trivially, the depletion reaction will stop after all O2 has reacted with the large excess of PPO.
It is also apparent that after purging the scintillator with purified N2 and keeping the SNO+ scintillation solution under inert gas the solution is expected to remain useable for much longer than 7 years. When handling the SNO+ scintillator liquid, e.g. when filling tanker trucks, storage vessels, pipes, and, of course, the SNO+ detector, it is therefore important to first purge the empty container with an inert gas before filling it with scintillator liquid.
In addition, adding an oxygen quencher such as 1,4-diazabicyclo[2.2.2]octane (DABCO) may improve the lifetime of the fluorescent dyes and increase the SNO+ scintillation solutions lifetime.27 There are inherent risks in adding even more compounds to the scintillator mixture, however, as they may also contaminate the liquid.
We also showed that UV radiation degrades the SNO+ scintillation solution and measures must be taken to ensure that the average concentration of photons in the flask remains lower than 1.38 ± 0.09 × 10⁻¹¹ photon mol L−1. As a comparison the photon flux of a UV curing lamp is about 4.25 ± 0.17 × 10⁻⁷ photon mol L−1. While the SNO+ scintillator will be kept in the dark during the experiment, precautions are also needed when preparing the solution.
The degradation studies presented in this paper on the SNO+ liquid scintillator can be used as a guide for other liquid scintillator systems. Many scintillators contain similar fluorophores such as oxazoles or conjugated π-systems and would be expected to degrade in similar reactions. While their rate constants with regards to their reactions with oxygen and light are different, the techniques described in this article are readily transferrable to future studies on the stability of liquid scintillators.
Finally, in the present study the SNO+ scintillator replica did not contain tellurium, but in the second phase of the SNO-experiment 130Te will have to be dissolved either as part of an inverted micellar solution or through forming a soluble complex. It is then quite likely that the oxidative stability of the cocktail will be affected and a second study is required.
The main advantage of combining EEM fluorescence spectra with PARAFAC analysis is its ability in extracting kinetic information. Although determining the optical performance and stability of the scintillator using spectroscopy is not unique, the approach presented in this work may be the first spectroscopic analysis where the performance of a scintillator (fluorescence, absorption) is determined in a multi-parameter system (temperature, UV exposure, O2 exposure, time).
It is likely that this combination of methods is also suitable to study other mixtures of fluorescent species, such as the degradation of foodstuff, environmental samples, lubricants, and other industrial liquids.9
Acknowledgements
The authors thank Igor Kozin for lending the absorption spectrometer to us, Cathleen Crudden for use of her recrystallization oven, and Weatherford International for lending us the Fluorescence EEM spectrometer. We also acknowledge funding by the Natural Sciences and Engineering Research Council (NSERC) of Canada.References
- J. Boger, R. L. Hahn and J. K. Rowley, et al., (SNO Collaboration), Nucl. Instrum. Methods Phys. Res., Sect. A, 2000, 449, 172–207 CrossRef CAS.
- M. C. Chen, Nucl. Phys. B, Proc. Suppl., 2005, 145, 65–68 CrossRef CAS.
- F. P. An, Q. An and J. Z. Bai, et al., (Daya Bay Collaboration), Nucl. Instrum. Methods Phys. Res., Sect. A, 2012, 685, 78–97 CrossRef CAS.
- J. S. Park, J. Lee and I. S. Yeo, et al., (RENO Collaboration), Nucl. Instrum. Methods Phys. Res., Sect. A, 2013, 707, 45–53 CrossRef CAS.
- D. Airado-Rodríguez, I. Durán-Merás, T. Galeano-Díaz and J. P. Wold, J. Food Compos. Anal., 2011, 24, 257–264 CrossRef.
- P. G. Coble, Mar. Chem., 1996, 51, 325–346 CrossRef CAS.
- H. Omrani, A. E. Dudelzak, B. P. Hollebone and H. P. Loock, Anal. Chim. Acta, 2014, 811, 1–12 CrossRef CAS PubMed.
- H. Omrani, J. A. Barnes, A. E. Dudelzak, H.-P. Loock and H. Waechter, Analyst, 2012, 137(2782), 8 Search PubMed.
- N. L. P. Andrews, J. Z. Fan, H. Omrani, A. Dudelzak and H.-P. Loock, Tribol. Int., 2016, 94, 279–287 CrossRef CAS.
- K. R. Murphy, C. A. Stedmon, D. Graeber and R. Bro, Anal. Methods, 2013, 5(23), 6557–6566 RSC.
- R. Bro and H. A. L. Kiers, J. Chemom., 2003, 17(5), 274–286 CrossRef CAS.
- D. T. Mahin, Int. J. Appl. Radiat. Isot., 1966, 17, 185–191 CrossRef CAS PubMed.
- R. W. Pringle, L. D. Black, B. L. Funt and S. Sobering, Phys. Rev., 1953, 92, 1582–1583 CrossRef CAS.
- C. G. Hatchard and C. A. Parker, Proc. R. Soc. London, Ser. A, 1956, 235, 518–536 CrossRef CAS.
- H.-L. Xiao, X.-B. Li, D. Zheng, J. Cao, L.-J. Wen and N.-Y. Wang, Chin. Phys. C, 2010, 34, 1724 CrossRef CAS.
- N. L. P. Andrews, A. G. MacLean, J. E. Saunders, J. A. Barnes, H. P. Loock, M. Saad, C. L. Jia, K. Ramaswamy and L. R. Chen, Opt. Express, 2014, 22(16), 19337 CrossRef PubMed.
- J. McMurry, Organic Chemistry (Brooks/Cole Publishing Company), Cornell University, 2012, pp. 1215–1219 Search PubMed.
- T. J. H. M. Cuppen and W. H. Laarhoven, J. Am. Chem. Soc., 1972, 94, 5914–5915 CrossRef CAS.
- F. B. Mallory and C. W. Mallory, Organic Reactions, John Wiley & Sons, Inc., 2004 Search PubMed.
- M. E. Ackerman, G. H. Daub, F. N. Hayes and H. A. Mackay, in Organic Scintillators and Scintillation Counting, ed. D. Horrocks, Elsevier, 2012, pp. 315–325 Search PubMed.
- C. Geletneky and S. Berger, Eur. J. Org. Chem., 1998, 1625–1627 CrossRef CAS.
- D. a. Maurizio, Adv. Heterocycl. Chem., Elsevier, 2001, vol. 79, pp. 41–88 Search PubMed.
- R. Battino, T. R. Rettich and T. Tominaga, J. Phys. Chem. Ref. Data, 1983, 12(2), 163–178 CrossRef CAS.
- H. L. Clever, R. Battino, H. Miyamoto, Y. Yampolski and C. L. Young, J. Phys. Chem. Ref. Data, 2014, 43(3), 033102 CrossRef.
- S. Biller, presented at the 13th Int. Conf. on Topics in Astroparticle and Underground Physics, 2014, unpublished.
- I. B. Butler, M. A. A. Schoonen and D. T. Rickard, Talanta, 1994, 41(2), 211–215 CrossRef CAS PubMed.
- C. Schweitzer and R. Schmidt, Chem. Rev., 2003, 103, 1685–1758 CrossRef CAS PubMed.
Footnote |
| † Electronic supplementary information (ESI) available. See DOI: 10.1039/c6cp06015c |
| This journal is © the Owner Societies 2017 |

