Understanding dispersive charge-transport in crystalline organic-semiconductors†
Ilhan
Yavuz
a and
Steven A.
Lopez
*b
aDepartment of Physics, Marmara University, 34722, Ziverbey, Istanbul, Turkey
bDepartment of Chemistry and Chemical Biology, 12 Oxford Street, Harvard University, Cambridge, MA 02138, USA. E-mail: lopez01@fas.harvard.edu
First published on 23rd November 2016
Abstract
The effect of short-range order and dispersivity on charge-transport for organic crystalline semiconductors are important and unresolved questions. This exploration is the first to discern the role of short-range order on charge-transport for crystalline organic semiconductors. A multimode computational approach (including Molecular Dynamics and kinetic Monte Carlo simulations) is employed to understand the hole mobility dispersivity of crystalline organic semiconductors. Crystalline organic solids feature a mesoscale region where dispersive charge-transport dominates; our calculations show a clear transition of charge-mobility from non-dispersive to dispersive. An empirical relationship between the dispersive and non-dispersive transport transition region and ideal simulation box thickness is put forth. The dispersive to non-dispersive transition region occurs when energetic disorder approaches 72 meV. Non-dispersive transport is observed for simulation box sizes greater than 3.7 nm, which corresponds to approximately 12 π-stacked layers in typical π-stacked organic solids. A qualitative relationship is deduced between the variability of measured dispersive hole and variability of computed dispersive hole mobilities and system size. This relationship will guide future charge-transport investigations of condensed-phase organic systems.
1. Introduction
In typical time-of-flight measurements on semiconductors, the sample is sandwiched between electrodes and charge-carriers are created by photo-excitation near one electrode. The charge-carriers are then driven to the counter-electrode by short laser pulses. The transit current is constant until the charge carriers reach the counter-electrode, causing an abrupt decrease in current.1–3 The decrease is then used to calculate the non-dispersive mobility. Dispersive charge-transport was first observed from anomalous transit-time measurements in disordered solids.4 In this case, transit current exhibits a gradual decrease instead of a constant value. Dispersivity is related to the sample size and the level of disorder of materials.4–6 In the case of dispersive transport, charge-mobilities are not constant, which obfuscates the relationship between charge transport and molecular composition.Charge-transport is commonly non-dispersive in high purity organic crystals with long-range order. Amorphous materials lack short range order and dispersive charge-transport is typically observed when thick (several mm) samples are used.6 Crystalline solids, on the other hand, have finite range order and may exhibit dispersive or non-dispersive transport. In crystalline materials, the range of order and transport is usually not known and critically depends on fabrication conditions. This is often cited as a reason for experimental irreproducibility of mobilities.7,8
Finite-sized simulation systems are often used to simulate morphology and charge-transport. Calculated mobilities may deviate significantly from experimental measurements.9,10 For instance, many examples of mobility computations in the literature assume perfectly ordered supercells for crystalline and thin-film organic semiconductors (OSCs), resulting in an overestimation of thin-film hole mobilities by at least an order of magnitude.10,11 Similarly, charge-transport in amorphous materials is often predicted using finite-sized simulation systems with periodic boundary conditions. This can result in hole mobilities overestimation in amorphous solids. Various empirical to parameter-free schemes have been proposed to extrapolate this finite-size problem in amorphous mobility predictions.5,6,9
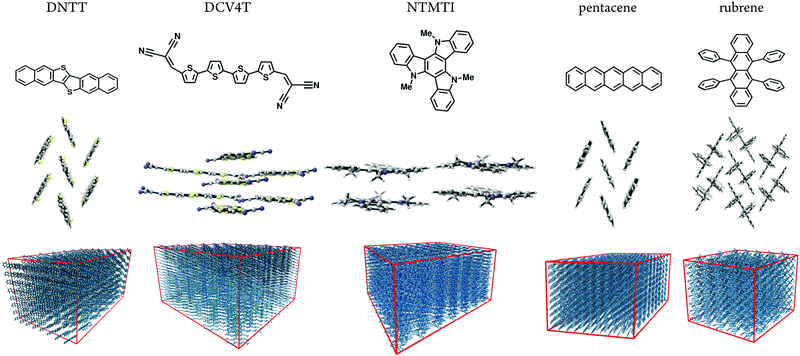
Here, we predicted size-dependent morphologies and hole mobilities to understand the dispersive transport of five well-known small-molecule OSC materials. Fig. 1 shows the OSC materials studied here: dinaphtho[2,3-b:2′,3′-f]thiophene[3,2-b]thiophenes (DNTT), dicyanovinyl end-capped quaterthiophene (DCV4T), N-trimethyltriindole (NTMTI), pentacene. and rubrene.10 Additionally, their hole mobilities span five orders of magnitude (10−4–10 cm2 V−1 s−1![[thin space (1/6-em)]](https://www.rsc.org/images/entities/char_2009.gif) 10). The crystal structures are known for these materials and the hole mobilities have been reported in the single crystal and thin-film morphologies. These references are summarized in Table S2 (ESI†). As shown in Fig. 1, DNTT, pentacene and rubrene possess herringbone-type packing. DCV4T has face-on packing arrangement. NTMTI molecules are packed in columns and face-on helicies.10
10). The crystal structures are known for these materials and the hole mobilities have been reported in the single crystal and thin-film morphologies. These references are summarized in Table S2 (ESI†). As shown in Fig. 1, DNTT, pentacene and rubrene possess herringbone-type packing. DCV4T has face-on packing arrangement. NTMTI molecules are packed in columns and face-on helicies.10
Although the single-crystals of both pentacene and rubrene are fabricated, and single-crystal hole mobilities are found to exceed 10 cm2 V−1 s−1,12–16 fabricating their crystalline thin-film counterparts have been challenging for nearly two decades. One of the first successful measurements for pentacene yielded a hole-mobility in the order of 10−2–10−3 cm2 V−1 s−1,7,17 this value is a few orders of magnitude lower than its single-crystal hole mobility. However, Kelly and co-workers measured hole mobility of 5–7 cm2 V−1 s−1 for pentacene, one of the highest organic thin-film hole mobility measurements to date.18 Similarly, the thin-film hole mobility of rubrene has been reported to be ∼10−3 cm2 V−1 s−1![[thin space (1/6-em)]](https://www.rsc.org/images/entities/char_2009.gif) 19 and later ∼1 cm2 V−1 s−1 for the same material.20–22 The hole-mobility of DNTT was first measured by Yamamoto et al.23,24 and observed insignificant variation in hole mobilities (roughly ∼1–3 cm2 V−1 s−1) with different fabrication conditions. The hole-mobility of NTMTI was measured by Shelton et al.25 at different fabrication conditions and by Reig et al.26 with an OTFT measurement and both measured hole mobilities on the order of 10−2 cm2 V−1 s−1. Thin-film hole mobility of DCV4T is measured to be ∼10−4 cm2 V−1 s−1 by Fitzner et al.27
19 and later ∼1 cm2 V−1 s−1 for the same material.20–22 The hole-mobility of DNTT was first measured by Yamamoto et al.23,24 and observed insignificant variation in hole mobilities (roughly ∼1–3 cm2 V−1 s−1) with different fabrication conditions. The hole-mobility of NTMTI was measured by Shelton et al.25 at different fabrication conditions and by Reig et al.26 with an OTFT measurement and both measured hole mobilities on the order of 10−2 cm2 V−1 s−1. Thin-film hole mobility of DCV4T is measured to be ∼10−4 cm2 V−1 s−1 by Fitzner et al.27
We systematically generated supercells of various sizes and imposed periodic boundary conditions to simulate dispersive charge-transport assuming infinite order (crystalline phase) molecules in Fig. 1. We then heated and equilibrated each system from 0 to 300 K. We computed reorganization energies, electronic-coupling and site-energies and then used the kinetic Monte Carlo method to calculate hole mobilities as a function of the system size. In all five cases, size modification is restricted to the crystallographic transport direction, to eliminate lateral transport influences. The box size in lateral directions is chosen to be large enough to ensure non-dispersive lateral transport, as indicated in Fig. 1.
We established a relationship between size-dependent atomistically-resolved morphologies and charge-transport properties. We identified a transition zone where the mobility changes from dispersive to non-dispersive. An empirical relationship between the boundary of dispersive and non-dispersive transport as a function of the system size is found. The difference between experimental and calculated hole mobility is related to the substantial variations in experimental thin-film hole mobilities by various groups and due to various experimental conditions.
2. Materials and methods
Atomistic Molecular Dynamics (MD) simulations are performed using the procedure described in ref. 10. We generated supercells and heated them for 2 ns followed by a 4 ns equilibration run at constant temperature (300 K). A subsequent 20 ns production run was performed for analysis. We use 10 MD snapshots as representative atomistic morphologies. Fig. 1 shows representative snapshots of these MD simulations. With the MD equilibrated morphologies in hand, charge-carrier dynamics simulations were carried out to determine mobilities. We assume a ‘hopping’ model, where charge carriers are localized on individual molecules and evolve via non-adiabatic charge transfer. The high-temperature limit of the Marcus charge-transfer rate is defined as:28,29 | (1) |
2.1. Reorganization energy, site-energy and mobility
Reorganization energies λ are calculated using the four-point rule (Fig. S1, ESI†)8 with B3LYP/6-311G(d,p)34–37 using Gaussian09.38λ values are given in ref. 10. Site-energies, Eij, are calculated using the Thole model (see ref. 33 for details and Fig. S2, ESI†). The coordinates of the molecular sites and possible intermolecular transport rates are the input for the kinetic Monte Carlo simulations. Hole mobilities are evaluated using velocity-averaging, μ = 〈v〉/F, where F is the field strength and v is the drift velocity. Mobilities are reported from the averages of 10 MD snapshots and 10 stochastic realizations for each snapshot. The reported mobilities are along the main transport directions.In the context of the Gaussian Disorder Model (GDM), the histogram of ΔEij are fitted to Gaussian function of the form and related to energetic disorder, σ.6,8 All charge-transport simulations are performed using the Versatile Object-oriented Toolkit for Coarse Graining Applications (VOTCA) package.33 The VOTCA package provides a convenient platform to efficiently compute mobilities for ordered and disordered morphologies.
 | (2) |
3. Results
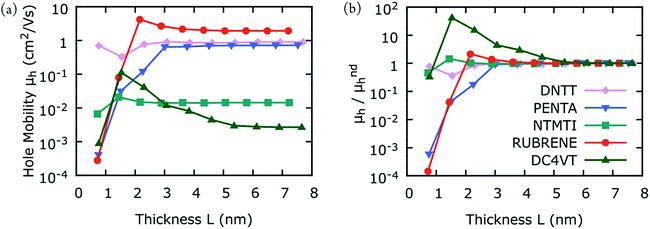
Fig. 1(a) and (b) shows our hole mobility calculations for DNTT, DCV4T, NTMTI, pentacene, and rubrene as a function of the simulation box thickness L. In all cases the mobilities vary for small L, corresponding to a dispersive mobility region, followed by hole mobilities, which converge with larger L; it becomes independent of the system size, consistent with non-dispersive mobility. The variation of hole mobilities in the dispersive region and the transition region from dispersive to non-dispersive transport is intrinsic to the packing arrangement of the material. The transition from dispersive to non-dispersive transport is observed for L ranging from 2–5 nm in all cases. In Fig. 2(b), we present the same hole mobility results but normalize the results to those of the non-dispersive hole mobilities. The hole mobilities of pentacene and rubrene vary almost four orders of magnitude in the dispersive region with increasing L before reaching the non-dispersive region. In contrast, the hole mobilities of DNTT and NTMTI differ by less than an order of magnitude even in the dispersive region. The computed dispersive hole mobility of DCV4T is similar to that of non-dispersive at the first point, but then increases two orders of magnitude and converges to its non-dispersive mobility. | ||
| Fig. 2 (a) Calculated hole-mobilities as a function of the simulation box thickness L (see Fig. 1). (b) Same as (a), but the results are normalized to those of non-dispersive hole-mobility. Each point in (a) is calculated from the average of 10 MD snapshots and 10 stochastic realizations for each snapshot. The points are connected with solid lines for clarity, despite the fact that one should expect a significant drop in mobility between any two points due to loss of periodicity. | ||
As mentioned earlier, the variability in experimental thin-film mobility measurements are large for pentacene and rubrene, while it is small for DNTT and NTMTI. Fig. 2 shows that hole mobility varies dramatically for pentacene and rubrene in the dispersive transport region, while the variation is small for DNTT and NTMTI. We anticipate that there must be a relationship between the amount of variation in dispersive hole mobilities and variations in experimental thin-film mobilities due different fabrication conditions. To complement the general search for promising organic materials with high hole mobilities, one should also consider their dispersive transport characteristics. This important finding offers an alternative perspective in future organic materials design protocols and could guide facile synthesis of thin-film organic materials for practical applications.
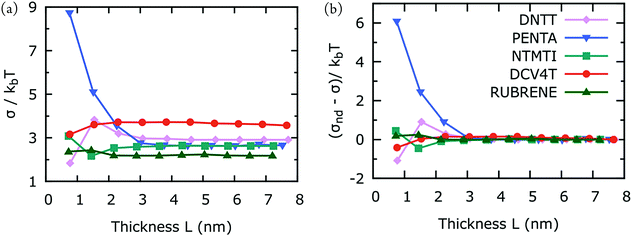
In order to gain better qualitative understanding in the size-dependence of hole mobility in crystalline organic semiconductors, we calculated the energetic disorder, σ, as a function of thickness L. The results are shown in Fig. 3(a) and (b). Similar to what we observed for hole mobilities, here σ varies with L in the dispersive region and converges for large L. Pentacene exhibits substantial thickness-dependent mobility, while the hole mobilities of the four other materials is independent of L. A very low hole mobility for pentacene in the dispersive region is consistent with high energetic disorder. Small variations in dispersive energetic disorders of DNTT, DCV4T and NTMTI are consistent with small variations in the experimental hole mobilities. Dispersive hole mobility of rubrene also varies considerably but the variation in energetic disorder is inconsistently small. This suggests that the large dispersive hole mobility variations in rubrene is controlled by greater electronic disorder, i.e. broadening in electronic coupling distributions. Although material performance of crystalline rubrene is promising, its charge-transport is one-dimensional, making it very sensitive to charge trapping arising from electronic disorder.39L-Dependent fluctuations in σ in the dispersive region generally parallel with those of hole-mobility, but we observed no strong correlation between σ and hole mobility for the L-dependent data. This suggests that charge-transport parameters are not by itself but collectively controlling hole-mobilities.10,11
 | ||
| Fig. 3 (a) Temperature-divided energetic disorder, σ, as a function of the simulation box thickness (see Fig. 1). (b) Same as (a), but the results are subtracted by those of non-dispersive energetic disorder. Each point in (a) is calculated from the average of 10 MD snapshots. kbT = 25.7 meV. | ||
3.1. Dispersive vs. non-dispersive mobilities
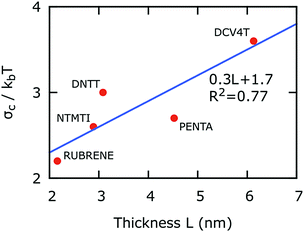
Fig. 4 shows the σc, for five organic materials, at the dispersive to non-dispersive transport transition region with respect to the simulation box thickness L. Transport can be classified as non-dispersive for a system with σ > σc or dispersive for σ < σc.6Fig. 4 also shows the linear relationship between L and σckb−1T−1 (R2 = 0.77). Similar relationships have been observed for disordered and amorphous materials with methodologies similar to our study.5,6,9 This relationship can guide the simulation size based on the energetic disorder of a crystalline organic material. For example, when σ = 72 meV, a non-dispersive transport is reached for L > 3.4 nm. The energetic disorder value of 72 meV corresponds to a typical p-type semiconductor, as reported in our earlier benchmarked study of 22 hole-transporting semiconductors.10 Typically, the intermolecular π–π stacking distance in organic semiconductors is approximately 0.3 nm.8,40,41 As a general rule, the simulation box should contain at least twelve transport planes for a size-independent simulation.There are no reported experiments that directly compare hole mobilities and variable short-range order in organic crystalline materials. However, there are a number of experimental works, which indirectly relate the short-range order to dispersive charge transport. For instance, some studies have shown that organic thin-film hole mobilities depend on grain-size, and resemble the results in Fig. 2.42–45 Although qualitatively similar, the exact role of crystalline domains or grain boundaries to the measured hole-mobilities is unclear. On the other hand, Hofmockel et al.46 report organic thin-film hole mobilities of alkylated DNTT derivatives (C10-DNTT) for a series with thicknesses on the order of ∼10 nm. Our results (Fig. 2) are consistent with this experimental behavior, and have broad predictive power.
4. Conclusions
The relationship between short-range order and charge-transport in organic materials is partially demystified with the most recent investigations of crystalline and amorphous morphologies. We constructed supercells of DNTT, DCV4T, NTMTI, pentacene, and rubrene with varying sizes and equilibrated by molecular dynamics simulations to introduce different levels of short-range order. We then simulated hole mobilities for each of the supercells for five common organic semiconductors. The mobilities are size-dependent when supercell thickness is less than 2–3 nm. The size-dependence of hole mobility is related to the size-dependence of energetic-disorder. We have identified a linear relationship between the system-size and the dispersive to non-dispersive transition zone. This study has defined optimal box sizes for size-independent charge-transport simulations. We anticipate that our results can be used to facilitate rational design of organic materials for OFETs and renewable energy applications.Acknowledgements
Simulations were performed at the Simulation Research Laboratory, Department of Physics, Marmara University under the research project FEN-C-DRP-120613-0273 supported by Marmara University, Scientific Research Commission (BAPKO). S. A. L. acknowledges the Department of Energy EERE Postdoctoral fellowship (Solar Energy).References
- R. G. Kepler, Phys. Rev., 1960, 119, 1226–1229 CrossRef CAS.
- O. H. LeBlanc, Jr., J. Chem. Phys., 1960, 33, 626 CrossRef.
- S. Tiwari and N. C. Greenham, Opt. Quantum Electron., 2009, 41, 69–89 CrossRef CAS.
- H. Scher and E. W. Montroll, Phys. Rev. B: Condens. Matter Mater. Phys., 1975, 12, 2455–2477 CrossRef CAS.
- P. M. Borsenberger, L. T. Pautmeier and H. Bässler, Phys. Rev. B: Condens. Matter Mater. Phys., 1992, 46, 12145 CrossRef CAS.
- H. Bässler, Phys. Status Solidi B, 1993, 175, 15–56 CrossRef.
- G. Horowitz, Adv. Mater., 1998, 10, 365–377 CrossRef CAS.
- V. Coropceanu, J. Cornil, D. A. da Silva Filho, Y. Olivier, R. Silbey and J.-L. Brédas, Chem. Rev., 2007, 107, 926–952 CrossRef CAS PubMed.
- A. Lukyanov and D. Andrienko, Phys. Rev. B: Condens. Matter Mater. Phys., 2010, 82, 193202 CrossRef.
- I. Yavuz, B. N. Martin, J. Park and K. N. Houk, J. Am. Chem. Soc., 2015, 137, 2856–2866 CrossRef CAS PubMed and references therein.
- I. Yavuz, S. A. Lopez, J. B. Lin and K. N. Houk, J. Mater. Chem. C, 2016 10.1039/c6tc03823a.
- O. D. Jurchescu, J. Baas and T. T. M. Palstra, Appl. Phys. Lett., 2004, 84, 3061 CrossRef CAS.
- V. Podzorov, E. Menard, A. Borissov, V. Kiryukhin, J. A. Rogers and M. E. Gershenson, Phys. Rev. Lett., 2004, 93, 086602 CrossRef CAS PubMed.
- V. Podzorov, E. Menard, J. A. Rogers and M. E. Gershenson, Phys. Rev. Lett., 2005, 95, 226601 CrossRef CAS PubMed.
- V. C. Sundar, J. Zaumseil, V. Podzorov, E. Menard, R. L. Willett, T. Someya, M. E. Gershenson and J. A. Rogers, Science, 2004, 303, 1644–1647 CrossRef CAS PubMed.
- J. Takeya, M. Yamagishi, Y. Tominari, R. Hirahara, Y. Nakazawa, T. Nishikawa, T. Kawase, T. Shimoda and S. Ogawa, Appl. Phys. Lett., 2007, 90, 102120 CrossRef.
- G. Horowitz, X. Z. Peng, D. Fichou and F. Garnier, Synth. Met., 1992, 51, 419–424 CrossRef CAS.
- T. W. Kelley, D. V. Muyres, P. F. Baude, T. P. Smith and T. D. Jones, in MRS Proceedings, ed. P.W. M. Blom, N. C. Greenham, C. D. Dimitrakopoulos, C. D. Frisbie, Cambridge University Press, 2003, vol 771, pp. L6-L5 Search PubMed.
- C. Wang, H. Dong, W. Hu, Y. Liu and D. Zhu, Chem. Rev., 2011, 112, 2208–2267 CrossRef PubMed.
- N. Stingelin-Stutzmann, E. Smits, H. Wondergem, C. Tanase, P. Blom, P. Smith and D. de Leeuw, Nat. Mater., 2005, 4, 601–606 CrossRef CAS PubMed.
- X. Qian, T. Wang and D. Yan, Org. Electron., 2013, 14, 1052–1056 CrossRef CAS.
- C. Du, W. Wang, L. Li, H. Fuchs and L. Chi, Org. Electron., 2013, 14, 2534–2539 CrossRef CAS.
- T. Yamamoto and K. Takimiya, J. Am. Chem. Soc., 2007, 129, 2224–2225 CrossRef CAS PubMed.
- T. Yamamoto and K. Takimiya, J. Photopolym. Sci. Technol., 2007, 20, 57–59 CrossRef CAS.
- S. W. Shelton, T. L. Chen, D. E. Barclay and B. Ma, ACS Appl. Mater. Interfaces, 2012, 4, 2534–2540 CAS.
- M. Reig, J. Puigdollers and D. Velasco, J. Mater. Chem. C, 2015, 3, 506–513 RSC.
- R. Fitzner, C. Elschner, M. Weil, C. Uhrich, C. Körner, M. Riede, K. Leo, M. Pfeiffer, E. Reinold, E. Mena-Osteritz and P. Bäuerle, Adv. Mater., 2012, 24, 675–680 CrossRef CAS PubMed.
- R. A. Marcus, J. Chem. Phys., 1956, 24, 966–978 CrossRef CAS.
- R. A. Marcus, Rev. Mod. Phys., 1993, 65, 599–610 CrossRef CAS.
- J.-L. Brèdas, J. P. Calbert, D. da Silva Filho and J. Cornil, Proc. Natl. Acad. Sci. U. S. A., 2002, 99, 5804–5809 CrossRef PubMed.
- J. Kirkpatrick, Int. J. Quantum Chem., 2008, 108, 51–56 CrossRef CAS.
- B. Baumeier, J. Kirkpatrick and D. Andrienko, Phys. Chem. Chem. Phys., 2010, 12, 11103–11113 RSC.
- V. Ruehle, A. Lukyanov, F. May, M. Schrader, T. Vehoff, J. Kirkpatrick, B. Baumeier and D. Andrienko, J. Chem. Theory Comput., 2011, 7, 3335–3345 CrossRef CAS PubMed.
- A. D. Becke, J. Chem. Phys., 1993, 98, 5648–5652 CrossRef CAS.
- C. Lee, W. Yang and R. G. Parr, Phys. Rev. B: Condens. Matter Mater. Phys., 1988, 37, 785–789 CrossRef CAS.
- S. H. Vosko, L. Wilk and M. Nusair, Can. J. Phys., 1980, 58, 1200–1211 CrossRef CAS.
- P. J. Stephens, F. J. Devlin, C. F. Chabalowski and M. J. Frisch, J. Phys. Chem., 1994, 98, 11623–11627 CrossRef CAS.
- M. J. Frisch, G. W. Trucks, H. B. Schlegel, G. E. Scuseria, M. A. Robb, J. R. Cheeseman, G. Scalmani, V. Barone, B. Mennucci, G. A. Petersson, H. Nakatsuji, M. Caricato, X. Li, H. P. Hratchian, A. F. Izmaylov, J. Bloino, G. Zheng, J. L. Sonnenberg, M. Hada, M. Ehara, K. Toyota, R. Fukuda, J. Hasegawa, M. Ishida, T. Nakajima, Y. Honda, O. Kitao, H. Nakai, T. Vreven, J. A. Montgomery, Jr., J. E. Peralta, F. Ogliaro, M. Bearpark, J. J. Heyd, E. Brothers, K. N. Kudin, V. N. Staroverov, R. Kobayashi, J. Normand, K. Raghavachari, A. Rendell, J. C. Burant, S. S. Iyengar, J. Tomasi, M. Cossi, N. Rega, J. M. Millam, M. Klene, J. E. Knox, J. B. Cross, V. Bakken, C. Adamo, J. Jaramillo, R. Gomperts, R. E. Stratmann, O. Yazyev, A. J. Austin, R. Cammi, C. Pomelli, J. W. Ochterski, R. L. Martin, K. Morokuma, V. G. Zakrzewski, G. A. Voth, P. Salvador, J. J. Dannenberg, S. Dapprich, A. D. Daniels, Ö. Farkas, J. B. Foresman, J. V. Ortiz, J. Cioslowski and D. J. Fox, Gaussian 09, Revision E.01, Gaussian, Inc., Wallingford CT, 2009 Search PubMed.
- M. Schrader, R. Fitzner, M. Hein, C. Elschner, B. Baumeier, K. Leo, M. Riede, P. Bauerle and D. Andrienko, J. Am. Chem. Soc., 2012, 134, 6052–6056 CrossRef CAS PubMed.
- J.-L. Bredas, J. E. Norton, J. Cornil and V. Coropceanu, Acc. Chem. Res., 2009, 42, 1691–1699 CrossRef CAS PubMed.
- (a) C. A. Hunter and J. K. Sanders, J. Am. Chem. Soc., 1990, 112, 5525–5534 CrossRef CAS; (b) D. E. Janzen, M. W. Burand, P. C. Ewbank, T. M. Pappenfus, H. Higuchi, D. A. da Silva Filho, V. G. Young, J. L. Brédas and K. R. Mann, J. Am. Chem. Soc., 2004, 126, 15295–15308 CrossRef CAS PubMed; (c) I. McCulloch, M. Heeney, C. Bailey, K. Genevicius, I. MacDonald, M. Shkunov, D. Sparrowe, S. Tierney, R. Wagner, W. Zhang and M. L. Chabinyc, Nat. Mater., 2006, 5, 328–333 CrossRef CAS PubMed; (d) X. Feng, V. Marcon, W. Pisula, M. R. Hansen, J. Kirkpatrick, F. Grozema, D. Andrienko, K. Kremer and K. Müllen, Nat. Mater., 2009, 8, 421–426 CrossRef CAS PubMed; (e) J. Mei, Y. Diao, A. L. Appleton, L. Fang and Z. Bao, J. Am. Chem. Soc., 2013, 135, 6724–6746 CrossRef CAS PubMed; (f) A. Putta, J. D. Mottishaw, Z. Wang and H. Sun, Cryst. Growth Des., 2013, 14, 350–356 CrossRef; (g) H. Dong, X. Fu, J. Liu, Z. Wang and W. Hu, Adv. Mater., 2013, 25, 6158–6183 CrossRef CAS PubMed; (h) S. Melissen, T. Le Bahers, S. N. Steinmann and P. Sautet, J. Phys. Chem. C, 2015, 119, 25188–25196 CrossRef CAS.
- A. Di Carlo, F. Piacenza, A. Bolognesi, B. Stadlober and H. Maresch, Appl. Phys. Lett., 2005, 86, 263501 CrossRef.
- Y. Chen and I. Shih, J. Mater. Sci., 2009, 44, 280–284 CrossRef CAS.
- Y. Yuan, G. Giri, A. L. Ayzner, A. P. Zoombelt, S. C. B. Mannsfeld, J. Chen, D. Nordlund, M. F. Toney, J. Huang and Z. Bao, Nat. Commun., 2014, 5, 3005 Search PubMed.
- M. Nakamura and R. Matsubara, J. Photopolym. Sci. Technol., 2014, 27, 307–316 CrossRef.
- R. Hofmockel, U. Zschieschang, U. Kraft, R. Rödel, N. H. Hansen, M. Stolte, F. Würthner, K. Takimiya, K. Kern, J. Pflaum and H. Klauk, Org. Electron., 2013, 14, 3213–3221 CrossRef CAS.
Footnote |
| † Electronic supplementary information (ESI) available. See DOI: 10.1039/c6cp06431k |
| This journal is © the Owner Societies 2017 |


