Size-controlled growth and antibacterial mechanism for Cu:C nanocomposite thin films
Amjed
Javid
ab,
Manish
Kumar
 *a,
Seokyoung
Yoon
c,
Jung Heon
Lee
d and
Jeon Geon
Han
*a
aCenter for Advanced Plasma Surface Technology (CAPST), NU-SKKU Joint Institute for Plasma Nano-Materials (IPNM), Advanced Materials Science and Engineering, Sungkyunkwan University, Suwon, 440-746, Republic of Korea. E-mail: manishk@skku.edu; hanjg@skku.edu
bDepartment of Textile Processing, National Textile University, Faisalabad-37610, Pakistan
cSKKU Advanced Institute of Nanotechnology (SAINT), Sungkyunkwan University, Suwon, 440-746, Republic of Korea
dBiological & Nanoscale Materials Lab, Advanced Materials Science and Engineering, Sungkyunkwan University, Suwon, 440-746, Republic of Korea
First published on 22nd November 2016
Abstract
The interdependence of ‘size’ and ‘volume-fraction’ hinders the identification of their individual role in the interface properties of metal nanoparticles (NPs) embedded in a matrix. Here, the case of Cu NPs embedded in a C matrix is presented for their profound antibacterial activity. Cu:C nanocomposite thin films with fixed Cu content (≈12 atomic%) are prepared using a plasma process where plasma energy controls the size of Cu NPs (from 9 nm to 16 nm). An inverse relationship between the size-effect on antibacterial activity against Escherichia coli and Staphylococcus aureus bacteria is established through the real time monitoring of an aliquot by inductively coupled plasma mass spectrometry, which confirmed the inverse relationship of Cu ion release from the nanocomposite with varied Cu NP sizes. It was found that enhancing the total power density increases the plasma density as well as effective kinetic energy of the plasma species, which in turn creates a large number of nucleation sites and restricts the island kind of growth of Cu NPs. The mechanism of NP size-control is illustrated on the basis of ion density and nucleation and the growth regime of plasma species. This physical approach to NP size reduction anticipates a contamination-free competitive recipe of size-control to capping based chemical methods.
1. Introduction
Antibacterial coatings have attracted tremendous attention from researchers because of their excellent potential in the area of health care applications.1 The contamination of implants due to bacterial adhesion has been a major issue which can cause respiratory tract, urinary tract and bloodstream infections.2 The potential ability of bacteria to survive in numerous environments makes the common surfaces and materials the reservoirs of bacterial contamination and transmission of pathogenic microorganisms to the susceptible patients.3 In addition to biomedical devices and artificial implants, bacterial contamination is also a serious concern in contact lenses, textiles, and petroleum pipelines.4–7 The development of a biofilm due to bacterial colonization is minimized by the use of antibiotics. However, the prolonged use of antibiotics can induce higher bacterial resistance.8 Antibacterial nanocomposite films, because of their enhanced surface activity, can be a viable solution to prevent surfaces and implants from bacterial contamination.Several bactericidal materials such as quaternary ammonium salts, antibiotics and metal or metal oxide NPs are used to eradicate bacteria.9–12 The most investigated antibiotic having a broad spectrum of antibacterial activity is the novel metal Ag that has long been used in health care applications.2,13 However, Ag NPs have the drawback of uncontrolled release and persistence in the environment.14 Other inorganic NPs such as Au, TiO2, ZnO, Cu and CuO are also reported to have bacterial resistance.15–20 Among these, Cu is fascinating owing to its plasmonic properties as well as its cost-effectiveness in comparison to other novel metals. Cu and Cu2O nanocrystals are also reported to have interesting sensing properties.21 Cu and its compounds are also approved by the US Environmental Protection agency as antibacterial materials for touch surfaces.22 Polyurethane and silicone thin films loaded with Cu NPs show good potential to resist hospital acquired infections.18 The mesoporous Cu doped silica xerogels are reported to exhibit promising resistance against bacterial growth.23 However, as a choice of matrix, C is not much studied despite poor binding to Cu metals.
The surface activity of metal NPs increases with the decrease in size because of an enhanced surface to volume ratio.24 The frequently reported methods for the fabrication of noble metal NPs are chemical based and use the bottom-up approach.7,12,25 These methods can be harmful to the environment and human beings. For example, the use of dispersants, surfactants and chelating agents in chemical methods, to control size and prevent agglomeration, has raised concerns of environmental contamination.26 Further, the processing time in chemical based techniques is usually long, when the methods involve sol-ageing or thermal treatments for the stabilization or removal of by-products.27,28 Plasma based synthesis can be beneficial in this respect to overcome the above-mentioned limitations, since it is a relatively environmental friendly and fast technique to deposit nanocomposite thin films.29 However, the available plasma based studies of embedding metal NPs in the matrix lack investigation reports regarding antibacterial activity correlated with size at constant volume fraction.11,30 The control of NP size is performed with increasing metal content or is reported without mention of it.31 Thus the identification of whether the antibacterial activity is governed by the size of metal NPs or the increased volumetric metal content, is not clear in available reports. So, it is very important to distinguish the size dependent antibacterial activity of NPs at a constant metal content.
Here, we devise a facile, solvent-free and fast plasma based co-sputtering technique to fabricate Cu:C nanocoposite thin films with excellent antibacterial activity. By tailoring the plasma parameters, the size of Cu NPs embedded in a carbon matrix, is controlled at a fixed volume fraction of Cu. The effect of size dependence of Cu NPs on antibacterial activity against Gram positive and Gram negative bacteria is presented, and an antibacterial mechanism is provided through the real time diagnosis of nanocomposite–bacteria interactions using inductively coupled plasma mass spectrometry (ICP-MS).
2. Experimental
2.1 Synthesis of nanocomposite films
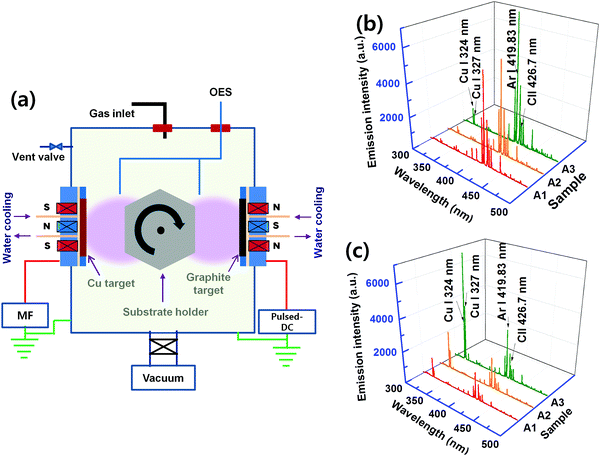
Cu:C nanocomposite thin films were deposited on Si wafer substrates (cleaned by acetone and ethanol by ultrasonication) using a plasma sputtering process. The schematic of the co-sputtering chamber is shown in Fig. 1(a). High purity (99.99%) graphite and copper targets (each of 4′′ diameter) were used. The co-sputtering process was carried out using Ar gas (99.99%). Two types of powers, pulsed-DC and middle frequency (40 KHz)-AC, are connected to the sputtering sources (located in front of each other) having graphite and copper targets, respectively. First, the deposition chamber is evacuated to 2 × 10⁻⁵ Torr base pressure with the help of rotary and turbomolecular pumps. The nanocomposite films were deposited on the substrates rotating between the two targets at a constant working pressure of 3 × 10⁻³ Torr. The films were deposited by co-sputtering at various values of power density for both graphite (7.2–20 W cm−2) and copper (0.0125–0.55 W cm−2) targets, as mentioned in Table 1.| Sample | A1 | A2 | A3 | A4 |
|---|---|---|---|---|
| Power density, graphite target (W cm−2) | 7.2 | 10 | 20 | 20 |
| Power density, Cu target (W cm−2) | 0.0125 | 0.15 | 0.55 | 1.062 |
| Cu atomic% | 11.84 | 11.99 | 12.04 | 20.3 |
2.2 Plasma diagnostics and characterization of nanocomposite films
The plasma characteristics were investigated by optical emission spectroscopy (OES) using a spectrometer (Acton spectra 500i) equipped with a CCD camera (PRIMAX Princeton Instrument). A surface profiler (KLA-Tencor, Alpha-Step IQ) was used to determine the deposition rate through film thickness measurements. By controlling the deposition time, the films were deposited for 5, 10 and 200 nm thicknesses. The morphology of Cu NPs in Cu:C nanocomposite films was characterized using a FESEM (JEOL JSM-6500F). The crystal structure of Cu nanoparticles was investigated by X-ray diffractometry (XRD) by using a Rigaku X-ray diffractometer, performed with Cu Kα source radiation (wavelength 1.5406 Å). To get insight into the chemical structure, the films were analyzed by X-ray photoelectron spectroscopy (XPS) using an ESCA 2000 Instrument (VG Microtech, UK) equipped with an Al Kα X-ray source. The deconvolution of core level spectra was performed by means of XPSPEAK4.1 software.2.3 Antibacterial activity testing
The antibacterial activity of Cu:C nanocomposite films was evaluated for E. coli ATCC 1129 and S. aureus ATCC 6538. A sample with no film was used as control. The bacteria were inoculated in a fresh medium of Luria-Bertani broth and incubated in a shaking incubator at 37 °C for 4.5 h. The inocula were first diluted (for standardization) to obtain an optical density of 0.5 at 600 nm. Further, the inocula were serially diluted to 10−2 to get the required colony forming units (CFU) per ml. The samples (1.5 cm × 1.5 cm) were put in the six-well plates. 50 μl volume of diluted inoculum (∼106 CFU per ml) was dropped on each film and covered with glass cover slips to incubate for 4 h. Then, each film was washed with 2 ml of PBS solution. After serial dilution up to 10−4, 50 μl of each bacterial culture was pipetted out and spread on the agar plates to count the number of colonies. All the samples were tested three times to re-affirm the antibacterial activity. The antibacterial activity (E) is calculated using the following expression: | (1) |
The interaction of the nanocomposite with bacteria is monitored by inductively coupled plasma mass spectrometry (ICP-MS, Agilent 7500). The inoculum, obtained after washing of a bacterial aliquot on the film (after 4 h incubation, the same as used for quantitative antibacterial activity) was used for the ICP-MS study. Measurements are carried out three times and then averaged for the quantitative estimation of ion extraction.
3. Results and discussion
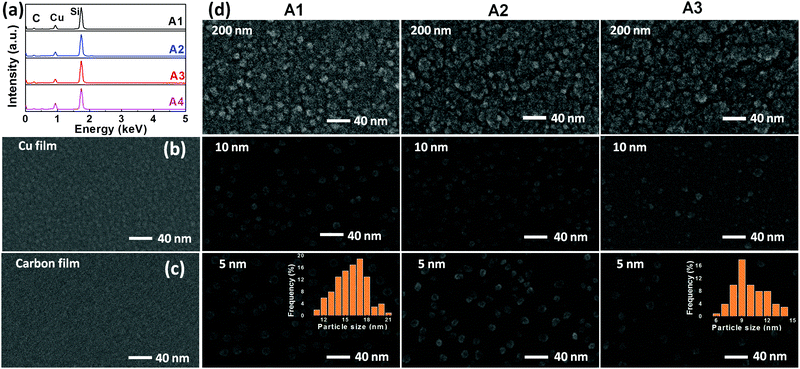
In order to understand the plasma energy dependence on the nucleation and growth of nanocomposite films, it is important to investigate the correlation between the input energy (power) and the plasma species. Since the present process involves co-sputtering from the targets located at different positions, plasma diagnostics is performed at two different substrate positions; first, when the substrate is facing a graphite target and then, facing a Cu target. The corresponding OES spectra are shown as (b) and (c) in Fig. 1. The dominant spectral lines are indexed to the corresponding electronic transitions. It can be seen that the excitation of Ar and Cu species increases with the increase of the applied power density. This is because the increase in power density increases Ar excitation, which in turn increases the sputter yield of graphite and Cu targets. It is confirmed by the increase in the deposition rate of both C and Cu elements with the increase in power density. The higher excitation of Ar species in the plasma facing graphite target as compared to the Cu target is attributed to a higher input power to the graphite target. Therefore, the higher kinetic energy of ions, rushing towards the graphite target, leads to a higher sputtered species of C. At this point, the small spectral lines of Cu are also found, exhibiting that a few Cu species are also present at this location.The Cu:C nanocomposite films are synthesized by varying the input power supplied to both Cu and graphite targets. The values of power densities (applied to targets) are adjusted in such a way that Cu content in the nanocomposite films remains constant in all films. This is achieved by individually adjusting the sputtered contents of Cu/C at various power density values, as mentioned in Table 1. The atomic% of Cu is accessed by the EDX study and is calculated in % by dividing the atomic concentration of Cu by the total atomic concentrations of Cu and C. The EDX patterns of selected samples are shown in Fig. 2(a) with fixed Cu content, which demonstrate a fixed Cu content (12 atomic%) in samples A1, A2 and A3 with increasing total power densities. EDX of one more sample A4 is also shown which contains higher Cu atomic% (20.3). Samples of the same Cu atomic% were particularly chosen to observe the morphology variation as a function of thickness and varied power densities. For comparison of nanocomposite films with individual Cu/C elements, the representative morphological features of Cu (deposited using power density 0.0125 W cm−2) and C (deposited using 7.2 W cm−2 for the graphite target) deposition (for the time corresponding to 5 nm thickness) are also shown as FESEM images (b) and (c) in Fig. 2. These single element films display continuous deposition of Cu and C, respectively. The morphology variation of nanocomposite films A1, A2 and A3 (each with different thicknesses i.e. 5 nm, 10 nm and 200 nm) are shown in Fig. 2(d). It is clear that in comparison to deposition of individual elements, the morphology of nanocomposite films is distinctly different. For all conditions (increasing thickness and increased total power density), the micrographs of nanocomposite films exhibit the formation of Cu NPs embedded in the C matrix with uniform and homogenous distribution of Cu NPs in nanocomposite films. Interestingly, it is noted that the size of Cu NPs decreases upon increasing the power density, whereas there is no significant variation in size with the increase of thickness. In order to quantify the size variation of Cu NPs, the diameter of the NPs is measured in samples (of 5 nm film thickness) and the size distribution is shown in the inset of the micrographs of A1 and A3. The mean diameter is calculated and found to be 16 nm for a lower power density (nanocomposite A1) and 9 nm for a higher power density (nanocomposite A3). Thus FESEM results conclude that the increase of power density induces the size decrease of Cu NPs embedded in the C matrix.
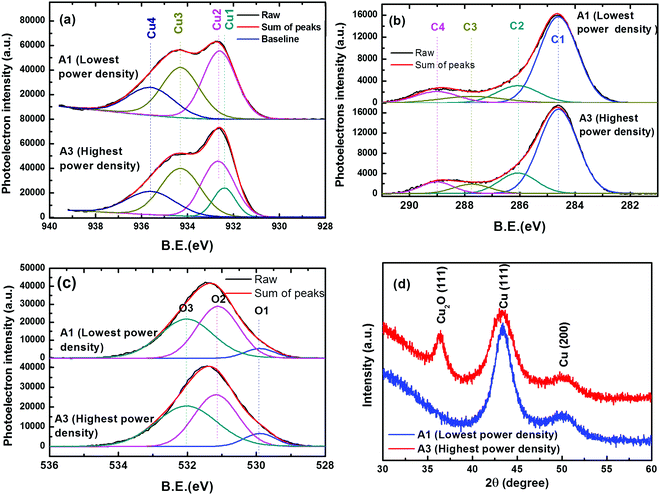
For the extreme power density conditions, samples of the same Cu atomic% were further analyzed for chemical and crystallographic information. Chemical information of Cu, C and O elements was obtained by the core level spectral analysis of high resolution XPS results. Fig. 3(a)–(c) represent the deconvoluted components of the core level spectra of Cu-2p3/2, C-1s and O-1s, respectively. The Cu-2p3/2 peak was deconvoluted in the four components Cu1 (binding energy B.E. 932.4 eV), Cu2 (B.E. 932.6 eV), Cu3 (B.E. 934.3 eV) and Cu4 (B.E. 935.5 eV). These components correspond to Cu2O, Cu, CuO and Cu bonding with hydrocarbons, in agreement to the standard data32–35 in the literature. The C-1s peak is deconvoluted into 4 components, named as C1 (B.E. 284.6 eV), C2 (B.E. 286.07 eV), C3 (B.E. 289.0 eV) and C4 (B.E. 287.74 eV). Out of these components C1 corresponds to graphitic C, whereas C2 corresponds to hydrocarbons bonding with Cu2O. C3 and C4 components are due to carbon bonding with H and O. The O-1s core level peak is deconvoluted into three components O1 (B.E. 529.9 eV), O2 (531.1 eV) and O3 (532 eV), corresponding to O bonding with Cu2+, Cu+ and physisorbed O, respectively. Comparing the different chemical states of Cu, it is evident that the majority is in the zerovalent state owing to the presence of metallic Cu. The chemical bonding of Cu with oxygen and hydrocarbons is mainly due to atmospheric exposure. It is interesting to observe that in the sample A1 prepared at lowest power density, there is no signature of Cu2O, whereas the oxide formation is apparent in sample A3 prepared at a higher power density.
The crystalline information of Cu nanoparticles is obtained through the XRD analysis of samples A1 and A3, as shown in Fig. 3(d). Since the Cu content in the films is too small, in order to get clear diffraction peaks, films of 1.5 μm thickness were used for XRD analysis. For both A1 and A3 samples, the diffraction peaks observed at 43.3° and 50.4° 2θ values are attributed to the (111) and (200) reflection planes of the face centered cubic phase of Cu,36 respectively. In sample A3, an additional peak is observed at the 2θ value of 36.4°, owing to the (111) plane of cubic Cu2O. The Cu2O phase formation is due to the oxide layer on the surface of Cu NPs. It can be explained on the basis of the size variation of Cu NPs. The average crystallite size (D) of Cu was determined using Debye–Sherrer's relation from the (111) peak of Cu. The crystallite size for lower and higher power density conditions are calculated to be 4.41 nm and 3.02 nm, respectively. These observations are in agreement with NP size reduction at a higher power density as observed in FESEM micrographs. Sample A3 has Cu NPs with smaller size and higher surface activity, which are easily prone to oxidation upon air exposure. However, the absence of the Cu2O peak in the A1 sample shows that the Cu NPs with a larger size are relatively stable to air oxidation because of the lower surface activity. These results are in agreement with those observed in the core level spectra of Cu2p3/2. It should be noted here that the formation of Cu2O is not a problem for antibacterial applications as it is reported to be highly reactive and can easily generate Cu ions.37
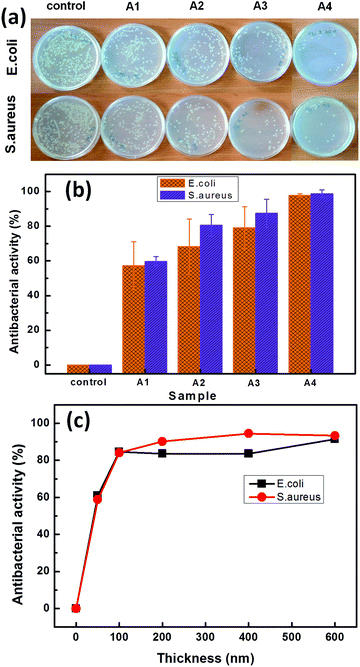
It should be noted that most of the hospital acquired infections (HAIs) are associated with S. aureus and it is financially beneficial to reduce the risk of HAIs by coating the touch surfaces with bacteria resistant materials.18 Three different types of Cu:C nanocomposite thin films (A1, A2, A3) with the same Cu atomic% and A4 (of higher Cu atomic%) are evaluated for antibacterial activity of NPs against S. aureus and E. coli bacteria, as shown in Fig. 4. Here, the eradication of bacterial colonies as an effect of interaction with nanocomposite films is shown in Fig. 4(a). Quantitative antibacterial activity as a function of power density conditions (b) and as a function of thickness variation of nanocomposite films (c) is also shown in Fig. 4. The observations depict that all Cu:C nanocomposite film coated samples exhibit a significantly higher antibacterial activity than that of the control as shown in Fig. 4(a). The films deposited at lower power density (A1) show lower antibacterial activity as compared to the films deposited at a higher power density (A3). The higher antibacterial activity of A3 as compared to condition A1 is attributed to the smaller size of Cu NPs having a larger surface to volume ratio and higher surface activity. Interestingly, here the atomic% of Cu is kept constant in all the films (A1–A3) to nullify the effect of this most influencing parameter and the only factor contributing maximally is the size of NPs. The smaller sized NPs with higher surface activity can have faster interaction with bacterial culture aliquots for higher disruption of DNA replication of bacteria. Sample A4 with increased Cu atomic% (∼20%) is also shown to exhibit the potential for Cu:C nanocomposite films to completely inhibit the growth of bacteria. Furthermore, it can be seen that the susceptibility of S. aureus to the Cu:C nanocomposite films is higher as compared to E. coli indicating the lower tolerance of S. aureus to the oxidative stress imposed by the Cu ions.38 The antibacterial activity of the nanocomposite film (A3) as a function of film thickness, as shown in Fig. 4(c) depicts an abrupt increase in antibacterial activity (∼50%) when the thickness changes from 0 to 50 nm. Upon increasing the thickness to 100 nm, the antibacterial activity reaches ∼84%. After that the change in antibacterial activity is not so significant and almost reaches saturation beyond 200 nm. The increase in antibacterial activity with thickness can be attributed to the higher number of Cu NPs in thicker films.
In order to obtain insight into the nanocomposite's interaction with a bacterial culture aliquot, ICP-MS was performed on the aliquot, as shown in Fig. 5. The ICP-MS method of metal ion detection provides high precision along with statistical power as compared to the conventional trace flux methods. This technique is the most reliable for the quantification of metals, metalloids and some non-metals because of its ability to measure a variety of samples with ease, a wide range of concentrations, low interferences and sensitivity to parts per trillion.39 The procedure of the ICP-MS study is schematically shown and quantitative results of Cu ion extraction in aliquots are shown. It is found that the release of Cu ions (1.186 μg g−1) from the films deposited at a higher power density (A3) is much higher (∼522%) as compared to that (0.227 μg g−1) from the lower power density (A1). This is the actual amount of Cu ions interacting with the bacteria to inhibit their growth. Since the atomic% of Cu is the same for A1–A3 films, the release of Cu ions is governed by the size of NPs. The films, deposited at a higher power density, have a smaller size and a large surface to volume ratio. Thus, their interaction with the surrounding medium is much higher which can easily solvate the Cu ions into the medium and can significantly enhance the antibacterial activity. It is reported that water and oxygen, while interacting with the Cu NPs, generate Cu ions through a standard corrosion process.40 The water molecules, upon interaction with the film can form a layer of Cu2O on the surface of Cu NPs, owing to its high reactivity, and can easily convert into Cu ions and release into the medium.37 In the present case, the development of a nano-sized layer of Cu2O on Cu NPs is due to atmospheric exposure. Therefore, owing to its good reactivity in aqueous solution, Cu2O releases Cu ions according to the following reaction:41
| Cu2O + 1/2O2 + 2H2O → 2Cu2+ + 4OH− |
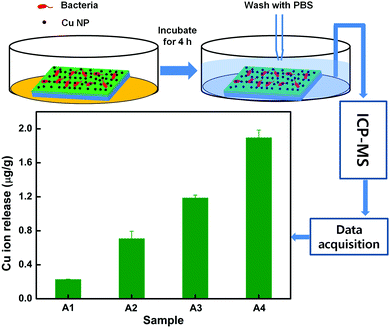 | ||
| Fig. 5 ICP-MS study of Cu ion release from the different samples upon interaction with the bacterial media. | ||
On account of Cu ion release by Cu2O itself, the antibacterial activity of nanocomposite films is insignificantly affected by Cu2O nano-sized layer formation on Cu NPs. The Cu ions are generated by Cu NPs to deposit on the cell surface and to introduce cell membrane damage through the Fenton process. According to several proposed mechanisms for antibacterial activity, the oxidative species (hydrogen peroxide, super-oxides) reduce the bacterial cell membrane integrity to leach out the lipopolysaccharides, membrane proteins and intracellular biomolecules.42 According to the Haber–Weiss reaction, the reduction of Cu2+ to Cu+ can catalyze the generation of OH radicals from H2O2via the following reactions:43
| O2˙− + Cu2+ → O2 + Cu+ | (2) |
| Cu+ + H2O2 → Cu2+ + OH− + OH˙ | (3) |
Now we explain the size control of Cu NPs by power density variation in the plasma process. The overall mechanism is summarized schematically in Fig. 6. The atoms sputtered from the target move towards the substrate. They nucleate on the substrate as a result of energy transformation to the substrate from various species e.g. sputtered atoms, ions, radicals, neutrals, electrons and photons.45 An atom can bind to the similar atom more comfortably rather than the atoms of different natures when cohesive energy surpasses adhesive energy. At a lower power density of the graphite target, the fewer number of sputtered carbon atoms can occupy a few points on the substrate in the initial stage of film deposition and the Cu atoms find enough empty space to nucleate. In the subsequent stage of deposition, Cu atoms already present on the substrate are available to the new Cu atoms to aggregate and to form NPs of bigger size as the number of carbon atoms due to the low sputter yield of the graphite target are insufficient to cover Cu atoms immediately. At a higher power density, the carbon atoms will first prefer to bind with the carbon atoms to form their own islands according to the Volmer–Weber film growth model46 and the surplus atoms will tend to mask the Cu atoms to lessen the availability of the exposed Cu atoms for aggregation, which can lead to the rapid generation of new nucleation centers for Cu atoms to aggregate. This can enhance the rate of generation of nucleation points, which can lead to the formation of smaller size Cu NPs. It should be noted that at elevated power density, the atoms having the higher kinetic energy, can rush to the substrate and nucleation can take place in a relatively random manner to enhance the probability of heterogeneous binding leading to the formation of smaller size NPs.
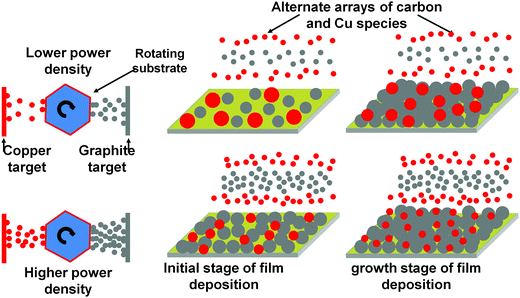 | ||
| Fig. 6 Schematic representation of the size variation of Cu NPs in the nanocomposite as an effect of plasma ion energies. | ||
4. Conclusion
This work presents the control of the size of Cu metal nanoparticles at a fixed metal content in nanocomposite thin films through plasma engineering of the co-sputtering process. The size of the Cu NPs embedded in a carbon matrix is varied from 9 to 16 nm by controlling the energy of ions in the plasma. The lower energy ions induce larger NPs having a relatively higher stability to air oxidation whereas the higher energy ions favour the stabilization of Cu NPs of smaller size, which display higher eradication of E. coli and S. aureus bacteria at a fixed metal content (12 atomic% Cu) in the nanocomposite due to the higher surface activity and non-bonding of Cu to the host C matrix. The concentration of Cu ions interacting with bacteria for smaller size NPs is higher as compared to the larger size NPs. The size dependent antibacterial activity of Cu NPs is explained on the basis of the release of Cu ions during interaction of the nanocomposite with bacteria.Acknowledgements
This study was supported by the R&D Program of ‘Plasma Advanced Technology for Agriculture and Food (Plasma Farming)’ through the National Fusion Research Institute of Korea (NFRI) funded by Government funds, the Global Development Research Center GRDC, a program of the Ministry of Science, ICT and Future Planning (MSIP, Grant No. 2011-0031643, 2nd stage 3rd year). It was also supported by the Korea Institute for Advancement of Technology (KIAT), which is funded by the Ministry of Trade, Industry & Energy (MOTIE, Grant No. N0000590).References
- M. Cloutier, D. Mantovani and F. Rosei, Trends Biotechnol., 2015, 33, 637 CrossRef CAS PubMed.
- V. B. Schwartz, F. Thétiot, S. Ritz, S. Pütz, L. Choritz, A. Lappas, R. Förch, K. Landfester and U. Jonas, Adv. Funct. Mater., 2012, 22, 2376 CrossRef CAS.
- M. Cloutier, R. Tolouei, O. Lesage, L. Lévesque, S. Turgeon, M. Tatoulian and D. Mantovani, Biointerphases, 2014, 9, 029013 CrossRef PubMed.
- S. He, P. Zhou, L. Wang, X. Xiong, Y. Zhang, Y. Deng and S. Wei, J. R. Soc., Interface, 2014, 11, 0169 CrossRef PubMed.
- J. F. Huang, J. Zhong, G. P. Chen, Z. T. Lin, Y. Deng, Y. L. Liu, P. Y. Cao, B. Wang, Y. Wei, T. Wu, J. Yuan and G. B. Jiang, ACS Nano, 2016, 10, 6464 CrossRef CAS PubMed.
- S. Sharaf, A. Higazy and A. Hebeish, Int. J. Biol. Macromol., 2013, 59, 408 CrossRef CAS PubMed.
- M. Zhang, Y. Zhao, L. Yan, R. Peltier, W. Hui, X. Yao, Y. Cui, X. Chen, H. Sun and Z. Wang, ACS Appl. Mater. Interfaces, 2016, 8, 8834 CAS.
- S. Rtimi, C. Pulgarin, R. Sanjines, V. Nadtochenko, J. C. Lavanchy and J. Kiwi, ACS Appl. Mater. Interfaces, 2015, 7, 12832 CAS.
- I. Banerjee, R. C. Pangule and R. S. Kane, Adv. Mater., 2011, 23, 690 CrossRef CAS PubMed.
- M. C. Jennings, K. P. C. Minbiole and W. M. Wuest, ACS Infect. Dis., 2015, 1, 288 CrossRef CAS PubMed.
- F. R. Marciano, D. A. Lima-Oliveira, N. S. Da-Silva, A. V. Diniz, E. J. Corat and V. J. Trava-Airoldi, J. Colloid Interface Sci., 2009, 340, 87 CrossRef CAS PubMed.
- J. Tang, Q. Chen, L. Xu, S. Zhang, L. Feng, L. Cheng, H. Xu, Z. Liu and R. Peng, ACS Appl. Mater. Interfaces, 2013, 5, 3867 CAS.
- V. Tiwari, M. K. Khokar, M. Tiwari, S. Barala and M. Kumar, J. Nanomed. Nanotechnol., 2014, 5, 1000246 Search PubMed.
- L. Geranio, M. Heuberger and B. Nowack, Environ. Sci. Technol., 2009, 43, 8113 CrossRef CAS PubMed.
- M. R. Bindhu and M. Umadevi, Mater. Lett., 2014, 120, 122 CrossRef CAS.
- R. K. Dutta, B. P. Nenavathu, M. K. Gangishetty and A. V. R. Reddy, Colloids Surf., B, 2012, 94, 143 CrossRef CAS PubMed.
- J. Li, J. E. J. Li, J. Zhang, X. Wang, N. Kawazoe and G. Chen, Nanoscale, 2016, 8, 7992 RSC.
- S. K. Sehmi, S. Noimark, J. Weiner, E. Allan, A. J. MacRobert and I. P. Parkin, ACS Appl. Mater. Interfaces, 2015, 7, 22807 CAS.
- A. Esteban-Cubillo, C. Pecharromán, E. Aguilar, J. Santarén and J. S. Moya, J. Mater. Sci., 2006, 41, 5208 CrossRef CAS.
- R. Wahab, F. Khan, Y. K. Mishra, J. Musarrat and A. A. Al-Khedhairy, RSC Adv., 2016, 6, 32328–32339 RSC.
- O. Lupan, V. Cretu, V. Postica, N. Ababii, O. Polonskyi, V. Kaidas, F. Schütt, Y. K. Mishra, E. Monaico, I. Tiginyanu, V. Sontea, T. Strunskus, F. Faupel and R. Adelung, Sens. Actuators, B, 2016, 224, 434–448 CrossRef CAS.
- S. Meghana, P. Kabra, S. Chakraborty and N. Padmavathy, RSC Adv., 2015, 5, 12293 RSC.
- X. Wu, L. Ye, K. Liu, W. Wang, J. Wei, F. Chen and C. Liu, Biomed. Mater., 2009, 4, 45008 CrossRef PubMed.
- M. S. Yaghmaee, B. Shokri and M. R. Rahimipour, Plasma Processes Polym., 2009, 6, 876 CrossRef.
- N. C. Bigall and A. Eychmüller, Philos. Trans. R. Soc., A, 2010, 368, 1385 CrossRef CAS PubMed.
- K. M. Kumar, B. K. Mandal, K. S. Kumar, P. S. Reddy and B. Sreedhar, Spectrochim. Acta, Part A, 2013, 102, 128 CrossRef PubMed.
- M. Kumar and G. B. Reddy, Phys. Status Solidi B, 2009, 246, 2232 CrossRef CAS.
- M. Kumar, S. Sandeep, G. Kumar, Y. K. Mishra, R. Philip and G. B. Reddy, Plasmonics, 2014, 9, 129 CrossRef CAS.
- K. Ostrikov, E. C. Neyts and M. Meyyappan, Adv. Phys., 2013, 62, 113–224 CrossRef CAS.
- Y. H. Chan, C. F. Huang, K. L. Ou and P. W. Peng, Surf. Coat. Technol., 2011, 206, 1037 CrossRef CAS.
- T. Peng, X. Xiao, W. Wu, L. Fan, X. Zhou, F. Ren and C. Jiang, J. Mater. Sci., 2012, 47, 508 CrossRef CAS.
- C. D. Wagner, Discuss. Faraday Soc., 1975, 60, 291 RSC.
- J. P. Tobin, W. Hirschwald and J. Cunningham, Appl. Surf. Sci., 1983, 16, 441 CrossRef CAS.
- T. Nakamura, H. Tomizuka, M. Takahashi and T. Hoshi, J. Surf. Sci. Soc. Jpn., 1995, 16, 515 CrossRef CAS.
- J. G. Dillard and L. T. Taylor, J. Electron Spectrosc. Relat. Phenom., 1974, 3, 455 CrossRef CAS.
- D. Deng, Y. Jin, Y. Cheng, T. Qi and F. Xiao, ACS Appl. Mater. Interfaces, 2013, 5, 3839 CAS.
- K. Delgado, R. Quijada, R. Palma and H. Palza, Lett. Appl. Microbiol., 2011, 53, 50 CrossRef CAS PubMed.
- S. Chen, Y. Guo, H. Zhong, S. Chen, J. Li, Z. Ge and J. Tang, Chem. Eng. J., 2014, 256, 238 CrossRef CAS.
- J. A. L. Figueroa, C. A. Stiner, T. L. Radzyukevich and J. A. Heiny, Sci. Rep., 2016, 6, 20551 CrossRef CAS PubMed.
- H. Palza, R. Quijada and K. Delgado, J. Bioact. Compat. Polym., 2015, 30, 366 CrossRef CAS.
- X. Xia, C. Xie, S. Cai, Z. Yang and X. Yang, Corros. Sci., 2006, 48, 3924–3932 CrossRef CAS.
- A. K. Chatterjee, R. Chakraborty and T. Basu, Nanotechnology, 2014, 25, 135101 CrossRef PubMed.
- H. Palza, Int. J. Mol. Sci., 2015, 16, 2099 CrossRef CAS PubMed.
- J. A. Lemire, J. J. Harrison and R. J. Turner, Nat. Rev. Microbiol., 2013, 11, 371–384 CrossRef CAS PubMed.
- J. G. Han, J. Phys. D: Appl. Phys., 2009, 42, 043001 CrossRef.
- Y. C. Zheng, S. Yang, X. Chen, Y. Chen, Y. Hou and H. G. Yang, Chem. Mater., 2015, 27, 5116 CrossRef CAS.
| This journal is © the Owner Societies 2017 |

