Self-assembling, reactivity and molecular dynamics of fullerenol nanoparticles†
Milan
Vraneš
*a,
Ivana
Borišev
a,
Aleksandar
Tot
a,
Stevan
Armaković
b,
Sanja
Armaković
a,
Danica
Jović
a,
Slobodan
Gadžurić
a and
Aleksandar
Djordjevic
*a
aUniversity of Novi Sad, Faculty of Sciences, Department of Chemistry, Biochemistry and Environmental Protection, Trg Dositeja Obradovića 3, 21000 Novi Sad, Serbia. E-mail: aleksandar.djordjevic@dh.uns.ac.rs; milan.vranes@dh.uns.ac.rs
bUniversity of Novi Sad, Faculty of Sciences, Department of Physics, Trg Dositeja Obradovića 3, 21000 Novi Sad, Serbia
First published on 22nd November 2016
Abstract
In this work structuring of water and insight into intermolecular interactions between water and fullerenol are studied throughout the process of forming nanoagglomerates at different temperatures applying both experimental and computational approaches. The obtained fullerenol nanoparticles (FNPs) are firstly characterized using dynamic light scattering, atomic force microscopy and transmission electron microscopy. The density, electrical conductivity and dynamic viscosity of aqueous fullerenol solutions are measured in the temperature range of 293.15 to 315.15 K. From the experimental density results other important thermodynamic values, such as apparent molar volumes and the partial molar volumes of water and fullerenol, are also calculated. To support the conclusion derived from the experimental density and calculated volumetric parameters, and to better understand the nature of the interactions with water, molecular dynamics simulations and radial distribution functions are also employed.
Introduction
Since their discovery fullerenes have found a broad spectrum of applications in various technologies and scientific fields such as materials science, medicine, pharmacology, cosmetics, mechanics, mechanical engineering, electronics, optics or the food industry.1–3 One of the main disadvantages of fullerene C60 is its poor solubility in water which is found to be only 1.3 × 10⁻¹¹ g dm−3. Derivatization of fullerene C60 results in numerous products much more soluble in either polar or non-polar solvents. One group of these soluble derivatives is fullerenols, hydroxyl derivatised fullerenes Cn (n = 60, 70, 78, 84). Fullerenol, besides hydroxyl groups C60(OH)x (2 ≤ x ≤ 44), also contains oxygen in the form of a keto or ether group and depending on the synthesis pathway, fullerenol can also be found in the form of a salt, usually a sodium one, [(C60(OH)xOy)](ONa)z (x + y + z ≥ 24).4–9The solubility of fullerenols in water increases with the increasing number of hydroxyl groups. In comparison to other fullerene derivatives, fullerenols so far expressed the greatest potential for possible applications in medicine and pharmacy.10 The role of FNPs as potential nanocarriers of biologically active components, e.g. anticancer drug doxorubicin, has been reported in two papers,11,12 however the available literature data on the detailed biological, chemical or physical properties of fullerenol are rather scarce and further in-depth investigation is required. Structuring and self-assembling of FNPs in aqueous solutions are of great importance not just because numerous drug formulations are in the form of aqueous solutions, but also because they are about to be applied in the vascular system, wherefrom depending on their size they will further be differently metabolised.13
The goal of this study was to obtain an insight into intermolecular interactions between water and fullerenol throughout the process of forming stable nanoagglomerates applying both experimental and computational approaches. In order to compare the local reactivity properties of fullerenol molecule C60(OH)24 with those of pure C60 we performed density functional theory (DFT) calculations, calculated quantum molecular descriptors, and created molecular electrostatic potential (MEP) and average local ionization energy (ALIE) surfaces. To support our conclusion derived from the experimental density, viscosity measurements, electrical conductivity and calculated volumetric parameters, and to better understand the nature of the interactions with water, molecular dynamics (MD) simulations and radial distribution functions (RDFs) were also employed.
Materials and methods
Synthesis of fullerenol nanoparticles
Polyanionic fullerenol nanoparticles were prepared using a two-step synthesis method starting from fullerene C60 (mass fraction purity, ω = 0.998, MER). In the first step fullerene is brominated in the presence of a catalyst, FeBr3, in order to obtain a symmetric polybrominated derivative, C60Br24.14 In the next step, bromine atoms of C60Br24 were substituted with hydroxyl groups in alkaline media.15 The obtained substance in the form of a powder was dissolved in deionized water and the solutions with different FNP concentrations were used in the further work.DLS measurement conditions
The measurements were conducted on a Zetasizer Nano ZS instrument (Malvern Instruments Inc, UK). All measurements were performed in triplicate, at a wavelength of 633 nm and a measurement angle of 173° (backscatter detection) in an aqueous solution at room temperature.AFM measurement conditions
Surface topography and phase images were simultaneously acquired in standard AFM tapping mode using a commercial SNC (Solid Nitride Cone) AFM probe (NanoScience-Team Nanotec GmbH), with the tip radius lower than 10 nm. Highly orientated pyrolytic graphite (HOPG) was used as a surface. A Multimode quadrex SPM with a Nanoscope IIIa controller (Veeco Instruments, Inc.) operated under ambient conditions was used.TEM measurement conditions
Transmission electron microscopy was conducted on a JEM 1400 microscope operating at an accelerating voltage of 120 kV. The sample of an aqueous solution of FNPs was applied to copper grid 300 meshes, dried at room temperature and measured.Densimetry
A vibrating tube Rudolph Research Analytical DDM 2911 densimeter with an accuracy and precision of ±0.00001 g cm−3 was used for density measurements in the temperature range of 293.15 to 313.15 K in the molality range up to 0.01311 mol kg−1 of fullerenol. The standard uncertainty of determining the density is less than 8.2 × 10⁻⁴ g cm−3. The instrument was thermostated within ±0.01 K and viscosity was automatically corrected. Before each series of measurements, calibration of the instrument was performed at the atmospheric pressure using ambient air and bidistilled ultra-pure water in the same temperature range. Each experimental density value is the average of at least three measurements at selected temperatures. Repeated experimental measurements showed reproducibility within 0.01% and an average value is presented in this paper.Viscosity
Viscosity measurements of the binary mixtures were performed using an Ubbelohde viscosimeter by measuring the flow rate of the liquid in the molality range up to 0.03724 mol kg−1 of fullerenol. The viscosimeter was calibrated using 0.1 mol dm−3 KCl solution (NIST reference) and bidistilled deionized water in the temperature range of 293.15 to 313.15 K. The viscosimeter was filled with experimental liquid and placed vertically in a glass sided thermostat maintained constant at ±0.01 K, with a standard uncertainty of controlled temperature of ±0.02 K. After thermal equilibrium is attained, the flow time of liquids was recorded using a digital stopwatch with an accuracy of ±0.01 s. The presented results were obtained as the mean value of at least ten viscosity measurements. The relative standard uncertainty of the determination of the viscosity using the Ubbelohde viscosimeter was found to be less than 1%.Electrical conductivity
The measurements of the electrical conductivity of fullerenol binary mixtures with water were carried out in the temperature range of 293.15 to 313.15 K in a Pyrex-cell with platinum electrodes on a conductivity meter Jenco 3107 using DC signals within (0.00098 to 0.04894) mol kg−1 of fullerenol. The relative standard uncertainty for electrical conductivity was less than 1.5%. The experimental cell was calibrated with standard 0.1000 mol dm−3 KCl solution by the same experimental procedure. The conductometric cell with a total volume of 14 cm3 was initially dried in the atmosphere of nitrogen and thermostated for twenty minutes with the external flow with an accuracy of ±0.01 K. At least ten measurements were performed at 5 s intervals, in order to eliminate the self-heating and ionization in the electrodes. The resulting cell constant amounted to 1.0353 cm−1, and it was checked from time to time to control any possible evolution. All the obtained experimental values represent the mean of three measurements.Computational methods
DFT calculations of C60 and fullerenol molecule C60(OH)24 were conducted using the Jaguar 9.0 program, as implemented in Schrödinger Materials Science Suite 2015-4.16,17 Geometry optimizations were performed by employing the B3LYP exchange–correlation functional18 with the 6-31G(d) basis set. Vibrational analysis was conducted at the same level of theory to ensure that true ground states were found, which were characterized by the absence of imaginary frequencies.In order to investigate the interactions of C60 and C60(OH)24 with water molecules molecular dynamics simulations with Desmond program,19–22 as implemented in Schrödinger Material Science Suite 2015-4, were performed as well. Modelling of systems for MD simulations was done in the following way. In order to deal with stabilized buckyball structures, we have extracted the coordinates of C60 and C60(OH)24 as obtained at the B3LYP/6-31G(d) level of theory. As already pointed out, these molecular geometries are true ground states, as shown by vibrational analysis. Furthermore, one system for MD simulations was obtained by placing of one molecule of C60 in a cubic box with ∼3000 water molecules, while the other system was obtained by placing one molecule of C60(OH)24 in a cubic box with ∼3000 water molecules.
Concerning the setup of MD simulations, an optimized potential for liquid simulations (OPLS) 2005 force field23 was employed. An isothermal–isobaric (NPT) ensemble class was used with temperature set to 300 K and pressure set to 1.01325 bar. The simulation time was 5 ns. In order to perform accurate and efficient evaluation of long-range electrostatics, a smooth particle mesh Ewald method24 has been applied. Short range interactions have been treated by the cut off approach with the cut off radius set to 12 Å. In the first 100 ps of simulation the system was optimized within the canonical (NVT) ensemble in order to relax it. Generic force field charges have been used. A simple point charge (SPC) solvent model25 was used for the modeling of solvent. In order to initially validate the use of the OPLS 2005 force field for C60 and C60(OH)24 we have also compared geometrical parameters as obtained by the B3LYP/6-31G(d) and force field method using the MacroModel program.26 The results are tabulated in Tables S8–S11 of the ESI.† To initially investigate the influence of temperature on the structuring of FNPs, a system consisting of 32 C60(OH)24 molecules has been simulated with the same aforementioned parameters, but at two temperatures.
Results and discussion
Characterization of fullerenol nanoparticles
Polyanionic fullerenol nanoparticles (FNPs) were characterized using dynamic light scattering (DLS), atomic force microscopy (AFM) and transmission electron microscopy (TEM).DLS was used for the determination of the hydrodynamic size of analyzed samples and for the measurements of the surface charge (zeta potential) the electrophoretic light scattering technique was used. Fig. 1a presents the particle size distribution by the number of FNPs in an aqueous solution and in Fig. 1b the results of zeta potential measurements of FNPs in an aqueous solution at pH = 6.5 are shown.
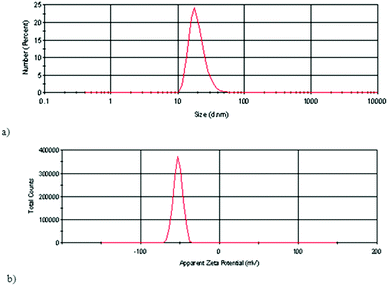 | ||
| Fig. 1 (a) Particle size distribution by the number of FNPs in aqueous solution. (b) Zeta potential (ζ) of FNP aqueous solution at pH = 6.5. | ||
The results of DLS measurements of particle size distribution by the number of FNPs in an aqueous solution showed that most of the particles have sizes within 10 to 40 nm, with 25% of the particles having a hydrodynamic radius of 18 nm (Fig. 1a). The mean zeta potential value of the analysed FNP aqueous solution was −53 mV (Fig. 1b). The theoretical model, for example, obtained in a computer simulation27 has shown that in a water cluster of 7 fullerenol molecules, the fullerenol molecules are organised to give a structure with the minimal potential energy, taking the form of a slightly deformed pentagonal bipyramid.
The morphology and structural features of FNPs in aqueous solution were evaluated using AFM.
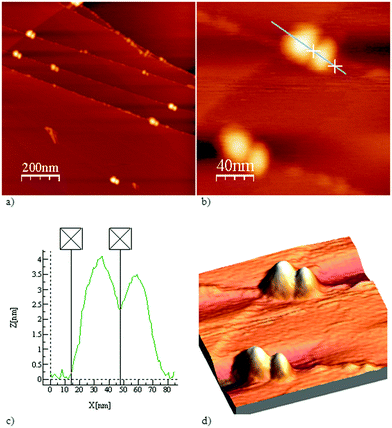
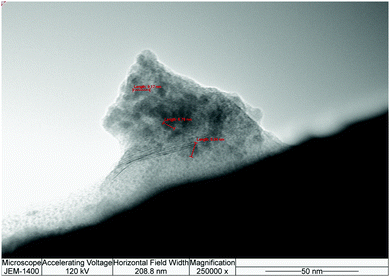
The results of AFM measurements of the aqueous FNP solution showed inhomogeneous sample patterns (Fig. 2a). The nanoparticle presented in Fig. 2b has a size of 63 nm and consists of two smaller particles with dimensions of 30 nm and 33 nm, and a height of 4 nm (Fig. 2c). The fullerenol nanoparticles are distributed on HOPG terraces indicating their polarity, which is in accordance with the zeta potential measurements and data studies.28 The 3D morphology of fullerenol nanoparticles on HOPG is presented in Fig. 2d. The TEM measurement results in Fig. 3 present fullerenol nanoparticles with sizes ranging from 6 to 9 nm that are assembled into bigger agglomerates of approximately 80 nm.
These results are consistent with previously published measurements.29–31
Physicochemical properties of aqueous solutions of fullerenol
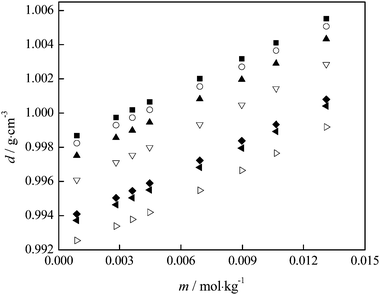 | ||
| Fig. 4 Variation of {fullerenol + H2O} density with fullerenol molality at different temperatures: T = (■) 293.15; (○) 295.15; (▲) 298.15; (▽) 303.15; (◆) 309.15; (◀) 310.15; (▷) 313.15 K. | ||
From the experimental densities, other important thermodynamic values (the apparent molar volumes, Vϕ, the partial molar volumes of water, V1, and fullerenol, V2) were calculated using the procedure described elsewhere.32,33
| η = (Kt − L/t)d | (1) |
Using the values of Vϕ from Table S1 (ESI†), the apparent molar volume at infinite dilution, V0ϕ, can be derived by applying Masson's equation34 (Fig. 7):
 | (2) |
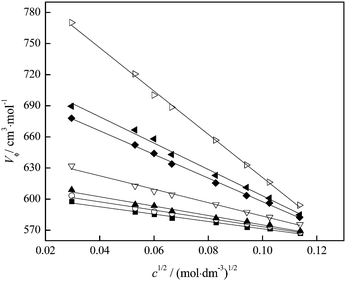 | ||
| Fig. 7 Variation of the apparent molar volume with fullerenol concentration at different temperatures: T = (■) 293.15; (○) 295.15; (▲) 298.15; (▽) 303.15; (◆) 309.15; (◀) 310.15; (▷) 313.15 K. | ||
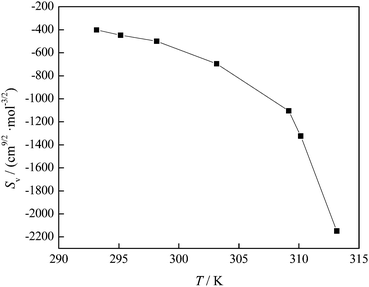
The negative values of SV indicate weak solute–solute interactions in the investigated solution. The variation of the SV coefficient with temperature presented in Fig. 8 indicates that at temperatures above 309.15 K the SV value rapidly decreases and interactions between FNPs weaken.
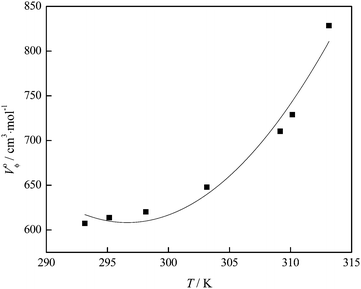
From the calculated limiting apparent molar expansibility, E0ϕ, fullerenol structure-making properties can be observed. This value can be obtained from the temperature dependence of the apparent molar volumes at infinite dilution (Table S3, ESI†) using the equation of the second order (Fig. 9).
The values of E0ϕ presented in Table S7 (ESI†) were obtained using the following equation:
 | (3) |
Using Heppler's equation:35
 | (4) |
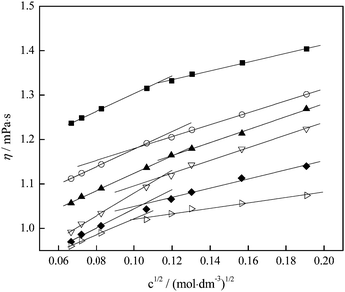
The experimental results of the viscosity as a function of fullerenol molality are presented in Fig. 5 and tabulated in Table S2 (ESI†). The analysis of the plot shows two distinct regions, one at lower concentrations of fullerenol down to 0.01 mol dm−3 and another one at higher concentrations. At low concentrations the viscosity increases exponentially with increasing fullerenol concentration. After reaching the concentration of 0.01 mol dm−3 fullerenol, the content did not greatly increase the viscosity. This indicates the different structural organizations of fullerenol molecules in aqueous solutions above and below the mentioned concentration, which is in accordance with the results of the volumetric measurements.
In order to apply the Jones–Dole's equation,36 reduced viscosity was fitted as a function of FNP concentration:
 | (5) |
 term is identical to those obtained from a limiting-law theory of long-range electrostatic interactions in a dielectric continuum37 and coefficient B was found to be an additive property of ions and gives a useful measure of ion–solvent interactions. All the coefficients are listed in Table S5 (ESI†).
The criterion to describe the structure-making or structure-breaking tendency in the system is the variation of coefficient B with temperature, dB/dT. The negative value of dB/dT indicates strong interactions between solute and water molecules, which further strengthen with temperature, or structure-making features.
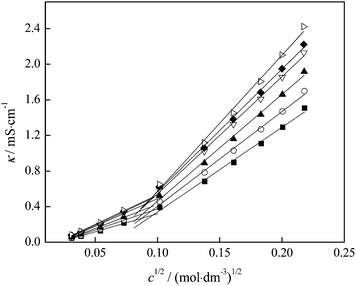
Electrical conductivity (κ) measurements can be used in order to discuss the strength of ion–ion interactions and ion pair formation in the system, however we applied these to our system in which we observed interactions between FNPs in aqueous solution. The variation of electrical conductivity from Table S4 (ESI†) with fullerenol concentration is presented in Fig. 6, while the molar conductivity of binary mixtures fullerenol–water as a function of fullerenol molality in the temperature range of 293.15 to 313.15 K is presented in Table S6 (ESI†).
In Fig. 6 an inflection point can be observed at all temperatures indicating two trends in electrical conductivity – before and after the concentration value of 0.01 mol dm−3. It is known that the presence of the inflection point indicates the formation of the agglomerates in the investigated system. In order to better understand the behaviour of our substance in water and the formation of the agglomerates, we applied the so-called “critical” concentration of fullerenol as a function of temperature and presented the results in Fig. 11.
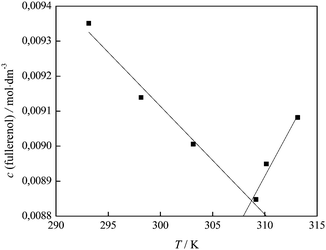 | ||
| Fig. 11 Variation of the fullerenol concentration when self-association is observed with temperature. | ||
In Fig. 11 two trends are clearly distinguished: up to a temperature of 309.15 K, where FNP agglomerates are formed even at lower concentrations, and after that temperature where the formation of agglomerates is less favored. Here the investigated system is in the state of dynamic equilibrium, which means that agglomerates of different sizes are interchangeable. Primary percolation clusters31 of several nanometers may exist as such or further agglomerate, thus forming a bigger secondary cluster31 as confirmed by DLS, AFM and TEM results. The interaction between molecules within the primary cluster is much stronger than those between primary clusters themselves and is in agreement with the results obtained for SV, which was a negative value.
From the equation:
| Λm = κ/c | (6) |
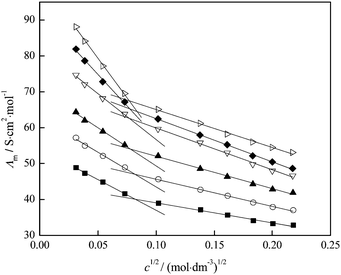 | ||
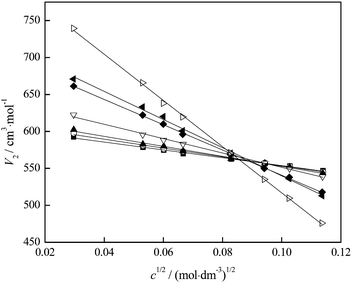
| Fig. 12 Variation of molar conductivity with c1/2 of fullerenol at different temperatures: T = (■) 293.15; (○) 298.15; (▲) 303.15; (▽) 309.15; (◆) 310.15; (▷) 313.15 K. | ||
By the extrapolation of the linear part of the fit at the concentrations below 0.01 mol dm−3 the limiting molar conductivity value, Λ0, is obtained.
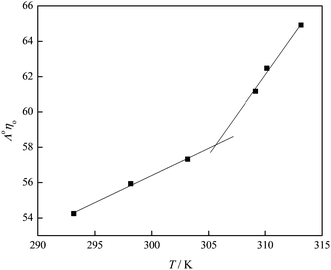
Structuring of water molecules and their change with temperature can be determined using Walden's rule, which represents the change in the so-called Walden's product (Λ0η0) with temperature.36,38 In Fig. 13, the Walden's product is plotted versus temperature and the positive value of the slope indicates the structure-making properties of the investigated fullerenol. Different trends of the Walden's product with temperature before and after the temperature of 309.15 K, which can be seen in Fig. 13, also indicate differences in the structural organization of the system before and after that temperature. An increase of the temperature reduces the number of water molecules around the fullerenol consequently decreasing local viscosity. Thus, the electrical conductivity of the system increases at higher temperatures.
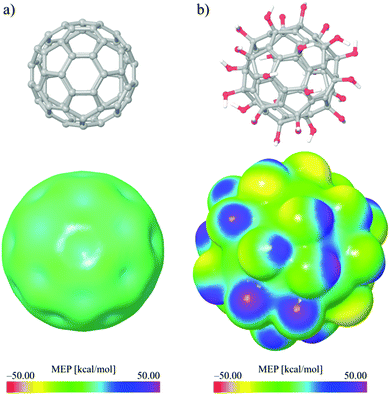
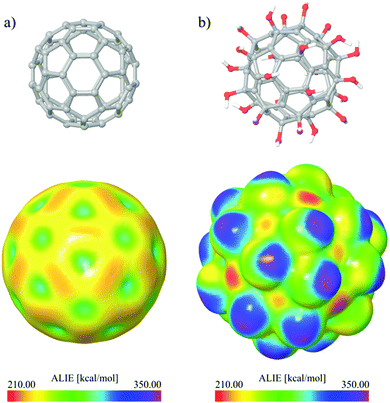
Computational studies of fullerenol
Quantum molecular descriptors related to the charge distribution are of great importance as they could provide important details regarding the local reactivity properties of the investigated molecules. In this work the local reactivity properties of C60 and C60(OH)24 were compared using MEP and ALIE surfaces, so the influence of C60 modifications with –OH groups could be understood better. In order to make comparisons of MEP and ALIE surfaces possible, the same scale range has been used for C60 and C60(OH)24. Representative MEP and ALIE surfaces of C60 and C60(OH)24 are presented in Fig. 14 and 15, respectively.The MEP surface of C60(OH)24 significantly differs from the MEP surface of pure C60. The minimal and maximal values of MEP drastically increase. Namely, the minimal value of MEP increases more than twenty times (from around −1 to −30) kcal mol−1, while the maximal value of MEP increases almost four times (from ∼14 to 47.32) kcal mol−1. The presented MEP results indicate improvements of C60(OH)24 reactive properties due to electrostatic interactions. According to the obtained results presented in Fig. 15 for pure C60 the negative electrostatic potential is located at bonds connecting two hexagons, while this is not the case for FNPs (Fig. 15b), for which the negative electrostatic potential is located at oxygen atoms.
To determine the sites of the molecule appropriate for the electrophilic attacks, however, it is better to use the concept of ALIE which is defined as a sum of orbital energies weighted by the orbital densities. ALIE values provide energetic measure of how easy the electrons can be removed from the molecule location and it is especially useful for the assessment of reactivity when mapped to the electron density surface.33,39
Fig. 15 shows representative ALIE surfaces of C60 and C60(OH)24. In the case of ALIE surfaces presented in Fig. 15, the red color corresponds to the lowest ALIE values of ∼210 kcal mol−1 and determines the molecule sites where electrons are least tightly bound. On the other hand the purple color corresponds to the highest ALIE values of ∼350 kcal mol−1 and determines the molecule sites where electrons are most tightly bound. Inspection of Fig. 15 indicates that functionalization of C60 with OH groups significantly decreases the lowest ALIE values, from ∼223 kcal mol to ∼210 kcal mol−1, which means that fullerenol is significantly more prone to electrophilic attacks than C60. The results presented in Fig. 15 also indicate that functionalization with OH groups increases the maximal ALIE values also, from ∼300 kcal mol−1 to ∼350 kcal mol−1. These severely increased maximal ALIE values are precisely located at hydrogen molecules, indicating that fullerenol should have much more pronounced interactions with water molecules.
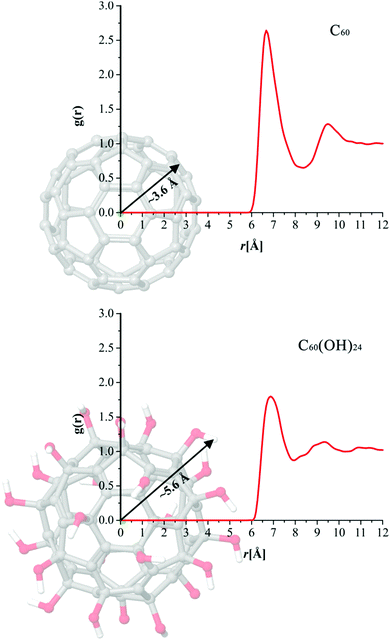
The influence of the solvent molecules on the interactions between particles can be efficiently investigated by employing the approach of Radial distribution functions (RDFs). The radial function, g(r), gives the probability of finding a particle in the distance r from another particle.40 In this work we have used RDFs in order to obtain and compare water density profiles of C60 and C60(OH)24. The profile and the peak distance of the obtained curve indicate the affinity of some molecule's atom towards interactions with the water molecule. The sharper and closer g(r) peaks indicate more pronounced interactions with solvent molecules. Firstly, in order to investigate an average effect of functionalization of fullerene with OH groups on its hydrophilic properties, we have calculated RDFs between centres of mass (COM) of C60 and C60(OH)24, and oxygen atoms of water molecules.
The results presented in Fig. 16 clearly indicate that the hydrophilicity of C60 greatly improves thanks to the functionalization with OH groups. Namely, in cases of both C60 and C60(OH)24, g(r) has its maximal value located at a distance of ∼6.7 Å. In other words this means that the probability to find water molecules around both buckyballs is the highest at a distance of ∼6.7 Å from their COM. At first glance this result might indicate that the hydrophilicity of C60 and C60(OH)24 is almost the same. However it has to be taken into account that C60(OH)24 is a much larger molecule than C60, as illustrated in Fig. 16. The radius of C60 is around 3.6 Å, while the radius of C60(OH)24 is ∼5.6 Å, meaning that on average water molecules are much closer to C60(OH)24 than to the C60.
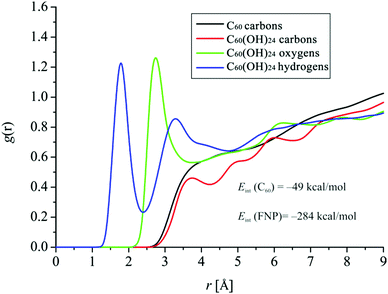
The results presented in Fig. 16 confirm that C60(OH)24 has much more pronounced interactions with water molecules than C60, which is in agreement with the results concerning MEP and ALIE surfaces. Further insight into the interactions with water molecules was obtained using RDFs between atoms of C60 and C60(OH)24, and oxygen atoms of water molecules, Fig. 17.
The results presented in Fig. 17 again emphasize much more pronounced interactions with water molecules in the case of C60(OH)24. Namely, the RDF of carbon atoms of C60 has no sharp peak at all, which indicates very weak interactions with water molecules.
On the other hand, RDFs of oxygen and hydrogen atoms of C60(OH)24 indicate much more significant interactions with water molecules, especially in the case of hydrogen atoms, the peak distance of which is located below the value of 2 Å, indicating pronounced interactions with water molecules. In the case of the RDF of hydrogen atoms, two distinct solvation spheres appear, with the second one having a peak distance of about 3.2 Å. The peak distance of oxygen atoms is somewhat larger, just above 2.5 Å, also indicating significant interactions with water molecules. In the case of both hydrogen and oxygen atoms, RDFs have similar g(r) values of around 1.2 Å. In the case of C60(OH)24, even the RDFs of carbon atoms in C60(OH)24 show observable peaks at the peak distance of about 3.5 Å, indicating weak interactions. Fig. 17 (inset) also shows information on interaction energies between buckyballs and water. It can be seen that the interaction energy between FNPs and water is almost six times higher than the interaction energy between C60 and water, once again clearly indicating the consequences of C60 functionalization with OH groups in terms of hydrophilicity.
Significant attention has been paid to the understanding of the temperature dependence of FNP structuring. It has been demonstrated that structural properties significantly differ below and above the temperature of 315 K. This motivated us to investigate the temperature dependence of the RDF of the system containing 32 molecules of FNPs at temperatures of 295 K and 315 K. Namely, at these two temperatures we have calculated RDFs as a function of distance between one FNP and the rest of the FNP molecules (in regard to the COM), Fig. 18.
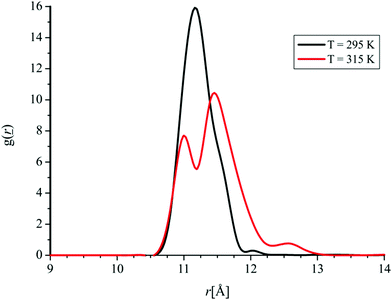 | ||
| Fig. 18 RDF as a function of distance between one FNP and the rest of the FNP molecules (in regard to the COM) at two temperatures. | ||
As it can be noticed from Fig. 18, at higher temperature a significant decrease in the maximum of the radial distribution function as well as its splitting occurs, which is in agreement with the experimentally obtained results that point out the difference in fullerenol molecule organization with the increase in temperature.
Conclusions
Self-assembled FNPs can serve as nanocarriers of biologically active components. Since their solubility in water is one of the main requirements and obstacles when it comes to bio-application, we conducted experimental and theoretical analysis of interactions between FNP and water molecules. A FNP–water system exhibits intriguing properties concerning FNP structural organization in aqueous solution that changes with temperature and concentration. It is suggested that at lower concentrations aqueous solutions of fullerenol behave similarly to aqueous solutions of inorganic salts, which enable us to apply equations that are used for electrolyte aqueous solutions, thus allowing the use of a wider range of experimental methods for the detailed investigation of the structural and dynamic properties of fullerenol aqueous solutions. Finally, the change in structuring of fullerenol nanoparticles that occurs at 309 K is recognised as a critical point also because FNPs are to be applied as potential nanodrug carriers into the human body, where the so-called normal body temperature is considered to be 309–310 K.Acknowledgements
This work has received financial support from the Ministry of Education and Science, Republic of Serbia, Grant No. III 45005, ON172012 and ON171039. We thank Professor Vladimir Srdić (Faculty of Technology, University of Novi Sad, Serbia) for the zeta potential measurements, Professor Vladimir Pavlović (Faculty of Agriculture, University of Belgrade) for TEM measurements and research Professor Zlatko Rakočević (Atomic Physics Laboratory, Vinča Institute of Nuclear Sciences, University of Belgrade) for AFM measurements. The computational part of this work has been done thanks to the support received from Schrödinger Inc. The authors declare that there is no conflict of interest regarding the publication of this article.References
- T. R. Nayak, Y. Zhang and W. Cai, in Cancer Theranostics, ed. X. Chen and S. Wong, Academic Press Elsevier, 1st edn, 2014, vol. 19 Search PubMed.
- T. Takamura, in Encyclopedia of Electrochemical Power Sources, ed. J. Garche, C. Dyer, P. Moseley, Z. Ogumi, D. Rand and B. Scrosati, Academic Press Elsevier, Amsterdam, The Netherlands, 2009, vol. 1, p. 60 Search PubMed.
- S. Afreen, K. Muthoosamy, S. Manickam and U. Hashim, Biosens. Bioelectron., 2015, 63, 354 CrossRef CAS PubMed.
- K. Kokubo, S. Shirakawa, N. Kobayashi, H. Aoshima and T. Oshima, Nano Res., 2011, 4, 204 CrossRef CAS.
- A. Arrais and E. Diana, Fullerenes, Nanotubes, Carbon Nanostruct., 2003, 11, 35 CrossRef CAS.
- S. Wang, P. He, J. M. Zhang, H. Jiang and S. Z. Zhu, Synth. Commun., 2004, 35, 1803 CrossRef.
- J. M. Zhang, W. Yang, P. He and S. Z. Zhu, Chin. J. Chem., 2004, 22, 1008 CrossRef CAS.
- A. Djordjevic, B. Srdjenovic, M. Seke, D. Petrovic, R. Injac and J. Mrdjanovic, J. Nanomater., 2015, 2015, 567073 Search PubMed.
- K. Kokubo, K. Matsubayashi, H. Tategaki, H. Takada and T. Oshima, ACS Nano, 2008, 2, 327 CrossRef CAS PubMed.
- D. Petrovic, M. Seke, B. Srdjenovic and A. Djordjevic, J. Nanomater., 2015, 2015, 565638 Search PubMed.
- D. Jović, M. Seke, A. Djordjevic, J. Mrđanović, L. Aleksić, G. Bogdanović, A. Pavić and J. Plavec, RSC Adv., 2016, 6, 38563 RSC.
- M. Seke, D. Petrovic, A. Djordjevic, D. Jovic, M. Labudovic Borovic, Z. Kanacki and M. Jankovic, Nanotechnology, 2016, 27, 485101 CrossRef PubMed.
- M. Longmire, P. L. Choyke and H. Kobayashi, Nanomedicine, 2008, 3, 703 CrossRef CAS PubMed.
- A. Djordjević, M. Vojínović-Miloradov, N. Petranović, A. Devečerski, D. Lazar and B. Ribar, Fullerene Sci. Technol., 1998, 6, 689 CrossRef.
- S. Mirkov, A. Djordjević, N. Andric, S. Andric, T. Kostic, G. Bogdanovic, M. Vojinovic-Miloradov and R. Kovacevic, Nitric Oxide-Biol. Ch., 2004, 11, 201 CrossRef CAS PubMed.
- A. D. Bochevarov, E. Harder, T. F. Hughes, J. R. Greenwood, D. A. Braden, D. M. Philipp, D. Rinaldo, M. D. Halls, J. Zhang and R. A. Friesner, Int. J. Quantum Chem., 2013, 113, 2110 CrossRef CAS.
- S. Release, Jaguar, version 8.8, Schrödinger, LLC, New York, NY, 2015 Search PubMed.
- A. D. Becke, J. Chem. Phys., 1993, 98, 5648 CrossRef CAS.
- D. Shivakumar, J. Williams, Y. Wu, W. Damm, J. Shelley and W. Sherman, J. Chem. Theory Comput., 2010, 6, 1509 CrossRef CAS PubMed.
- Z. Guo, U. Mohanty, J. Noehre, T. K. Sawyer, W. Sherman and G. Krilov, Chem. Biol. Drug Des., 2010, 75, 348 Search PubMed.
- K. J. Bowers, E. Chow, H. Xu, R. O. Dror, M. P. Eastwood, B. A. Gregersen, J. L. Klepeis, I. Kolossvary, M. A. Moraes, F. D. Sacerdoti, J. K. Salmon, Y. Shan and D. E. Shaw, Presented at: SC 2006 Conference, Proceedings of the ACM/IEEE. Tampa, Florida, 2006.
- Schrödinger Release 2015-4: Desmond Molecular Dynamics System, version 4.4, D. E. Shaw Research, New York, NY, 2015. Maestro-Desmond Interoperability Tools, version 4.4, Schrödinger, New York, NY, 2015.
- J. L. Banks, H. S. Beard, Y. Cao, A. E. Cho, W. Damm, R. Farid, A. K. Felts, T. A. Halgren, D. T. Mainz and J. R. Maple, J. Comput. Chem., 2005, 26, 1752 CrossRef CAS PubMed.
- U. Essmann, L. Perera, M. L. Berkowitz, T. Darden, H. Lee and L. G. Pedersen, J. Chem. Phys., 1995, 103, 8577 CrossRef CAS.
- H. J. Berendsen, J. P. Postma, W. F. van Gunsteren and J. Hermans, Interaction models for water in relation to protein hydration, in Intermolecular Forces, ed. B. Pullman, Springer, 1981, p. 331 Search PubMed.
- Schrödinger Release 2015-4: MacroModel, version 11.0, Schrödinger, LLC, New York, NY, 2015. Schrödinger Release 2015-4: MacroModel, version 11.0, Schrödinger, LLC, New York, NY, 2015.
- A. Piątek, A. Dawid and Z. Gburski, Spectrochim. Acta, Part A, 2011, 79, 819 CrossRef PubMed.
- B. Vileno, P. R. Marcoux, M. Lekka, A. Sienkiewicz, T. Fehér and L. Forró, Adv. Funct. Mater., 2006, 16, 12 Search PubMed.
- X. Cai, H. Jia, Z. Liu, B. Hou, C. Luo, Z. Feng, W. Li and J. Liu, J. Neurosci. Res., 2008, 86, 3622 CrossRef CAS PubMed.
- K. Semenov, N. Charykov and V. Keskinov, J. Chem. Eng. Data, 2011, 56, 230 CrossRef CAS.
- K. Semenov, N. Charykov, V. Postnov, V. Sharoyko, I. Vorotyntsev, M. Galagudza and I. Murin, Prog. Solid State Chem., 2016, 44, 59 CrossRef CAS.
- M. Vraneš, S. Armaković, A. Tot, S. Papović, N. Zec, S. Armaković, N. Banić, B. Abramović and S. Gadžurić, J. Chem. Thermodyn., 2016, 93, 164 CrossRef.
- M. Vraneš, A. Tot, N. Zec, S. Papović, S. Dožić and S. Gadžurić, J. Chem. Thermodyn., 2015, 81, 66 CrossRef.
- D. O. Masson, London Edinburgh Philos. Mag. J. Sci., 1928, 8, 218 CrossRef.
- L. M. Gedansky and L. G. Hepler, Can. J. Chem., 1969, 47, 4613 CrossRef.
- G. Jones and M. Dole, J. Am. Chem. Soc., 1929, 51, 2950 CrossRef CAS.
- L. Onsager and R. Fuoss, J. Phys. Chem., 1932, 36, 2689 CrossRef CAS.
- R. L. Kay and D. F. Evans, J. Phys. Chem., 1966, 70, 2325 CrossRef CAS.
- J. Murray, F. Abu-Awwad and P. Politzer, THEOCHEM, 2000, 501, 241 CrossRef.
- R. V. Vaz, J. R. Gomes and C. M. Silva, J. Supercrit. Fluids, 2016, 107, 630 CrossRef CAS.
Footnote |
| † Electronic supplementary information (ESI) available. See DOI: 10.1039/c6cp06847b |
| This journal is © the Owner Societies 2017 |

