
In situ X-ray absorption spectroscopy of transition metal based water oxidation catalysts
Christina H. M.
van Oversteeg
a,
Hoang Q.
Doan
b,
Frank M. F.
de Groot
*a and
Tanja
Cuk
*b
aDepartment of Chemistry, Utrecht University, Universiteitsweg 99, 3584 CG Utrecht, The Netherlands. E-mail: F.M.F.deGroot@uu.nl
bDepartment of Chemistry, University of California – Berkeley, 419 Latimer Hall, Berkeley, CA 94720, USA. E-mail: Tanjacuk@berkeley.edu
First published on 11th November 2016
Abstract
X-ray absorption studies of the geometric and electronic structure of primarily heterogeneous Co, Ni, and Mn based water oxidation catalysts are reviewed. The X-ray absorption near edge and extended X-ray absorption fine structure studies of the metal K-edge, characterize the metal oxidation state, metal–oxygen bond distance, metal–metal distance, and degree of disorder of the catalysts. These properties guide the coordination environment of the transition metal oxide radical that localizes surface holes and is required to oxidize water. The catalysts are investigated both as-prepared, in their native state, and under reaction conditions, while transition metal oxide radicals are generated. The findings of many experiments are summarized in tables. The advantages of future X-ray experiments on water oxidation catalysts, which include the limited data available of the oxygen K-edge, metal L-edge, and resonant inelastic X-ray scattering, are discussed.
 Christina H. M. van Oversteeg | Christina van Oversteeg received her MSc degree in Chemistry from Utrecht University in 2015. The research for her MSc thesis focused on the use of XAS for investigating the structure of conventional HDS catalysts and was supervised by Frank de Groot. An additional research project was carried out at UC Berkeley under the supervision of Tanja Cuk. Currently, she is working as a PhD student at Utrecht University in the Netherlands. Her research focuses on the photocatalytic properties of copper chalcogenide nanocrystals. |
 Hoang Q. Doan | Hoang Q. Doan received a BS in chemistry from Purdue University in 2010. Her undergraduate research with Joseph Francisco was on bio-computational modeling of radical attack on amide systems to mimic small sections of protein misfolding. She obtained her PhD in chemistry in 2016 from the University of California, Berkeley working with Tanja Cuk on the photo-dynamics of oxygen-evolving semiconductors using ultrafast transient spectroscopy. |
 Frank M. F. de Groot | Dr de Groot received his MSc degree in Chemistry from Nijmegen University in 1986 and a PhD in Chemistry from Nijmegen University in 1991. He then went on to the LURE synchrotron in Orsay, France, from 1992 to 1994 and to a KNAW academy researcher position at Groningen University from 1995 to 1998. Since 1999, he has been working in the Chemistry Department of Utrecht University, since 2009 as professor in X-ray spectroscopy. His research is focused on X-ray spectroscopy for the study of the electronic and magnetic structure of condensed matter, in particular for transition metal oxides and heterogeneous catalysts under working conditions. |
 Tanja Cuk | Dr Cuk finished a BSE in Electrical Engineering at Princeton University in 2000 and a PhD in Applied Physics at Stanford University in 2007. She then went on to a Miller Postdoctoral Fellowship at UC Berkeley from 2007 to 2010. Since 2010, she has been an Assistant Professor in the Chemistry Department at UC Berkeley and a Faculty Scientist within the Chemical Sciences Division at Lawrence Berkeley National Laboratory. Her research aims to elucidate solar-to-fuel generation and focuses on the fundamental mechanisms involved in converting charge into fuel at solid–liquid interfaces, for which she applies multiple ultrafast spectroscopy. |
1 Introduction
The increase in world population together with an increase in living standards is causing an increase in energy consumption.1,2 Currently fossil fuels are by far the most important natural energy resource. However, these reserves are finite and the combustion of fossil fuels has significant negative effects on the environment. As a consequence, there is an urgent need for inexhaustible, renewable and clean energy sources.Artificial photosynthetic systems that harness solar energy by converting it into a storable carbon-free fuel are poised to replace fossil fuels. In artificial photosynthetic systems, water is an essential fuel feedstock: it is both abundant and uniquely provides for a highly selective, uphill reaction. The water splitting process can be broken down into two steps, the oxygen evolution reaction (OER) to produce O2, protons and electrons (2H2O → 4H+ + 4e− + O2), followed by the reduction of protons to form H2 (2H+ + 2e− → H2). Due to the four electron transfers required, the OER is especially demanding, and catalysts to increase the rate of the reaction have been investigated for decades.3 Transition metal oxide materials, whose surfaces are easily hydroxylated, have proven to be among the best water oxidation catalysts (WOCs).4 The metric for their catalytic properties is the O2 evolution rate at a particular over-potential. The over-potential is defined as the difference between the applied potential and the thermodynamic potential for water oxidation (1.23 V vs. SHE, pH = 0). As an example, the O2 evolution rate per site is in the range of 0.01–0.1 O2/Co site for Co3O4 with a moderate over-potential of 0.3–0.4 V.5 The over-potential can be tuned either by a voltage in an electrochemical cell or by photo-excitation. Both an applied voltage and photo-excitation provide positive charges, or holes, that then accept electrons from water; while a voltage can continuously tune the potential of holes, photo-excitation (either by charge transfer from a light-absorbing dye molecule or by exciting the catalyst itself) leads to holes at the potential defined by the lowest occupied band in the material, i.e. the valence band.
Fundamental descriptions of the catalytic activity of transition metal oxide materials start with the ground state atomic and electronic structure. This ground state structure is defined by the catalyst surface at equilibrium with a given pH. The catalyst could be at an applied potential below the thermodynamic potential of the reaction. For the purposes of this review, we define this to be the as-prepared structure of the catalyst. The as-prepared structure important to catalysis is guided by the local, molecular properties: the hybridization between the metal and the oxygen site, the oxidation state of the metal, the metal–oxygen distance, structural distortions and the degree of disorder. All of these electronic properties guides the coordination environment of a localized hole at a surface site from which a catalytic reaction can proceed. X-ray absorption spectroscopy (XAS) is a unique tool to investigate these local properties, because it excites an electron from core levels (1s, 2p of the metal and 1s of the oxygen) to an unoccupied band (metal 2p, 3d and oxygen 2p) and therefore is element specific. Further, extended X-ray absorption spectroscopy (EXAFS) determines bond distances and short-range order from the recoil of the atoms around the excited one. The first part of this review covers the XAS obtained ground state atomic and electronic properties of as-prepared transition metal oxide catalysts. The hard X-ray metal K-edge (1s to 2p transition) features prominently, due to the extensive work in this area; the more recent studies of the soft X-ray oxygen K-edge and metal L-edge (2p to 3d transition) are highlighted as well.
An even better probe of the coordination environment of a localized surface hole is to investigate these catalysts under reaction conditions with XAS and EXAFS. These reaction conditions are obtained in custom made cells that allow for the X-ray beam to penetrate the electrode through to the catalyst/electrolyte interface. Recent techniques include the development of liquid cells for use in an ultra-high vacuum chamber and flow cells that allow for electrolyte and gas circulation.6 In these experiments, one observes changes to the average oxidation state, metal–oxygen distance, structural distortions, and the degree of disorder in the material due to catalysis. Due to the fact that XAS is bulk sensitive, the effect of holes accumulating in the bulk and at the catalytic surface will be measured. Further, during catalysis, holes will both localize at the surface and transfer to the electrolyte, which could lead to small net changes with respect to the as-prepared catalyst. On the other hand, many of the heterogeneous catalysts investigated are generated electrochemically, which means that in the as-prepared state, they are porous and contain a large surface area.7 Furthermore, recent infrared experiments of WOCs under illumination,8 transient optical spectroscopy on the millisecond time-scale,9 and photoelectrochemical measurements10 suggest that under a steady state reaction, holes will accumulate at the surface. Therefore, if the average metal oxidation state increases as determined by metal K-edge XAS, it suggests that a surface hole has substantial metal character, and has less tendency to localize on surface oxygen sites. The second part of this review covers the XAS/EXAFS obtained atomic and electronic structure of transition metal oxide catalysts under reaction conditions. Here, almost exclusively the metal K-edge is investigated, although techniques are becoming available for in situ soft X-ray studies.6,11
The spectrum that XAS probes is diagramed in Fig. 1. In general, the X-ray fluorescence from the catalyst is collected as a function of the incident X-ray energy. The X-ray energy tunes the excitation of core-level electrons to different, unoccupied electronic states (left), which modulates the intensity of fluorescent, electronic transitions of electrons in the occupied valence states to the unoccupied core levels (middle). Another way to obtain a spectrum as a function of X-ray energy is to collect the total electron yield, or the current between two contacts that is induced by the incident X-rays. The electron yield is considered especially surface sensitive (1–2 nm) since it is generated by low energy electrons emitted from the sample (right). With fluorescence or electron yield, a spectrum of the unoccupied electronic structure of either the as-prepared catalyst or the catalyst under reaction conditions is obtained.
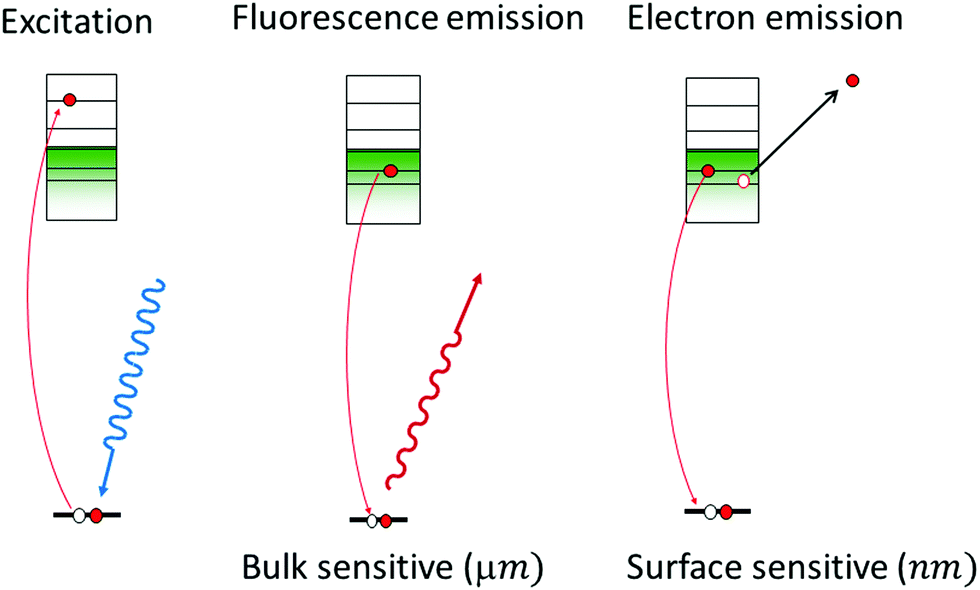 | ||
| Fig. 1 The XAS measurements depicting the initial X-ray excitation to unoccupied electronic states (left), the fluorescent X-ray probe of the emissive transition of occupied electronic states filling the core hole (middle), and the electron yield probe that results from emitted electrons (right). | ||
The focus of this XAS/EXAFS review is the OER activity of heterogeneous, oxide catalysts containing cobalt (Co), nickel (Ni), and manganese (Mn). Oxides of these three metals are promising and affordable materials for water oxidation.12–14 CoO-, NiO- and MnO-based electrocatalysts generally operate at lower over-potentials than transition metal oxides such as Fe2O3 and TiO2.15,16 Co, Ni, and Mn oxides are also differentiated by being essentially “dark” catalysts, such that only a voltage or a separate light absorber can inject holes into the ground state electronic structure and generate appreciable catalytic activity. The low over-potential has previously been attributed to the ability of these catalysts to transition between different oxidation states, i.e. the presence of multiple redox potentials, and the metal–oxygen bond strength.17,18 Suggested OER schemes for CoO- and MnO-based catalysts predict that a hole localizes preferentially on the metal site, creating surface metal oxos (M![[double bond, length as m-dash]](https://www.rsc.org/images/entities/char_e001.gif) O) in converting Co/Mn(III)OH–Co/Mn(III)OH to Co/Mn(IV)OCo/Mn(IV)O. For NiO-based catalysts, OER schemes predict that the hole localizes on an oxygen atom, creating anoxyl radical, Ni(III)–O˙.19–22 The transition metal oxide radical generated by surface hole localization, however, could be a delicate balance of the oxidation state of the metal and the oxygen. In addition to the XAS studies reviewed below, recent efforts have reported on such radicals based on their vibrational spectrum in steady state and time-resolved infrared experiments, notably the Co(IV)O radical of Co3O4,8 the Ti–O˙ radical of SrTiO323 and the Fe(IV)O radical of Fe2O3.24 Observation of the direct spin density distribution of a radical was reported for a RuO fragment in a molecular WOC by electron paramagnetic resonance.25
O) in converting Co/Mn(III)OH–Co/Mn(III)OH to Co/Mn(IV)OCo/Mn(IV)O. For NiO-based catalysts, OER schemes predict that the hole localizes on an oxygen atom, creating anoxyl radical, Ni(III)–O˙.19–22 The transition metal oxide radical generated by surface hole localization, however, could be a delicate balance of the oxidation state of the metal and the oxygen. In addition to the XAS studies reviewed below, recent efforts have reported on such radicals based on their vibrational spectrum in steady state and time-resolved infrared experiments, notably the Co(IV)O radical of Co3O4,8 the Ti–O˙ radical of SrTiO323 and the Fe(IV)O radical of Fe2O3.24 Observation of the direct spin density distribution of a radical was reported for a RuO fragment in a molecular WOC by electron paramagnetic resonance.25
The nature of this radical is expected to determine a transition metal oxide catalyst's ability to promote the formation of the O–O bond. In the proposed water oxidation cycle depicted in Fig. 2, two transition metal oxide radicals are involved in oxidizing a water molecule into the O–O bond, thought to be the rate limiting step of the water oxidation reaction.3 There are two proposed routes for generating O2 from the as-prepared catalyst at equilibrium, adapted from previously proposed mechanisms for Co, Mn catalysts22 (Fig. 2a) and Ni catalysts20 (Fig. 2b). The first highlights the role of the transition metal oxide radical with metal character: two hole transfers generate two metal oxos that then nucleophilically attack water to create O2. The second highlights the transition metal oxide radical with oxygen character: here, two hole transfers create two oxyl radicals that then nucleophilically attack water. While there are other mechanism that could describe O–O bond formation, the initial transition metal oxide radical supported by the as-prepared catalyst will be a defining characteristic in any given one. The atomic and electronic information on the transition metal oxide radical can be provided for by comparing XAS and EXAFS of as-prepared catalysts with that of catalysts under reaction conditions.
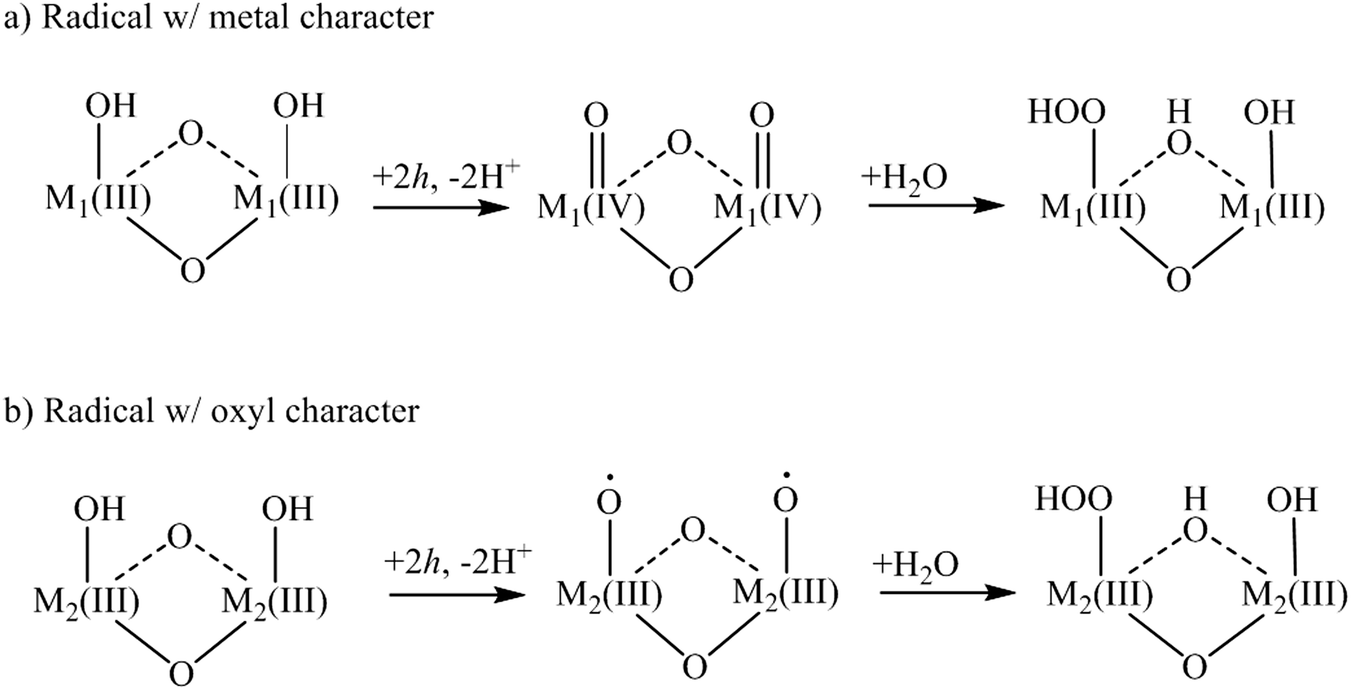 | ||
| Fig. 2 Catalytic mechanism depicting (a) a transition metal oxide radical with metal character generated by hole injection and (b) a transition metal oxide radical with oxyl character generated by hole injection. | ||
The review is divided into the following sections: (2) theory of XAS and EXAFS. The theory section primarily concerns the metal K-edge, metal L-edge, and O K-edge XAS/EXAFS, but also includes a brief description of resonant inelastic X-ray absorption scattering (RIXS) useful for future studies. (3) Ex situ metal K,L-edge XAS. This section reviews the results on as-prepared WOCs. (4) In situ metal K-edge XAS. This section reviews the results on WOCs under reaction conditions. The experimental sections (3) and (4) include an overview of the results of many XAS experiments in a tabular form. Comparisons between the ex situ and in situ tables are made. (5) Soft X-ray absorption of WOCs. This section discusses the recent cell development involved in the application of soft X-ray and RIXS to investigating catalysis, the limited studies currently available, and how the broader application of these techniques to catalysis could impact the field. For further reading, the reader is referred to several other reviews on X-ray spectroscopy26–29 and WOC.1,2,30–33
2 X-ray absorption spectroscopy
When an X-ray passes an electron, the electron can capture energy as the X-ray causes the field to oscillate in both strength and direction. If the energy gain by the electron is equal to or higher than the binding energy of the core electron, a photon can be absorbed. A core electron is then excited to an excitonic state below the ionization threshold or to a free electron with a certain kinetic energy above the ionization threshold, as illustrated in Fig. 3. | ||
| Fig. 3 XAS energy diagram, where the left part depicts the excitation of a core electron to an excitonic state below the ionization threshold and to a free electron with a certain energy above the ionization threshold. | ||
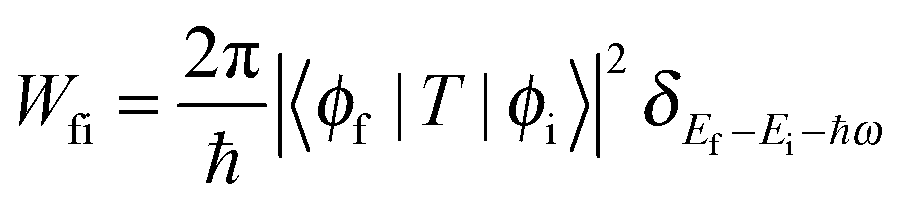
The Fermi golden rule gives the transition probability Wfi between the initial (ϕi) and the final state (ϕf) of the absorption process:
 | (1) |
Conservation of energy is included by the delta function, δ, with Ef the final state energy, Ei the initial state energy and ℏω the energy of the incident photon. The transition operator T is related to the interaction Hamiltonian and contains the term eikr, with k as the wave vector of the X-rays. According to the Taylor expansion, the term eikr can be written as 1 + ikr + ⋯. Since the wavelength of an X-ray photon is much larger than the typical size of an atom, the factor kr is ≪1. Consequently, the dipole approximation can be used, which turns the transition operator into the dipole operator, r, and the Fermi golden rule can be written as
| Wfi ∝ |〈ϕf|r|ϕi〉|2δEf−Ei−ℏω | (2) |
For excitations from the 1s core states the interactions between electrons in the final state are relatively weak and a single electron excitation approximation can be employed. In this case the initial state can be written as a core wave function (c) and the final state as a valence electron wave function (ε). The squared matrix element M is assumed constant as it only has a small variation in energy. Subsequently the Fermi golden rule can be rewritten as
| |〈ϕf|r|ϕi〉|2 = |〈ε|r|c〉|2 = M2 | (3) |
| IXAS ∼ M2ρ | (4) |
The delta function in the Fermi golden rule suggests that the absorption spectrum should look like the density of unoccupied states, broadened by the lifetime broadening as discussed below.
Variations in the X-ray absorption coefficient μ are measured as a function of the incident X-ray energy. At a certain incoming photon energy a sharp rise in absorption will occur, referred to as the absorption edge or main edge. At this specific energy, the photon energy is equal to the binding energy of a specific core level. The K-edge relates to the transitions of the 1s core electron to the 4p conduction band, whereas the L-edge relates to transitions of the 2s and 2p core electrons to the 3d band. The excitation of a core electron results in an unstable state due to the presence of a core hole. The core hole will be filled by decay processes such as fluorescence or Auger.
The absorption spectrum can be roughly divided into two regions (Fig. 4). The region at energies below and around the ionization threshold is referred to as the X-ray absorption near edge structure (XANES). Around 20 to 30 eV above the absorption edge, the excited electron is typically described using the electron scattering description and this region is referred to as the extended X-ray absorption fine structure (EXAFS). The two regions are further discussed below in terms of the information they provide.
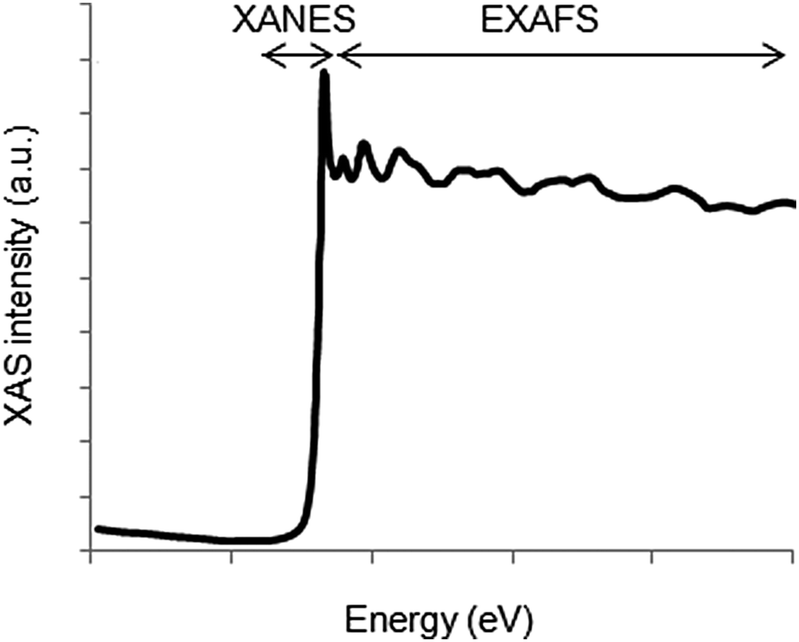 | ||
| Fig. 4 The X-ray absorption spectrum can be divided into the XANES region, describing the edge structure up to around 25 eV above the edge, and the EXAFS region at higher energies. | ||
2.1 Typical K-edge XANES for 3d metal oxides
For 3d transition metals, the K-edge is found in the hard X-ray regime (5–10 keV). The main absorption edge corresponds to transitions from the 1s to 4p states, while the corresponding pre-edge covers transitions from the 1s to 3d states. A typical K-edge spectrum for a 3d metal is given in Fig. 5.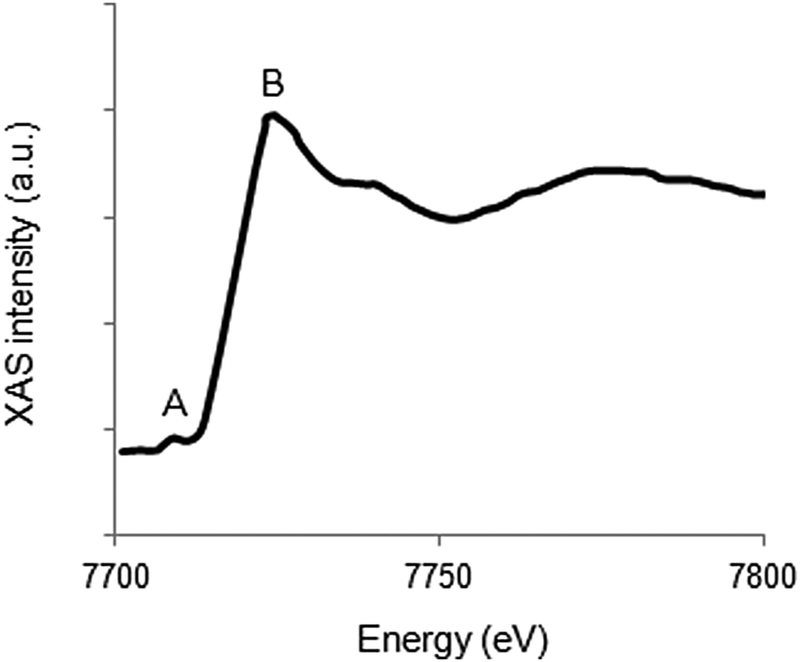 | ||
| Fig. 5 Representation of the Co K-edge XAS structure. The pre-edge is marked by A, whereas B indicates the main absorption edge. | ||
In order for a transition to be allowed, the matrix element should be non-zero. Consequently two selection rules should be obeyed. The first selection rule states that the orbital quantum number of the final state can only differ by one from the initial state (ΔL = +1 or −1) as light carries an orbital momentum of one. According to this selection rule a transition from an s orbital will be into a p orbital, i.e. from l = 0 to l = 1. The main quantum number does not have a selection rule. Therefore both 1s2p and 2s2p transitions are allowed. The second selection rule is the spin selection rule, which states that the spin of an electron cannot be modified during interaction with light as light does not carry spin (ΔS = 0).
There is much chemical information present in the XANES region. In the case of bulk oxides, the position of the edge is sensitive to the formal oxidation state of the element. This can be explained by an increase in the electrostatic interaction between the positive metal ion and negative electrons, caused by a decrease in the shielding of charge by the absence of extra electronic charge or higher oxidation states.34 Wong et al. (1984) found that for bulk metal oxides, the edge energy is linearly related to the formal oxidation state with a slope of ∼2 eV per valence.35 For clarity we note that this concept of the X-ray absorption edge is not directly related to the ionization potential, but serves as an empirically determined parameter that correlates with the formal valence of the system. Three common methods to determine the edge position are (1) the energy at 50% intensity of the edge maximum, (2) averaging energies at 20% and 80% intensity of the edge maximum and (3) the energy of the inflection point.36 If the edge is more than a single feature, for example containing a shoulder, different methods may report different edge energies. Therefore, consistency in the chosen method is important to properly relate edge energies to the formal oxidation state. The spectral shape and absorption edge position are also sensitive to ligand types and the coordination environment.
The pre-edge feature in K-edge XAS gives important electronic and structural information. We discuss a number of limiting cases as examples: (a) in the case of isolated octahedral transition metal ions, the pre-edge corresponds to the 1s3d quadrupole transition, where the pre-edge is split by the crystal field effect into t2g and eg peaks. (b) If inversion symmetry is broken such as in tetrahedral symmetry, there is hybridization of the 3d and 4p orbitals, implying that there are also direct dipole transitions into the pre-edge region strongly enhancing the pre-edge intensity. From the symmetry argument one can deduce that only the t2-symmetry states have dipole–quadrupole mixing. This implies that intense pre-edge features are indicative of a geometry distortion from a centrosymmetric environment.37 (c) In the case of bulk oxides without inversion symmetry the situation is similar to an isolated complex, but in a bulk system with inversion symmetry, there are two separate pre-edge structures: (c1) the usual 1s3d quadrupole pre-edge and (c2) the 1s4p dipole pre-edge that is due to transitions of 4p states that hybridize with the 3d states of near neighbors. The energy splitting between these two types of pre-edges is typically 2.5 eV.38 Besides symmetry information, the pre-edge also contains information on the formal metal oxidation state. For bulk oxides, the pre-edge energy is linearly related to the formal oxidation state.35
2.2 Metal K-edge EXAFS
At the EXAFS energies, electrons are excited into the continuum.39,40 This region is dominated by scattering events of the outgoing electron on neighboring atoms and consequently the EXAFS region is best understood in terms of the wave behavior of the photo-electron created in the absorption process. The waves of the outgoing and scattered photo-electrons will interfere with each other. The interference pattern created depends on the path length of both waves and consequently the pattern contains information about the local structure around the absorbing atom. The EXAFS can be described by the EXAFS equation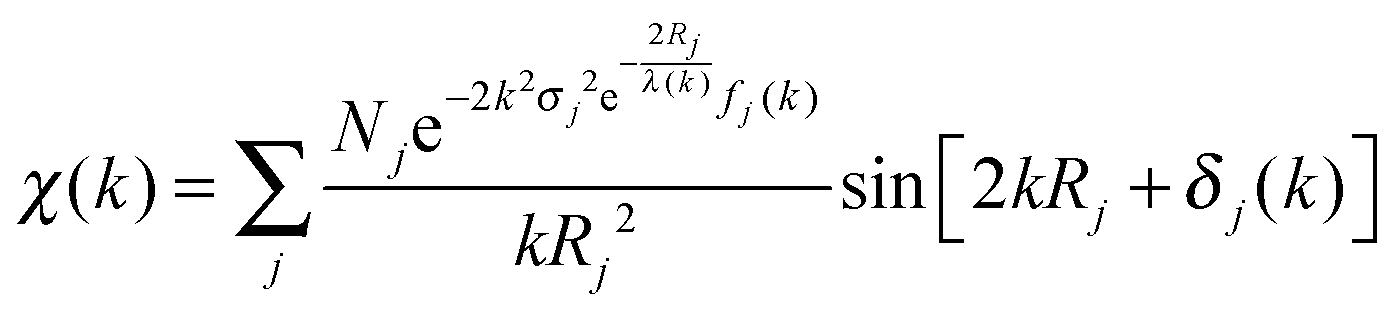 | (5) |
 | (6) |
The ionization potential can be determined by several methods, discussed previously in the XANES theory. Next, the total absorption should represent the absorption of 1 X-ray and normalized from 0 to 1. Thereafter the atomic post-edge background should be removed. The post-edge background is often approximated by a cubic spline function as described by Cook et al. (1981)41 with care taken to ensure no loss in the oscillation information. A radial distribution function χ(R), where R is again defined as the distance from the absorber atom, is obtained by Fourier transformation (FT) of χ(k). Due to the scattering phase-shift, the real distance is 0.2–0.5 Å; longer than the distance found by FT. By using different k weightings, specific scatterers can be emphasized, e.g. multiplication by k2 will emphasize oscillations at high k. The Fourier transform is a complex function, containing both an imaginary and a real part. The imaginary part gives mainly information about the absorber–scatterer distance, whereas the real part is mainly given by the number of neighboring atoms and disorders. However, the analysis of metal–metal bonds from EXAFS is not always unambiguous and often there are alternative solutions that are (mathematically) as likely as the calculated results. Fig. 6 gives an example of the results obtained after EXAFS data reduction.
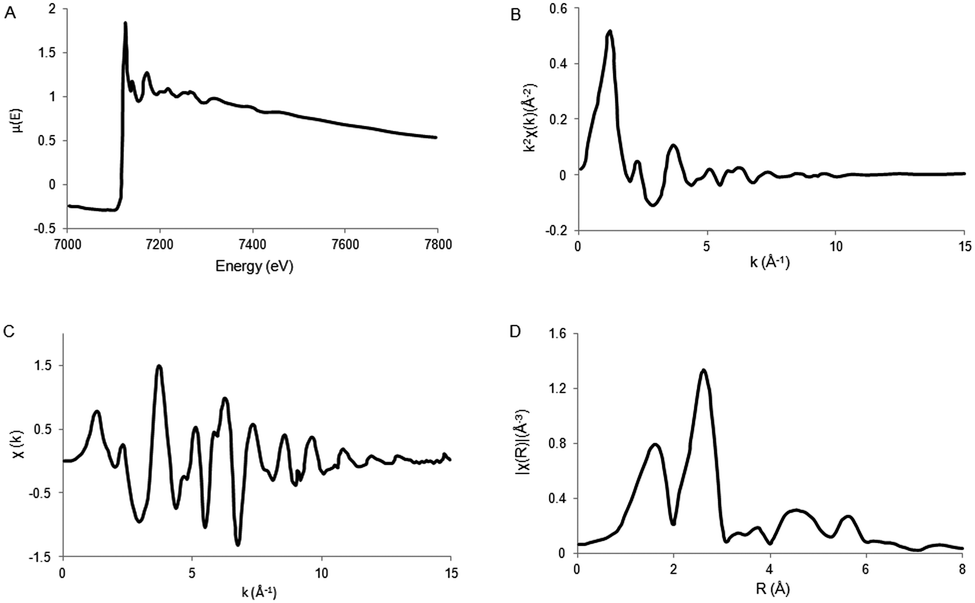 | ||
| Fig. 6 Schematic representation of EXAFS data reduction. (A) XAS spectrum μ(E). (B) Isolated EXAFS χ(k). (C) k-weighted EXAFS k2χ(k). (D) Fourier transformed EXAFS spectrum, χ(R). Adapted with permission from ref. 40. | ||
2.3 Resonant inelastic X-ray scattering based XAS techniques
In this section we discuss a number of relatively novel X-ray spectroscopy techniques that are based on resonant inelastic X-ray scattering (RIXS). This includes high-resolution fluorescence-detected (HERFD) XAS and valence selective XAS. RIXS, also known as resonant X-ray emission spectroscopy (RXES), is a second order technique in which XAS and XES are combined.42,43 The absorption of an X-ray photon with incident energy results in the excitation of a core electron. The core hole will be filled by the decay of an electron from a shallow core state or a valence state resulting in the emission of a photon. If the incident X-ray energy is chosen at an XAS edge, this X-ray emission is indicated as RIXS or alternatively as resonant X-ray emission or resonant X-ray Raman scattering. RIXS is a second order X-ray process where the excitation and de-excitation processes are coherently described by the Kramers–Heisenberg equation: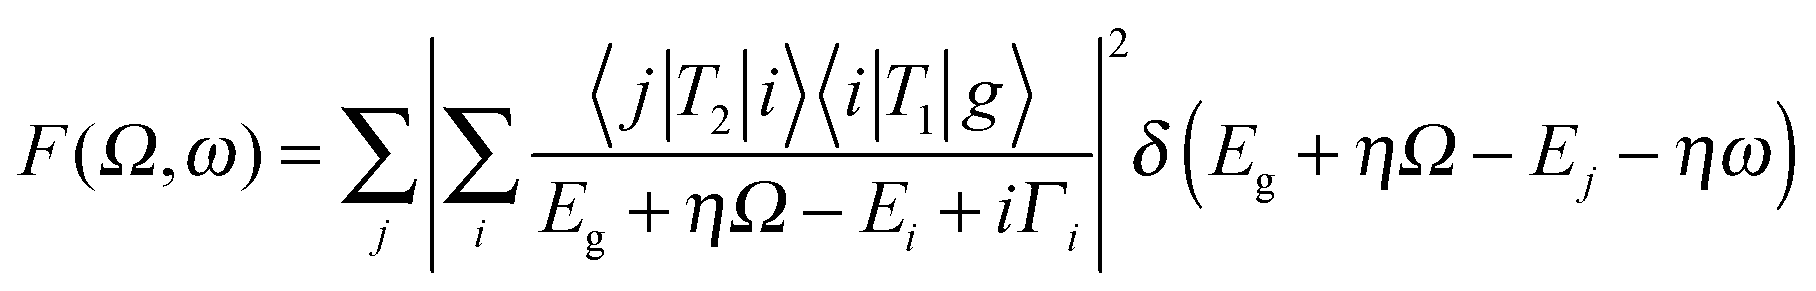 | (7) |
The scattering factor F is given as a function of the used X-ray energy (Ω) and the emitted X-ray energy (ω). The transition from the ground state (g) to the intermediate state (i) and subsequently to the final state (f) is described by the operators T1 and T2. The core-hole lifetime in the intermediate state Γi gives rise to spectral broadening. Experimentally RIXS can be divided into soft X-ray RIXS using grating optics and hard X-ray RIXS using bent crystal optics. In this review we limit our discussion to hard X-ray RIXS at the metal K edges. For recent developments in soft X-ray RIXS we refer to a recent (review) paper.42 The RIXS resolution has been improved to 30 meV at 1 keV primary beam, where we note that due to the low efficiency of the high-resolution RIXS process in situ experiments are tedious.
When a 1s core hole is created by X-ray absorption radiative decay from 2p to 1s has the highest probability. These transitions are denoted as 1s2p RIXS or alternatively as Kα RXES. This notation describes the location of the core hole in the intermediate (1s) and final state (2p). Lower probability decay transitions also occur, for example Kβ XES, the decay from the 3p to 1s level. During a RIXS experiment the incident energy as well as the emitted energy is varied. The intensities for both energies are plotted in a two-dimensional plane, the RIXS plane. In this plane the x axis represents the incident energy and the y axis represents either the energy transfer or the X-ray emission energy. If the energy transfer is used in the 1s2p RIXS, the y-axis relates to an L edge, whereas the x-axis indicates the K edge. The lifetime broadenings of the L edge and K edge invoke vertical respectively horizontal Lorentzian broadenings. The experimental resolution is approximated with a Gaussian shape and applies horizontal for the incoming X-rays and diagonal for the X-ray analyzer. Fig. 7 shows the cobalt 1s2p RIXS plane.43 The pre-edge excitonic states are visible at 7709 eV. The diagonal bands starting at 7714 eV are the 1s2p fluorescence bands.
 | ||
| Fig. 7 (left) The experimental 1s2p RIXS plane of CoO. The red color indicates the highest intensity. Reprinted with permission from ref. 43. Copyright 2013 American Chemical Society. (right) The comparison between XANES (dotted) and HERFD-XANES (solid) spectra of LiCoO2. Reprinted with permission from ref. 44. Copyright 2010 by the American Physical Society. | ||
A 45 degree diagonal cross section through the 1s2p RIXS plane implies a constant X-ray emission energy. This cross-section is indicated as the HERFD-XANES spectrum, where deviations can occur at the pre-edge region due to the excitonic effects. In HERFD spectra the spectral resolution is mainly determined by the lifetime broadening of the final 2p states and the experimental resolution. Because the 2p lifetime broadening is only 0.4 eV (full-width at half-maximum) 1s XANES spectra can be measured with 0.4 eV broadening instead of the natural lifetime broadening of ∼1.5 eV. Fig. 7 shows the comparison between XANES and HERFD-XANES of LiCoO2 measured simultaneously.44
2.4 Soft X-ray experiments
The characterization of water oxidation catalysts using K-edge XAS has been extensive. K-edge XAS has been a valuable tool to approximate the electronic and structural properties that lend itself to OER catalysis. However, many of these studies were unable to distinguish distinct differences in XAS spectra among inactive and active catalyst systems.45–48 In order to further the fundamental understanding of the structure–activity relationship, other X-ray techniques may need to be additionally employed, such as L-edge XAS and oxygen K-edge XAS.| |〈ϕf|r|ϕi〉|2 = |〈2p53dn+1|r|3dn〉|2 | (8) |
Due to the overlap between the core and valence states, the spin-moment of the core hole interacts with the valence electrons, resulting in an exchange splitting. If the core hole also carries an orbital momentum, as is the case for 3d metals, the spin–orbit coupling separates the 2p levels into 2p3/2 and 2p1/2, referred to as the L3 and L2 edge, respectively. The effects caused by the overlap of the core and final states are called multiplet effects. In the presence of spin–orbit coupling, the orbital angular momentum L and the spin angular momentum S are no longer appropriate to describe the system. The only valid quantum number in this case is the total angular momentum quantum number J. For the transition metal L-edges, p core states are dominated by a large core hole spin–orbit coupling. In the presence of spin–orbit coupling, the selection rules for the orbital angular momentum and spin angular momentum are no longer valid and the new selection rule states that the total quantum number J can change by minus one, zero and one (ΔJ = −1, 0, 1). In addition, the value of the final state cannot be equal to zero if the J value of the initial state is zero (Ji = Jf ≠ 0). The intensity ratio between the L3 and L2 edge is referred to as the branching ratio.49 This parameter is sensitive to the spin state and spin–orbit splitting.
The 3d metal L-edges are sensitive to changes in the formal oxidation state. Due to the exchange splitting described above, the spectral shape of the metal L-edge is a complex multi-peaked structure. Therefore, rather than the edge position, the center of gravity of the complete L-edge is linearly related with the valence.
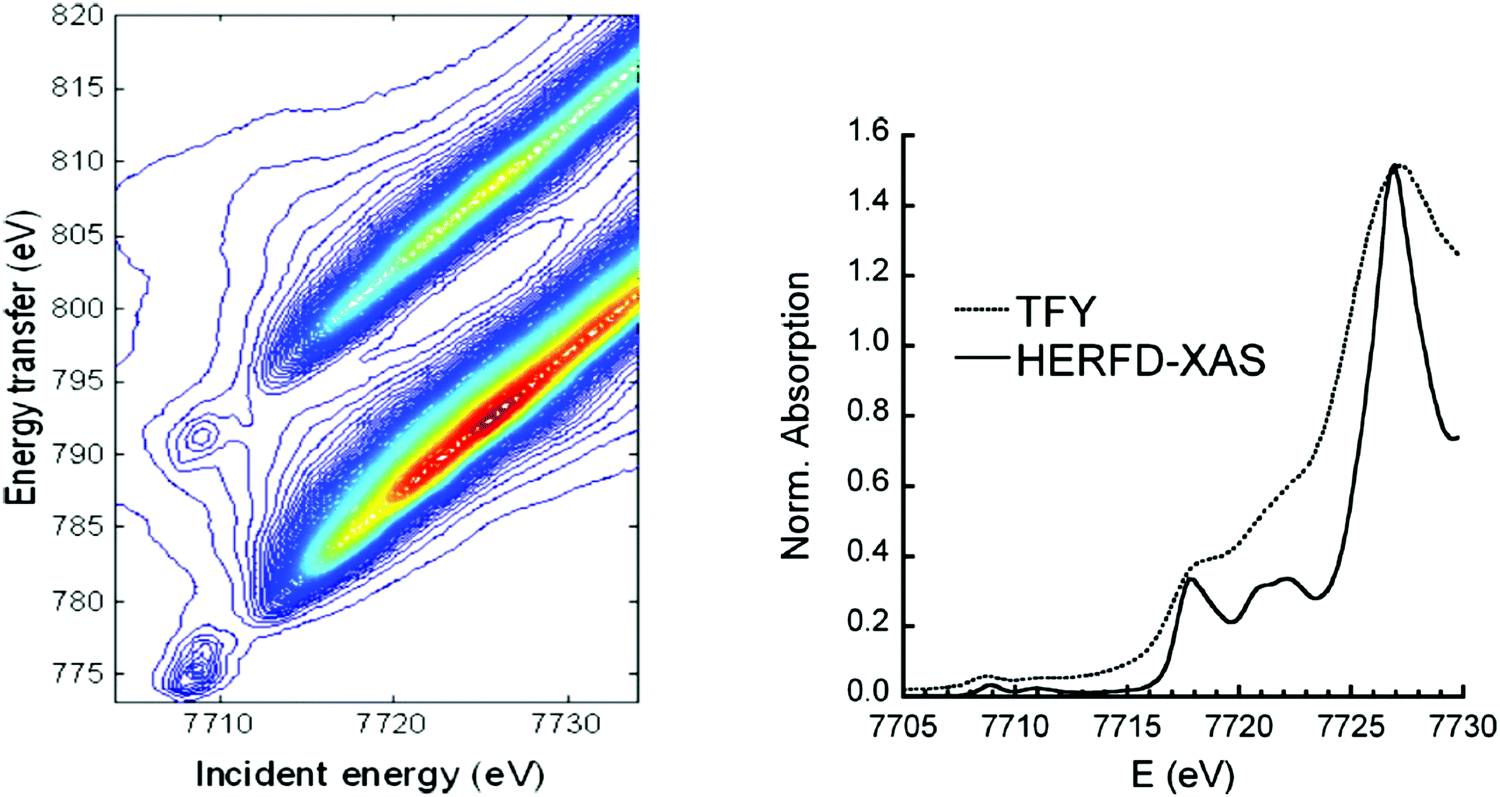
Fig. 8 shows an in situ L-edge experiment on a Co3O4 sample.50 The temperature is increased while the sample is in a chamber with 1 mbar pure H2 and during the heating procedure Co3O4 is changed to mainly CoO at 250 °C and to dominantly cobalt metal at 425 °C. This type of in situ L-edge data is best quantified with the use of references and also use of data analysis programs such as BluePrintXAS.51
 | ||
| Fig. 8 Co L2,3 edges for bulk Co3O4 during reduction from RT to 425 °C. All spectra have been normalized from zero to one. Reprinted with permission from ref. 50. Copyright 2004 American Chemical Society. | ||
3 Ex situ metal K,L-edge XAS experiments
Ex situ XAS experiments are used to study WOCs as-prepared, upon synthesis or after being active in the water oxidation reaction. The synthesis itself in many cases involves applying a voltage or light illumination. Ex situ implies that a ground state atomic and electronic structure of the as-prepared catalyst at a given solution pH is investigated. This section reviews the XAS and EXAFS structural studies of as-prepared Co-, Mn- and Ni-based WOCs, gives an overview of the results, and reports the results in Table 2.3.1 Cobalt-based WOCs
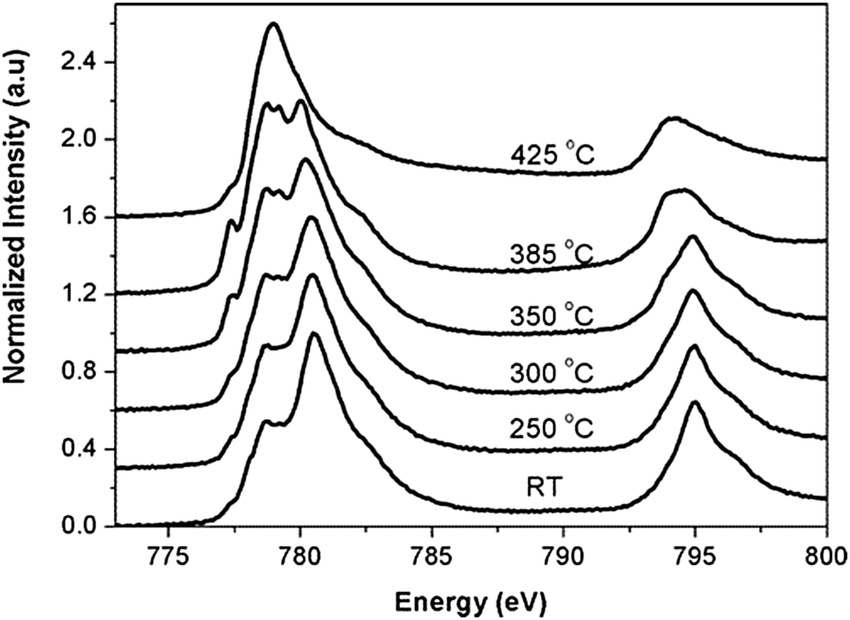
The Co K-edge XANES structure of the KPi-CoCat, compared to Co2+ and Co3+ standards, indicated a Co oxidation state of ∼3+ (Fig. 9). The spectral shape of the Co XANES region revealed information on the coordination geometry and ligand type and suggested a near-octahedral coordination of Co by six oxygen ligands (CoO6).
 | ||
| Fig. 9 The Co K-edge XANES structure of the CoCat (blue) and two references: [CoII(OH2)6](NO3)2 (black) and [CoIII(NH3)6]Cl3 (red). Reprinted with permission from ref. 58. Copyright 2009 American Chemical Society. | ||
EXAFS simulations verified the coordination of Co by six oxygen ligands (Fig. 10). A Co–O distance of 1.89 Å was found. A Co–Co distance of 2.81 Å suggested Co atoms interconnected by di-μ-oxo ((μ3-O)2) or (μ3-O)(μ2-OH) bridges, as found in Co-oxo cubanes (Fig. 11). Furthermore, a Co–Co distance of 5.62 Å as second nearest neighbor indicates two cubanes sharing a Co corner. XAS also probed the orientation of the Co complex. By performing measurements at different angles between the X-ray beam and the sample surface, the catalyst showed a fully isotropic distribution of Co–O and Co–Co vectors, as was expected for cubane units.
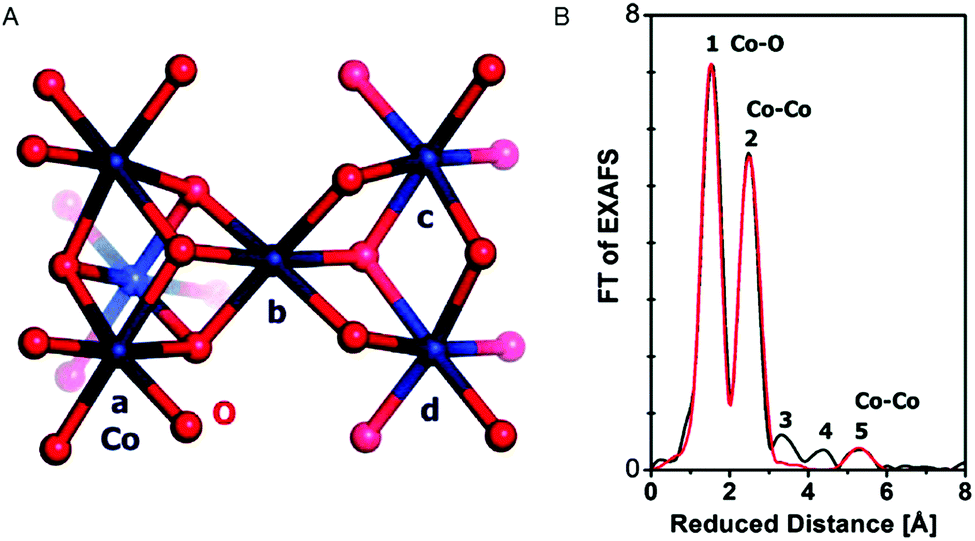 | ||
| Fig. 10 (A) Interconnected incomplete and complete Co3/4(μ-O)4 cubane units of CoCat (cobalt in blue, oxygen in red). (B) FT of an EXAFS structure of CoCat catalyst. The black line represents the experimental spectrum, whereas the red line indicates an EXAFS simulation. Reprinted with permission from ref. 58. Copyright 2009 American Chemical Society. | ||
 | ||
| Fig. 11 (A) CoCat fragment showing the prevalence of Co-oxido motifs (cobalt in black, μ3-O in grey, oxygen atoms that could be protonated or stemming from the anionic ligands in dark grey). (B) FT of an EXAFS structure of CoCat catalysts prepared in different electrolytes. Peaks marked by a, b, c and d refer to the Co-oxido structure in panel A. Reprinted with permission from ref. 59. Copyright 2012 John Wiley and Sons. | ||
To test the stability of the CoCat, additional XAS measurements were performed on a dried CoCat ground to a powder, dried CoCat on InSnO3 electrodes and a quasi in situ condition, where the CoCat-covered cathode was rapidly removed from the solution and frozen in liquid nitrogen. The XANES and EXAFS region of all this sample set looked similar, suggesting the CoCat is robust against air exposure, dehydration and mechanical treatment.
The composition of the CoCat films was shown to be dependent on electrolyte composition, pH and Co concentration during electrodeposition.60 The influence of different electrolyte compositions on the structure and function of the CoCat films was further studied.59 In addition to the potassium phosphate buffer, different CoCats were prepared at pH 7 from weakly buffering acetate electrolytes, KOAc and LiOAC, and non-buffering chloride electrolytes, KCl and CaCl2. Despite the compositional differences noted by Surendranath (2009), the functionality of the various CoCat films was only weakly dependent on the redox-inert cation. In addition, XANES showed that the Co oxidation state was still ∼3+ for all CoCats as shown in Table 1 and EXAFS revealed that the Co ligand environment was also similar to the structure previously reported for KPi-CoCat, except for KCl-CoCat.
| Sample | Edge position (eV) | O.S. |
|---|---|---|
| KPi-CoCat | 7721.0 | 3.1 |
| LiOAc-CoCat | 7721.0 | 3.1 |
| KOAc-CoCat | 7720.8 | 3.0 |
| KCl-CoCat | 7719.8 | 2.6 |
| CaCl2-CoCat | 7720.7 | 3.0 |
| Co2+(OH)6 | 7718.6 | 2.0 |
| LiCo3+O2 | 7720.9 | 3.0 |
The pre-edge intensity of the CoCat samples was found to be higher when compared to the Co2+ reference. The increase of pre-edge intensity with oxidation state could be explained by the shortening of the metal–oxygen distances upon oxidation, resulting in increased mixing between the p and d orbitals.61 Furthermore, variation in the pre-edge intensity between the different CoCats may indicate varying amounts of short di-μ-oxido bonds, as highly symmetric arrangements of ligands lead to a decrease in pre-edge intensity.62
FT analysis of the EXAFS structure of the CoCat samples reflects a reduction in order when compared to the crystalline LiCoO2 reference as indicated by the low amplitudes of the FT peaks b, c and d (Fig. 11). The highest degree of order was found for the least active KCl-CoCat, whereas the lowest degree of order was observed for the most active KPi-CoCat. Consequently, it was hypothesized that the active species of the CoCat films were peripheral Co-oxido clusters, with the terminal O atoms and possibly the O-atoms in μ2-O bridges of the metal oxide playing an important role in water oxidation catalysis.
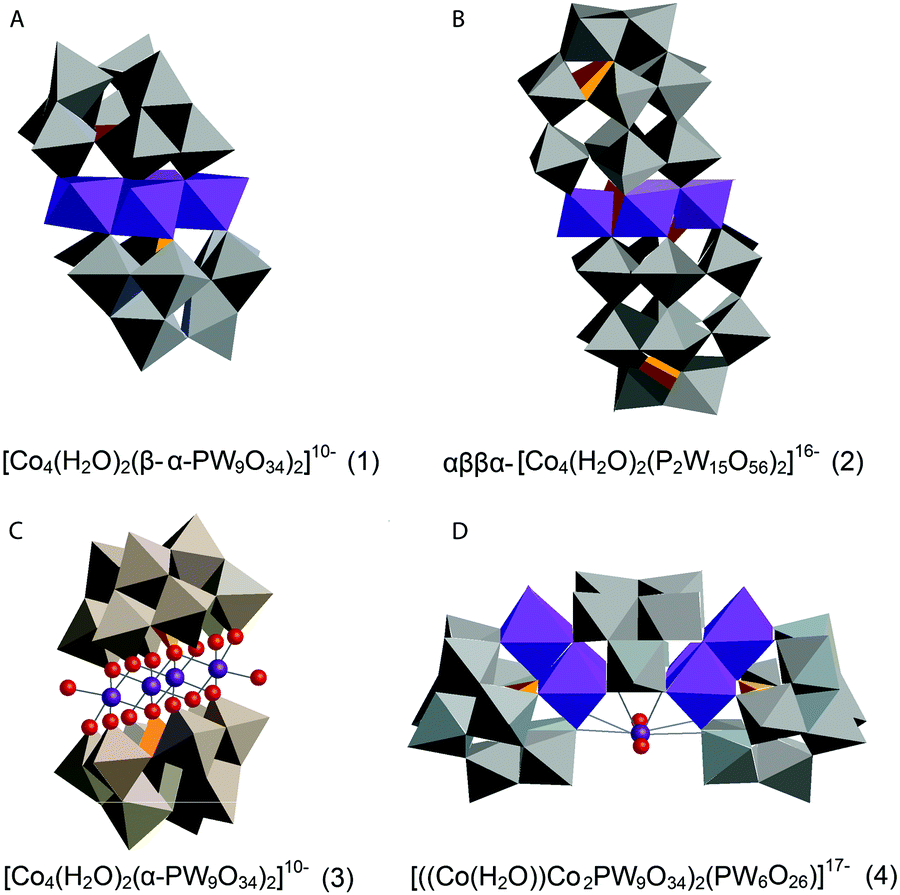 | ||
| Fig. 12 Co POMs studied by Ohlin (2011) and Schiwon (2014): (A) K10[Co4(H2O)2(α-PW9O34)2]·26H2O (1); (B) the Wells–Dawson sandwich, Na16[Co4(H2O)2(α-P2W15O56)2]·52H2O (2); (C) Na10[Co4(H2O)2(PW9O34)2] (3) and (D) Na17[((Co(H2O))Co2PW9O34)2(PW6O26)] (4)46,65 (CoII-octahedra in violet, tungstate ligands in grey, phosphorus heteroatoms in orange, and oxygen atoms depicted as red spheres). | ||
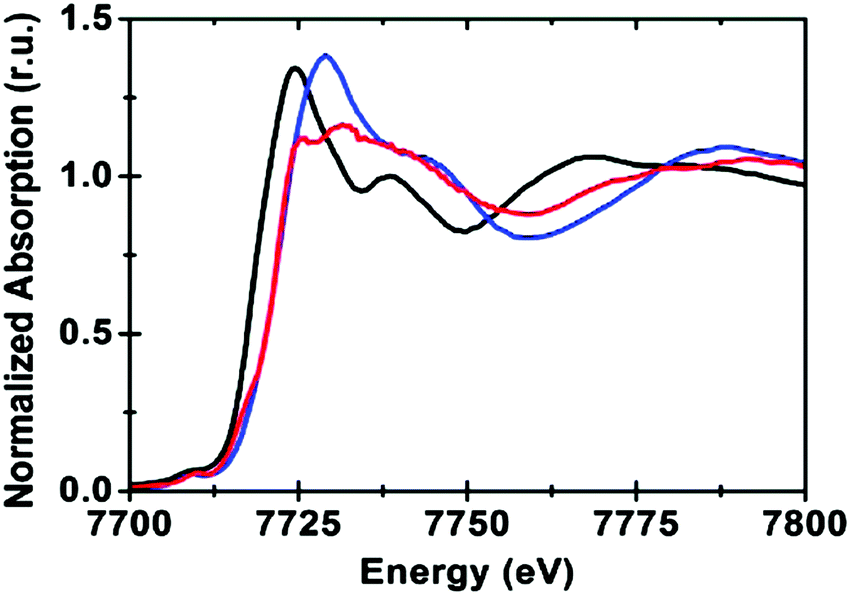
Ohlin (2011) investigated K10[Co4(H2O)2(α-PW9O34)2]·26H2O (1) and the Wells–Dawson sandwich, Na16[Co4(H2O)2(α-P2W15O56)2]·52H2O (2) (Fig. 12). Despite having an identical cobalt tetramer core, (1) was found to be active in water oxidation, whereas (2) did not show any water oxidation activity.46 This suggested that ligands play an important role in tuning the stability and catalytic activity of the Co POM complexes. Since water oxidation is most likely situated on two terminal Co atoms, which coordinate with water, it was suggested that ligand effects on the terminal cobalt atoms tune activity.46 Co K-edge XAS spectra were acquired for solids and solutions of (1) and (2). The XANES structures for both catalysts in solid state and in solution are similar. The edge position and spectral shape indicate the presence of a Co2+ species in both catalysts. The EXAFS structure for both Co POMs shows two major peaks, where the first peak is related to Co–O bonds, giving a Co–O distance of ∼1.9 Å, and the second peak is related to a disordered group of single-scatter vectors assigned to Co–Co and Co–W bonds, suggesting a M–M distance of ∼3.2 Å. The FT EXAFS showed no significant differences between the solid state and the solution state sample except for a slight intensity increase in the second peak for the solvated samples, indicating a slightly more ordered state, as shown in Fig. 13. No significant differences between the two structures were found within the XAS spectra, suggesting that the difference in activity cannot be solely attributed to ligand effects on the terminal cobalt atoms.
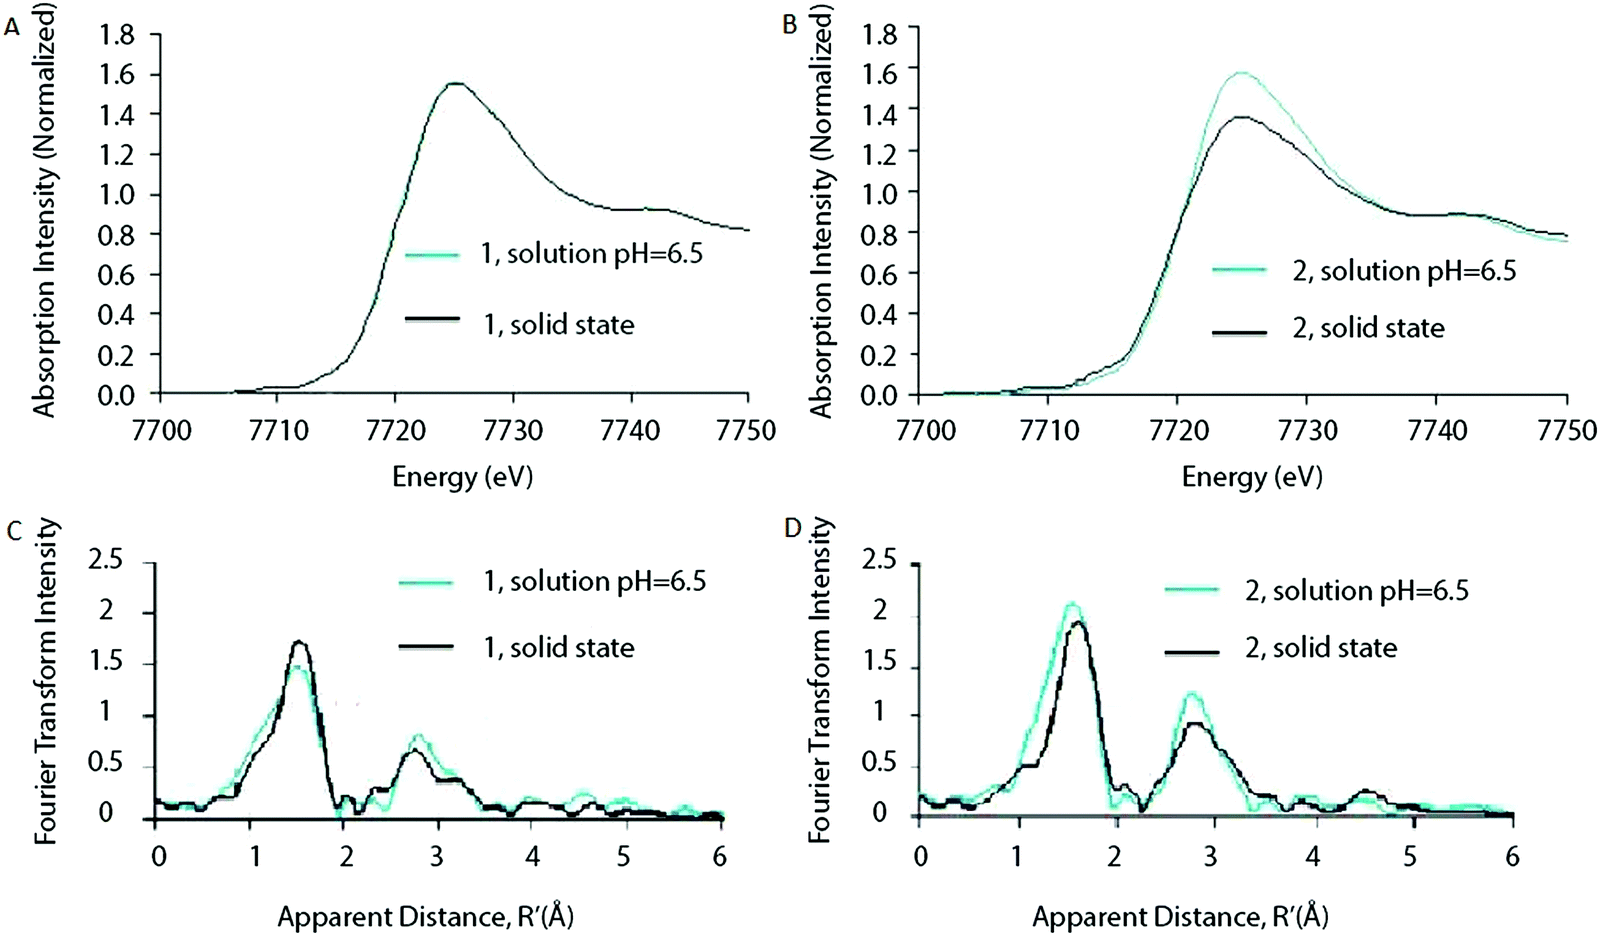 | ||
| Fig. 13 XANES of (A) Co POM (1) and (B) Co POM (2) and FT of the EXAFS structures of (C) Co POM (1) and (D) Co POM (2). XAS structures are given for both Co POMs in solution as well as in solid state. Reprinted with permission from ref. 46. Copyright 2011 John Wiley and Sons. | ||
The stability of the Co POM catalyst (1) in solution was investigated by taking XAS spectra at various pH values. The Co K-edge XANES structure did not change as a function of pH and remained consistent with a Co2+ species. Additionally, small changes in pH from 7.5 to 6.5 did not show any major changes in the FT EXAFS structure. However, as the pH was reduced from 7.5 to 2.5, the FT showed an increase in the first peak, accompanied by a reduction of the second peak, suggesting dissociation of the cluster to free Co2+ in solution. These results indicate that the POM clusters are stable in near-neutral and slightly acidic environments, but will dissociate in strongly acidic solutions.
Schiwon et al. (2014) investigated the stability of the active Co POM, Na10[Co4(H2O)2(PW9O34)2] (3), in both solution and solid state by using Co K-edge XAS.65 The structure of Co POM (3) is depicted in Fig. 12. XAS spectra were acquired for both solid state and solutions of (3). The XANES structures obtained for different concentrations of (3) in aqueous solutions do not show significant differences from each other and are similar when compared to the solid sample of (3). XANES edge positions give a Co oxidation state of 2+. This oxidation state was conserved upon dissolution of the microcrystalline powder and after RuIII-driven water oxidation catalysis. Analysis by comparing (3) to another Co POM with a well known structure, Na17[((Co(H2O))Co2PW9O34)2(PW6O26)] (4) (Fig. 12), confirmed the sensitivity of XAS to small amounts of dissociated Co2+ ions. While (3) has four Co within the core structure, (4) has three Co. The coordination number found by EXAFS simulations predicts a difference of one Co atom between these two structures, concluding that the loss of a single Co ion through dissociation would be detectable by EXAFS analysis. Furthermore, EXAFS analysis indicates a M–M distance of 3.19 Å for (3) in both solid and liquid phases, whereas for (4) a M–M distance of 3.8 Å was found. For both (3) and (4) a Co–O distance of ∼2.05 Å was reported.
Both XANES and EXAFS confirmed that neither dissolving nor oxidant exposure and water oxidation catalysis modifies the structure of (3), revealing a stable (3) under experimental conditions. The XANES structures of the Co POM (3) before and after catalysis were found to be significantly different from [Co(H2O)6]2+ and the typical edge-sharing octahedra found in CoCat, suggesting the absence of dissociation of (3) into free Co2+ ions which could form a CoCat-like structure upon electro-oxidation as previously suggested by Stracke et al.68
Hibberd and co-workers (2015) used Co L-edge XAS to study the electronic structure of various Co POMs and Co3O4 thin films.66 L-Edge XAS spectra for the Co POMs determined the oxidation state, ligand coordination geometry, and the effects of electron–electron interactions on Co–O hybridization. While providing a thorough understanding of the ground state electronic structure, the Co L-edge structure was insensitive to the heteroatom identity and number and position of Co ions that differentiate the activity of the different Co POMs.
3.2 Nickel-based WOCs
Dinça and co-workers reported on electrodeposited Ni oxide WOCs (NiCats), similar to the electrodeposited CoCat reported by Nocera et al., which show reasonable water oxidation activity under ambient conditions.57,69 Risch and co-workers (2011) used XAS to study the electronic and atomic structure of two active NiCats, synthesized either from a phosphate buffer at pH 7 or from an aqueous borate (Bi) buffer at pH 9.2.70 Ni K-edge XANES studies indicated that the oxidation state of the KPi-NiCat was close to Ni3+, whereas that of the Bi-NiCat was between Ni3+ and Ni4+. Ni–O bond lengths obtained from EXAFS analysis allowed a more accurate determination of the Bi-NiCat oxidation state. Using a relation between the Ni–O bond length and Ni oxidation state obtained from the literature, the oxidation state was found to be 3.8+ for Bi-NiCat. EXAFS analysis of the Bi-NiCat suggested a layered γ-NiOOH-like structure, with borate and water molecules between the oxide layers. Comparison of the EXAFS spectra of Bi-NiCat and CoCat indicated a similar layered oxide structure for both catalysts, as shown in Fig. 14.58 Comparison of the Ni–Ni bond length of the Bi-NiCat to CoCat indicated a common M–M distance of 2.81 Å, indicating the presence of di-μ-O(OH) bridging between metal ions for both NiCat and CoCat. The higher intensities of the peaks at reduced distances of 4.9 Å and 5.6 Å indicated more long-range order for the NiCat than that observed for the CoCat. Overall, the atomic structure of the NiCat seems to be very similar to that of CoCat and several of the common features are also observed in the biological Mn4Ca(μ-O)n complex of photosystem II.71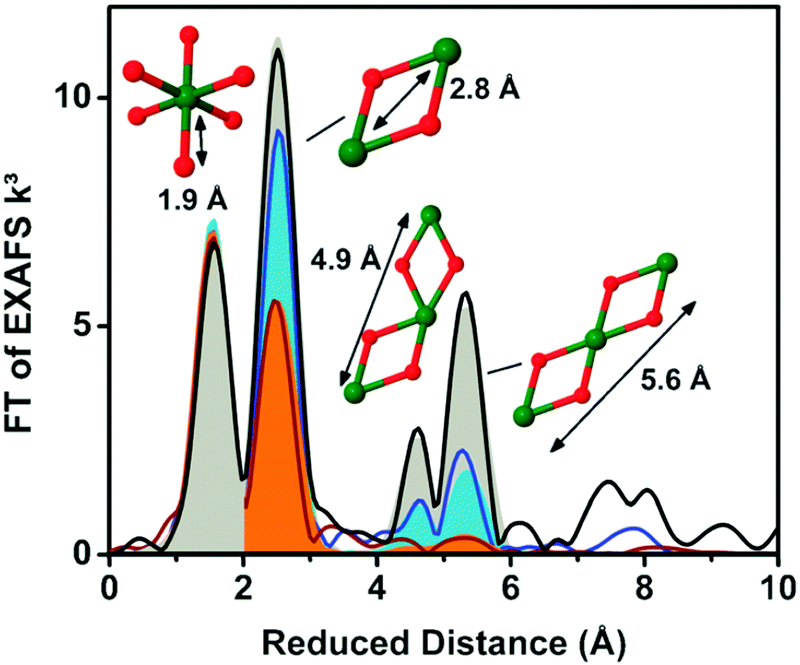 | ||
| Fig. 14 FT of the EXAFS structures of (a) Bi-NiCat (blue) and (b) CoCat (red) and (c) crystals of layered Co oxide LiCoO2 (black). Reproduced from ref. 70 with permission from the Royal Society of Chemistry. | ||
A similar Ni-based catalyst was studied with XAS by Singh et al. (2013).45 They investigated a NiOx WOC electrodeposited from [Ni(en)3]Cl2, with en = 1,2-diaminoethane, in a 0.10 M borate buffer solution at pH 9.2. Both Ni K-edge XANES and EXAFS showed spectral shapes consistent with γ-NiOOH films, confirming the results by Risch and co-workers.70
Sun and co-workers (2012) used L-edge XAS to determine the oxidation state of Ni in a NiOx functionalized silicon and found Ni2+ as the dominant species in both pre-annealed and annealed samples.72
3.3 Manganese-based WOCs
The Mn–oxide complex in nature's photosystem II is considered the most active water oxidation catalyst at low over-potentials.73 The activity has in part been ascribed to a leveling of the potential by the distribution of Mn 3+ and 4+ oxidation states within the catalyst. Over the past few years, several studies have been conducted on the use of heterogeneous Mn oxides as catalysts for OER.74,75 The water oxidation activity of most Mn-based systems is, however, drastically suppressed at neutral pH. Recently, in situ optical absorption studies suggested that surface associated Mn3+ ions act as precursors for OER.76 At pH values lower than 9, Mn3+ decomposed to Mn2+ and Mn4+. The lower water oxidation activity under neutral conditions was attributed to a lack of active Mn3+ ions.XAS study on an electrodeposited Mn-based catalyst comparable to the CoCat presented by Nocera et al.57 was reported by Zaharieva et al. (2012).48 Voltage cycling was needed for this structure in order to get an active Mn catalyst which is in contrast with electrodeposited Co- and Ni-based catalysts, where electrodeposition at constant potential resulted in catalysis.58,70 Mn K-edge XANES and FT EXAFS determined the structural differences between the inactive Mn oxide catalyst formed from electro-deposition at constant potential and the active catalyst prepared by a voltage-cycling protocol (Fig. 15). Mn K-edge XANES indicated an oxidation state of 3.8+ for the active Mn catalyst, whereas the inactive catalysts showed an oxidation state of 4.0+. The shape of the XANES spectrum of the inactive Mn oxide indicated a birnessite-type layered structure, whereas the active Mn catalyst suggested a less ordered ligand environment. The FT EXAFS spectra indicated coordination of the Mn by six oxygens at a distance of 1.89 Å and the presence of di-μ-oxo bridges for both materials, confirming the presence of MnIVO6 in both the active and inactive phases. A difference in the peak intensities at higher reduced distances indicated a higher degree of order for the inactive Mn oxide.
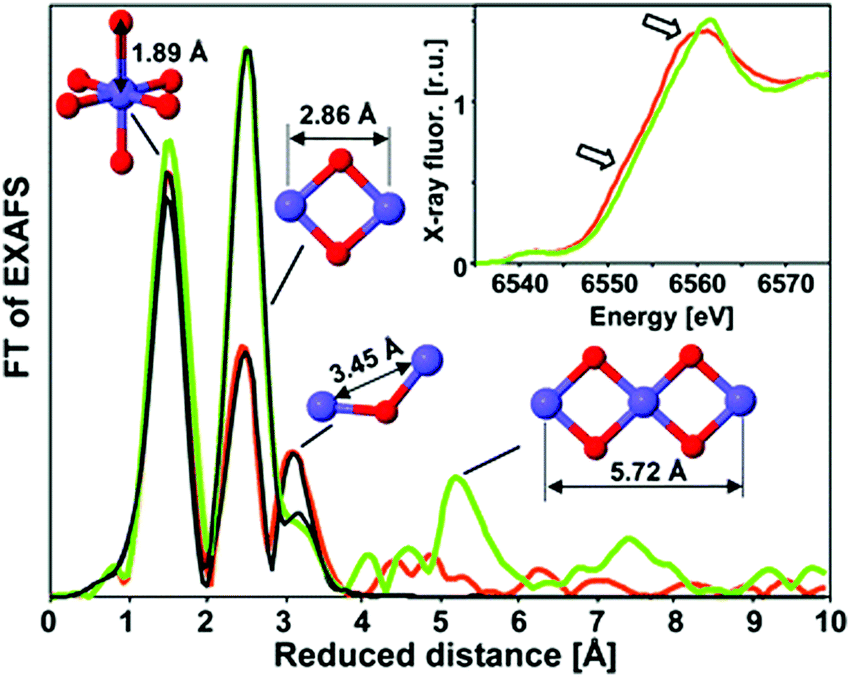 | ||
| Fig. 15 XAS structures of the active MnCat (orange) and the inactive oxide (green). The FT EXAFS spectra are compared to EXAFS simulations shown in black. The inset shows the XANES region. Reproduced from ref. 48 with permission from the Royal Society of Chemistry. | ||
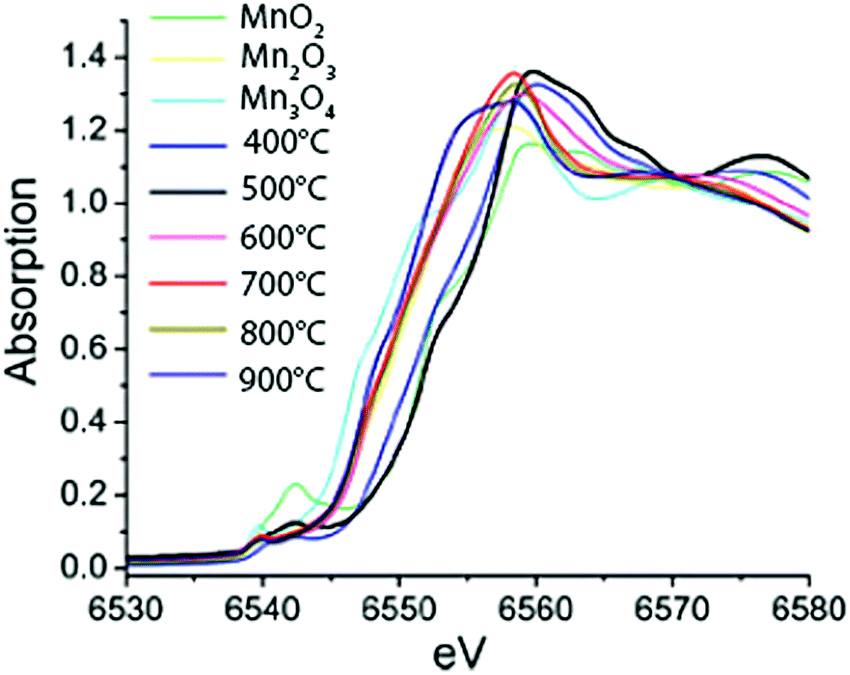
The effect of calcination temperature on structure and catalytic activity was explored for a set of Mn-based WOCs using XAS on a highly active mesoporous MnOx material77 and a nanostructured Mn oxide cluster on silica.78 The calcination temperature affected the Mn phase formed and the highest water oxidation activity was observed for the catalyst calcined at ∼600 °C. Upon increasing the calcination temperature from 150 to 550 °C, Kuo et al. found that the Mn K-edge absorption edge showed a 0.4 eV energy shift towards higher energies, consistent with an increase in the oxidation state from 2.77 to 2.97.77 However, Jiao et al. observed a slightly different trend at higher calcination temperatures ranging from 500 °C to 900 °C (Fig. 16). Analysis of the edge position on the nanostructured MnOx cluster on silica indicated a decrease in the mean oxidation state from 4+ to 3+ to 2.85+ with increasing calcination temperature. Further analysis yielded fractional compositions of MnO2, Mn2O3 and Mn3O4 at all calcination temperatures. Despite the opposite trend, both studies concluded that the catalyst with the highest activity consisted mainly of Mn2O3. Consequently, Mn3+ was suggested to be the most efficient species for water oxidation catalysis. Whereas the studies discussed above on Mn oxide catalysts claim the prevalence of a single structural polymorph, this finding was questioned by Robinson and co-workers (2013) based on the study on eight different Mn oxides containing Mn3+ and Mn4+.47
 | ||
| Fig. 16 XANES spectra of MnOx materials calcined at different temperatures together with reference spectra of micron-sized particles of MnO2, Mn2O3 and Mn3O4. Reproduced from ref. 78 with permission from the Royal Society of Chemistry. | ||
Hocking et al. (2011) used XAS experiments to study the atomic structure of various Mn clusters in a Nafion polymer matrix12 to determine the active species. The catalysts were synthesized by loading a tetra-nuclear Mn cluster [Mn4O4L6]+, with L = diarylphosphinate, a [(bipy)2Mn(O)2Mn(bipy)2]3+ complex and a [Mn(OH2)6]2+ complex into Nafion. Significant water oxidation activity was only observed after electro-oxidation of the precursor complexes and was similar for the catalysts prepared from the different starting materials. This suggested that different Mn precursor complexes can lead to the same MnOx catalyst film upon electro-oxidation.
Mn K-edge XANES and EXAFS spectra acquired for the three precursors in acetonitrile (reference), loaded into Nafion (precursor) and the active MnOx catalyst formed after electro-oxidation of the precursor showed significant differences. The precursors showed an oxidation state of 2+, reduced from the reference oxidation state, while MnOx catalyst had an average oxidation state of 3.75–3.85. EXAFS patterns of the three different Mn precursor materials loaded into Nafion had significantly different EXAFS structures, but upon electro-oxidation, gave similar EXAFS spectra. These patterns are consistent with the disordered Mn3+/4+-oxide phase, which accommodates water and cations in the interlayer space (Fig. 17). Although the EXAFS structures of the three electro-oxidized products are similar, the product formed from the [Mn(OH2)6]2+ precursor showed a more pronounced intensity at k = 8 Å−1, indicating a more ordered lattice structure.79
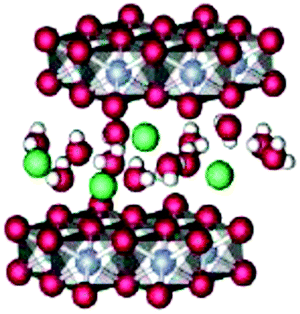 | ||
| Fig. 17 Schematic representation of the crystal structure of birnessite, which consists of sheets of edge-sharing MnO6 octahedra with intercalated cations and water in the interlayer space. Mn4+/3+ is given in blue, oxygen in red, hydrogen in white and the cation in green. Reprinted with permission from ref. 80. Copyright 2013 American Chemical Society. | ||
Singh et al. (2013) found results consistent with Hocking et al. (2011).12 The XAS spectra of two precursors, [MnIV(Me2TACN)(OCH3)3]+ (1) and [(Me3TACN)2MnIII2(μ-O)(μ-CH3COO)2]2+ (2) (Fig. 18), that led to the most active WOCs were compared to a [Mn(OH2)6]2+ precursor. XAS patterns of the parent compounds showed significantly different oxidation states and connectivity when compared to the electro-oxidized materials. Further, the Mn K-edge EXAFS patterns for the electro-oxidized product of (1), (2) and [Mn(OH2)6]2+ showed no changes and matched well with the EXAFS pattern observed for natural and synthetic birnessite.
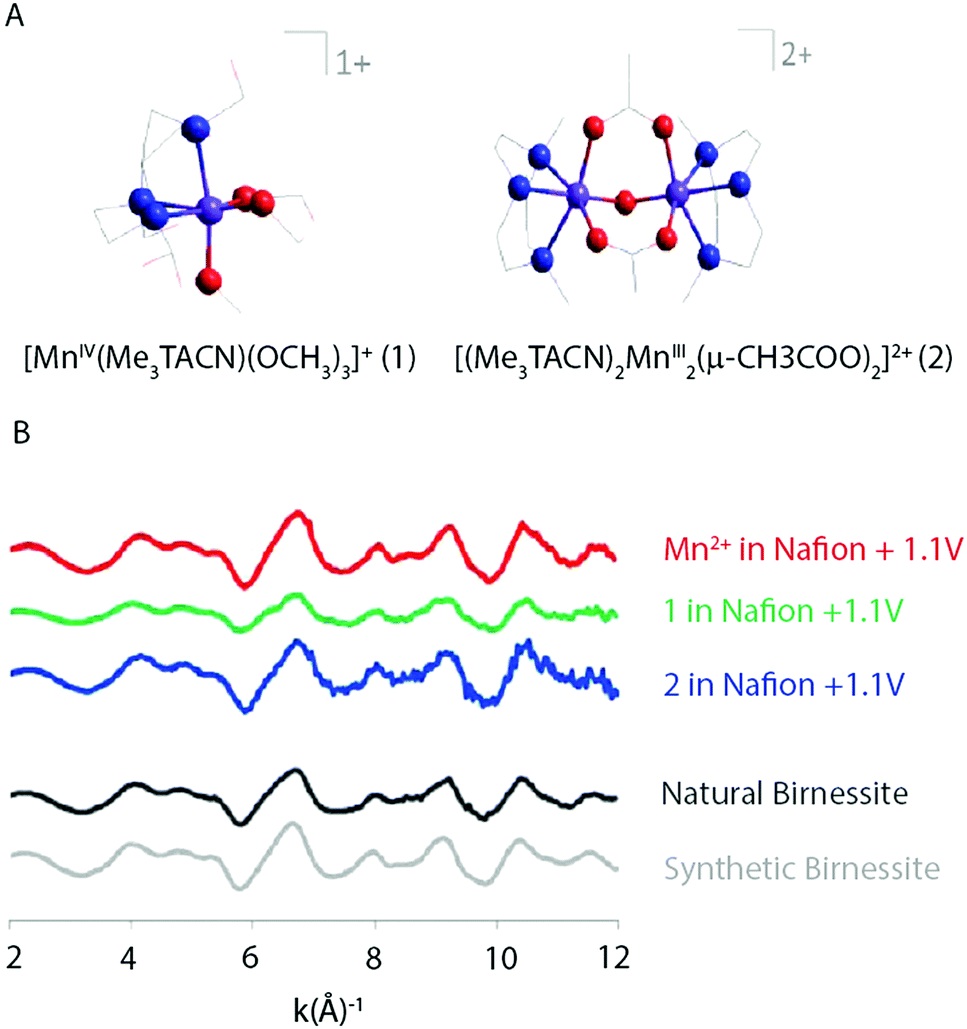 | ||
| Fig. 18 (A) Structure of the two precursor complexes studied by Singh and co-workers. (B) k3 weighted EXAFS spectra of the electro-oxidized products of Mn2+, (1) and (2) in Nafion and natural and synthetic birnessite. Reproduced from ref. 45 with permission from the Royal Society of Chemistry. | ||
The effect of light and applied potential on the precursor [Mn4O4L6]+ material for MnOx was studied by Mn K-edge XAS experiments, as shown in Fig. 19.12 State 1 is the precursor consisting of Mn2+ compounds. Upon applied potential, the edge position shifted towards higher energies, suggesting an oxidized Mn3+/4+ product (state 2). When this oxidized Mn3+/4+ was exposed to light in aqueous solution for 40 minutes, the edge position shifted towards lower energies, indicating photo-reduction back to Mn2+ (state 3). Subsequently when the electrode was immersed in an electrolyte and a potential was applied again (state 4), re-oxidation to the Mn3+/4+ species occurred. The electrode was then exposed to light for only 20 minutes (state 5) and afterwards XANES indicated a slow photo-reduction process. The study confirmed a self-healing mechanism to the active Mn3+/4+ with applied potential from the reduced Mn2+ precursor state. The structure after light exposure, exposure to applied potential, and following water oxidation catalysis for 90 minutes was consistent with a Mn3+/4+ oxidation state. The comparison of the XANES for the different states revealed two isosbestic points, suggesting a facile interconversion between Mn2+ and Mn3+/4+ during water oxidation. Essentially, the Mn ions can assemble to form a high-surface area catalyst, similar to that observed for Nocera's CoCat.57
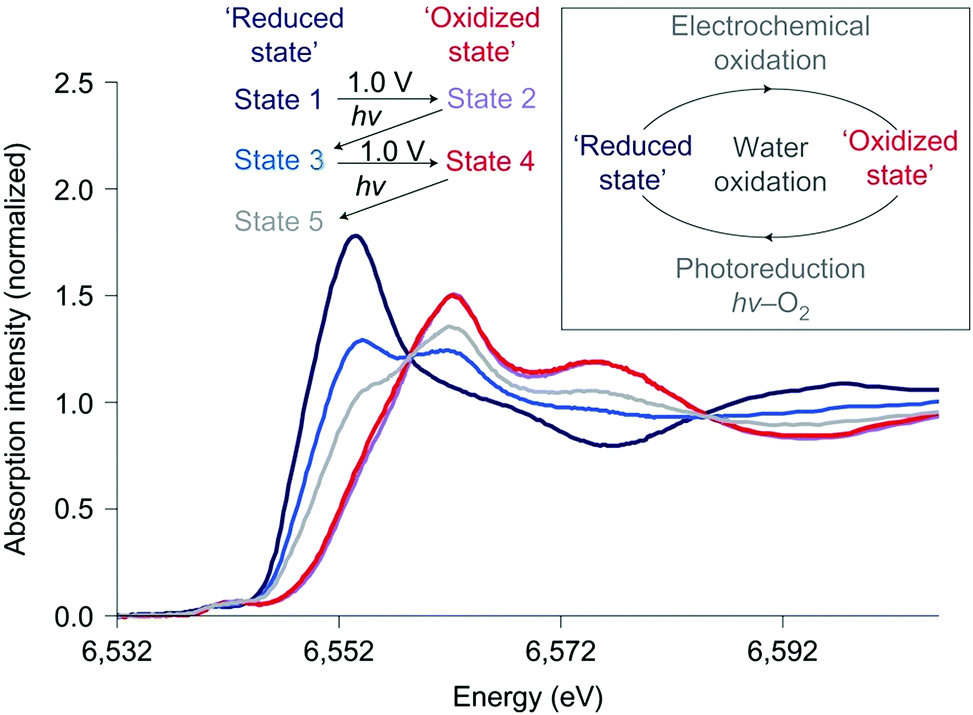 | ||
| Fig. 19 Mn K-edge XANES spectra of the Nafion-coated [Mn4O4L6]+-loaded glassy carbon electrode. Spectra are measured at different states of photochemical cycling. Adapted by permission from Macmillan Publishers Ltd: Nature Chemistry (ref. 12), copyright 2011. | ||
Mn L-edge XAS experiments by Kahn et al. (2014) indicate that Mn centers in MnOx nanoparticles loaded and electro-oxidized in Nafion are highly oxidized.81 Furthermore, a higher proportion of Mn3+ over Mn2+/4+-like states was observed for the most active WOC. This is consistent with previous studies, where a greater proportion of Mn3+ species was associated with a local structural distortion and improved catalytic activity.82
3.4 Overview of metal K-edge XAS
K-edge XANES was used to study the oxidation state of various WOCs, whereas EXAFS provided information about the atomic structure of the metal atom, such as coordination number and bond-lengths of neighboring atoms. Table 2 gives an overview of the results found for the Co-, Ni-, and Mn-based WOCs.| Ref. | Sample | State | Ox. state | NM–M | M–M (Å) | NM–O | M–O (Å) |
|---|---|---|---|---|---|---|---|
| Risch 200958 | KPi-CoCat* | Upon electro-oxidation | 3 | — | 2.81 | 6 | 1.89 |
| Risch 201259 | KPi-CoCat* | Upon electro-oxidation | 3.1 | 3.3 | 2.81 | 6.0 | 1.89 |
| LiOAc-CoCat* | Upon electro-oxidation | 3.1 | 3.9 | 2.82 | 6.1 | 1.89 | |
| KOAc-CoCat* | Upon electro-oxidation | 3.0 | 4.5 | 2.83 | 6.30 | 1.90 | |
| KCl-CoCat* | Upon electro-oxidation | 2.6 | 3.4 | 2.85 | 5 | 1.91 | |
| CaCl2-CoCat* | Upon electro-oxidation | 3.0 | 5.3 | 2.84 | 6.5 | 1.90 | |
| Ohlin 201146 | Co-POM (1)* | Upon synthesis | 2 | — | ∼3.2 | — | ∼1.9 |
| Co-POM (2) | Upon synthesis | 2 | — | ∼3.2 | — | ∼1.9 | |
| Schiwon 201465 | Co-POM (3) (s) | Upon synthesis | 2 | 2.5 | 3.19 | 6.0 | 2.05 |
| Co-POM (3) (l) | Upon synthesis | 2 | 2.5 | 3.19 | 6.7 | 2.04 | |
| Co-POM (4) (s) | Upon synthesis | 2 | 1.5 | 3.8 | 6.5 | 2.05 | |
| Risch 201170 | Bi-NiCat* | Upon electro-oxidation | 3.8 | 4.4 | 2.8 | 6.3 | 1.88 |
| KPi-NiCat | Upon electro-oxidation | 3 | — | — | — | — | |
| Zaharieva 201248 | MnCat* | Upon voltage cycling | 3.8 | 2.6 | 2.86 | 5.3 | 1.89 |
| Mn oxide | Upon electro-oxidation | 4 | 4.3 | 2.86 | 5.9 | 1.89 | |
| Kuo 201577 | MnOx on silica* | Upon synthesis | 3 | — | — | — | — |
| Jiao 201078 | MnOx on silica* | Upon synthesis | 3 | — | — | — | — |
| Hocking 201112 | Mn in Nafion* | Upon electro-oxidation | 3.8 | — | ∼2.9 | 6 | ∼1.9 |
| Singh 201345 | Mn in Nafion* | Upon electro-oxidation | — | — | — | — | — |
Most of the WOCs had an average oxidation state of ∼3+. While the CoCats are fairly close to a 3+ Co oxidation state, the KPi-NiCat and MnCat had metal oxidation states that reached 3.8+. The MnOx WOCs are close to a Mn 3+ oxidation state. Deviations from these oxidation states were correlated with lower activity. The KCl-CoCat, showing the lowest activity among the CoCats, gave a slightly lower average oxidation state of 2.6+. The inactive Mn oxide had a higher oxidation state of 4+.
The metal–oxygen coordination number (NM–O) of ∼6, the M–O bond length of ∼1.9 Å and the metal–metal (M–M) bond length of ∼2.8 Å were consistent among the solid state Co-, Ni- and Mn-based WOCs12,48,59,70 and suggest that these WOCs have di-μ-O(OH) bridges with edge-sharing Mn+O6 octahedra. Some exceptions to this structure are evident. A deviation from the M–O coordination (NM–O) of ∼6 was found for the active MnCat48 and the least active CoCat KCl-CoCat,59 both of which showed a NM–O closer to 5. Furthermore, the metal–metal coordination number (NM–M) varied most among the different WOCs, but showed no trend with water oxidation activity.
Various studies reported the use of EXAFS to probe the degree of order by analyzing the peak intensities at higher reduced distances. Most studies concluded that a lower degree of order resulted in higher water oxidation activity.48,59,70 For Zaharieva et al., this was the only clear difference in structure observed between the inactive and active Mn oxide materials.48 Based on this trend, it has been suggested that less stable structures ensure availability of terminal coordination sites for binding molecular water species.48,59
Overall, the ground state atomic and electronic structures of the more active, as-prepared Mn, Co, and Ni oxide catalysts demonstrate significant similarities. They have a metal oxidation state of ∼3+, are characterized by a M–O distance of ∼1.9 Å, are comprised of di-μ-O(OH) bridges with edge-sharing M3+O6 octahedra, and exhibit structural disorder by EXAFS. The data also indicate that there are exceptions to these trends, though they cannot be correlated with activity. For the active CoCat, Co4(μ-O4) cubanes may also contribute and could not be excluded by EXAFS data.58,59 The di-μ-oxo bridging, believed to be integral to the biological Mn4Ca(μ-O)n complex in photosystem II, was also present in the inactive Mn oxide.48
The homogeneous Co POM catalysts showed significant differences when compared to their heterogeneous counterparts. The 2+ oxidation state observed for the highly active molecular, homogeneous Co POMs was significantly lower than the oxidation state observed for the heterogeneous catalysts, but consistent among the various Co POMs. Co POMs (1) and (2) had a M–O bond length of ∼1.9 Å, whereas Co POMs (3) and (4) yielded slightly longer M–O bond lengths of ∼2.05 Å. The Co POMs with a core of 4 Co atoms showed a M–M bond length of ∼3.2 Å, whereas Co-POM (4), which has two metal cores with only 3 Co atoms each, gave a slightly higher M–M bond length of 3.8 Å.
4 In situ metal K-edge XAS experiments
Although ex situ XAS experiments are valuable to study the chemical structure of water splitting catalysts before or after reaction, the chemical state of a catalyst will change during a reaction, creating meta-stable intermediates. In situ XAS experiments provide the ability to study the structure and electronic properties of catalysts while a reaction is proceeding and can thereby contribute towards a better understanding of the structure–activity relationships, as the actual active phase can be monitored. The high X-ray energy needed for 3d metal K-edge XAS makes this technique extremely suitable for in situ experiments, as vacuum is not required and experiments can be performed under ambient conditions. Furthermore, at the X-ray energies needed for metal L-edge XAS or oxygen K-edge XAS, absorption of the electrolyte requires advanced set-ups, making L-edge in situ experiments challenging.When applying a potential equal to or higher than the water oxidation onset and/or light illumination, ideally the transition metal oxide radical thought to be the catalytic intermediate required for O–O bond formation is created. This radical is created by the transformation of holes into a molecular species at the transition metal oxide/electrolyte interface. While under steady state current evolution the catalytic cycle turns over many times, a number of electrochemical and spectro-electrochemical experiments suggest that a large population of such transition metal oxide radicals are created at the electrolyte interface under steady state conditions.8–10 Therefore, changes in oxidation state observed by steady state, in situ XAS should be reflective of these transition metal oxide radicals. However, under the conditions of steady state current evolution, one should keep in mind that XAS in principle monitors an average oxidation state of a dynamic system. The catalyst will be oxidized by hole injection due to the applied potential or light illumination and reduced by electron injection due to water oxidation. Furthermore, XAS is a bulk sensitive technique, and therefore an average oxidation state change of bulk and surface charge is measured. A higher oxidation state of the metal generated by reaction conditions, therefore, only indicates that surface metals have been oxidized and cannot determine whether a full oxidation state change has taken place. Since metal K-edge XAS dominates in situ studies of water oxidation catalysts, the information primarily concerns the metal oxidation state.
This section first reviews the XAS and EXAFS structural studies of Co-, Mn- and Ni-based WOCs under reaction conditions, then gives an overview of the results, and reports the results in Table 3.
| Sample | In situ conditions | O.S. change | O.S. ex situ | Structure |
|---|---|---|---|---|
|
Co-Pi CoCat
Kanan 201083 |
Electrochem.
OCV → 1.25 V |
<3+ → >3+ |
∼3+
upon elec. ox.58,59 |
HxCoO2 |
|
Co-Pi CoCat on Au
Friebel 201384 |
Electrochem.
−0.8 V → 1.0 V |
3+ → >3+ |
∼3+
upon elec. ox.58,59 |
HxCoO2 |
|
Co3O4 spinel
Bergmann 201585 |
Electrochem.
1.0 V → 1.62 V vs. RHE |
2+/3+ → 3+/4+ |
2.67
upon synth.85,86 |
Co3O4 → CoOOH |
|
Co3O4 spinel
Wang 201686 |
Electrochem.
0.5 V → 1.0 V |
2.67+ → 3+/4+ |
2.67
upon synth.85,86 |
Co3O4 → CoOOH |
|
CoOx NPs on CNT
Seo 201687 |
Electrochem.
OCV → 1.8 V vs. RHE |
2.4+ → 2.8+ (particle size: 6.3 nm) | — | Co3O4 and/or CoO → Co3O4 + CoOOH |
|
Ni-Bi-Cat (non-activated)
Bediako 201288 |
Electrochem.
0.4 V → 1.0 V |
2+ → 3.16+ |
3.8+
upon elec. ox.70 |
β-NiOOH |
|
Ni-Bi-Cat (activated)
Bediako 201288 |
Electrochem.
0.4 V → 1.0 V |
2+ → 3.6+ |
3.8+
upon elec. ox.70 |
γ-NiOOH |
|
Ni-Bi-Cat
Yoshida 201491 |
Electrochem.
0.2 V → 1.1 V |
2.1+ → 3.8+ |
3.8+
upon elec. ox.70 |
Ni(OH)2 → γ-NiOOH |
|
MnOx/Au–Si3N4
Gorlin 201380 |
Electrochem.
−0.8 V → 1.0 V |
2.8+ → 3.6+ |
3+
upon synth.77,78 |
Birnessite-like phase + MnII,III,III3O4 |
|
MnOx/Nb:SrTiO3 (film)
Yoshida 201392 |
Electrochem.
−1.3 V → + 1.7 V |
3+ → >3+ | — | — |
|
Photo-electrochem.
1.2 V → 1.2 V + UV |
2.8+ → 3.6+ | — | — | |
|
MnOx/Nb:SrTiO3 (NPs)
Yoshida 201392 |
Photo-electrochem.
1.2 V → 1.2 V + UV |
3+ → 2+/3+/4+ | — | — |
|
MnOx/SrTiO3
Yoshida 201493 |
Photo-electrochem.
0.5 V → 0.5 V + UV |
3+ → >3+ | — | — |
|
Photo-electrochem.
0.0 V → 0.0 V + UV |
3+ → >3+ (slow) | — | — | |
|
Photo-electrochem.
−0.5 → −0.5 + UV |
3+ → 3+ | — | — |
4.1 Cobalt-based WOCs
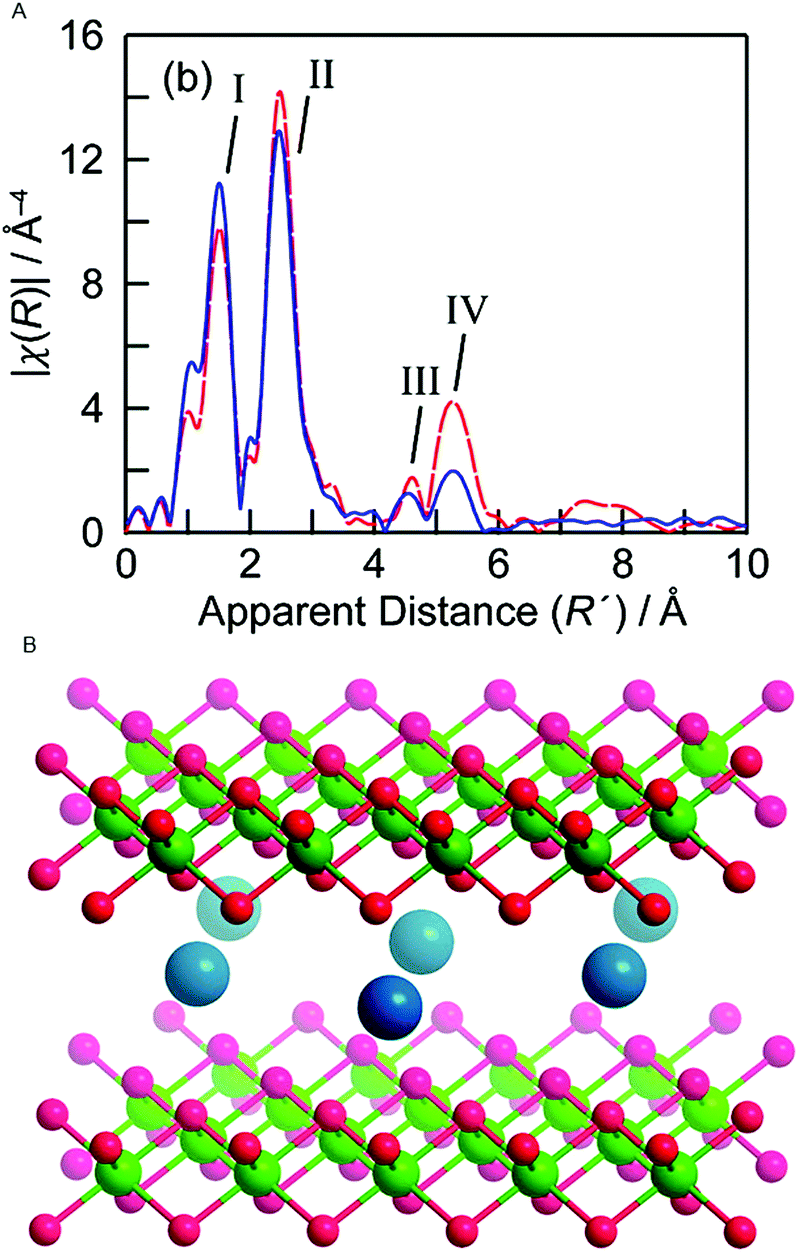
The atomic and electronic structure of Nocera's Co-Pi CoCat during active catalysis was studied by Kanan et al. (2010).57,83 Both a thin surface film of approximately monolayer thickness and a thicker bulk film with >10× more material were studied in an in situ XAS experiment. Experiments studied the oxidized intermediate during catalysis at 1.25 V (all voltages are reported with respect to the normal hydrogen electrode (NHE) unless stated otherwise) and the electronic structure of the catalyst state when this potential is removed and the system is left at open circuit potential (OCP). The XANES structures for both the bulk and surface Co-Pi films at 1.25 V and OCP are given in Fig. 20A.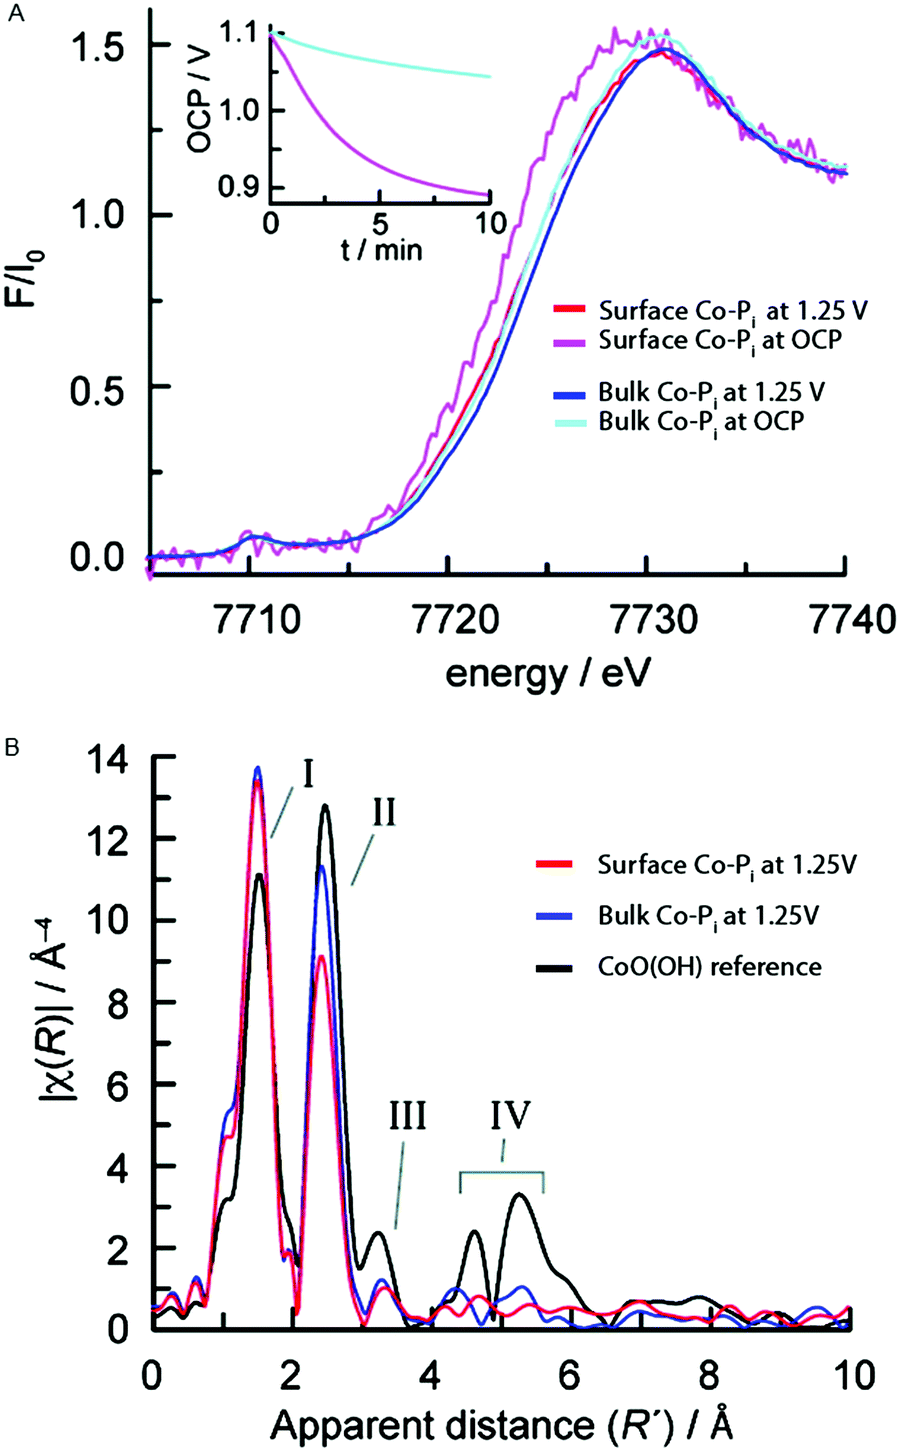 | ||
| Fig. 20 (A) In situ XANES structures for the surface Co-Pi at 1.25 V (red) and OCP (magenta) and the bulk Co-Pi sample at 1.25 V (blue) and OCP (cyan). The inset shows the OCP traces for the bulk and surface films. (B) FT EXAFS structures for the bulk and surface Co-Pi at 1.25 V are shown in blue and red, respectively. Black represents a CoO(OH) reference. Reprinted with permission from ref. 83. Copyright 2010 American Chemical Society. | ||
The edge position indicated a Co valence state higher than 3+ for both the bulk and surface Co-Pi films during water oxidation catalysis at 1.25 V. The inset in Fig. 20A shows the OCP vs. time traces, indicating that the Co-Pi is returning to equilibrium at OC during this time. When switching from 1.25 V to the OCP, the absorption edge shows a continuous shift towards lower energies. This indicates that the metal is reduced due to electron injection from water caused by residual water oxidation. The edge-shift to lower energy was more pronounced (∼1.0 V) for the thin film compared to the thick film (∼0.3 V), indicating that a larger fraction of Co ions in the surface Co-Pi sample are reduced compared to the bulk Co-Pi sample within the time frame of the measurement.
FT EXAFS structures of the bulk and surface sample under a potential of 1.25 V and at OCP are shown in Fig. 20B. Two prominent peaks, I and II, were present and reflect the Co–O and Co–Co vectors respectively. The vectors indicated a Co–O distance of 1.89 Å and a Co–Co distance of 2.82 Å, indicating a similar edge-sharing CoO6 octahedral CoCat structure as reported in the ex situ K-edge experiments by Risch and co-workers.58,59 The higher intensity of the Co–Co vector (peak II) for the bulk sample indicated a larger average number of Co–Co vectors per Co ion, as can be expected when comparing a bulk sample to a surface sample. Peaks III and IV could be related to contributions from outer shells and their weak intensities indicated a low degree of order for the edge-sharing CoO6 octahedra, again consistent with the ex situ experiments by Risch et al.59
In 2013 Friebel et al. studied the chemical state of a CoPi CoCat during water oxidation catalysis using a HERFD XAS mode.84 HERFD XAS gives a more detailed spectrum due to a reduced lifetime broadening, making this mode suitable for studies of the weak pre-edge structure, caused by 1s → 3d transitions. Measurements were carried out under different potentials, ranging from −0.8 V to 1.0 V. The acquired HERFD XAS spectra are given in Fig. 21. Upon increasing the potential the main absorption edge shifts towards higher energy, indicating an increased amount of Co4+ species. At low potential the pre-edge structure shows a sharp peak at 7710.2 eV and a broader feature at 7712.5 eV. The peaks were assigned to both local and non-local transitions of high spin Co3+ in an octahedral environment. Local transitions involve the 1s3d quadrupole excitations and non-local transitions involve the 1s4p dipole transitions to the 3d-band, where the energy difference is given by the core hole potential.38 When switching to higher potentials, the sharp lower energy peak increases in intensity and broadens towards higher energy. Analysis of the changes in the pre-edge structure by least square fits suggested the presence of a third peak at 7710.9 eV, which is assumed to be a contribution from Co4+ ions in HxCoO2. Both edge and pre-edge analyses thus indicate that applying a potential results in oxidation of a fraction of the Co3+ species to Co4+.
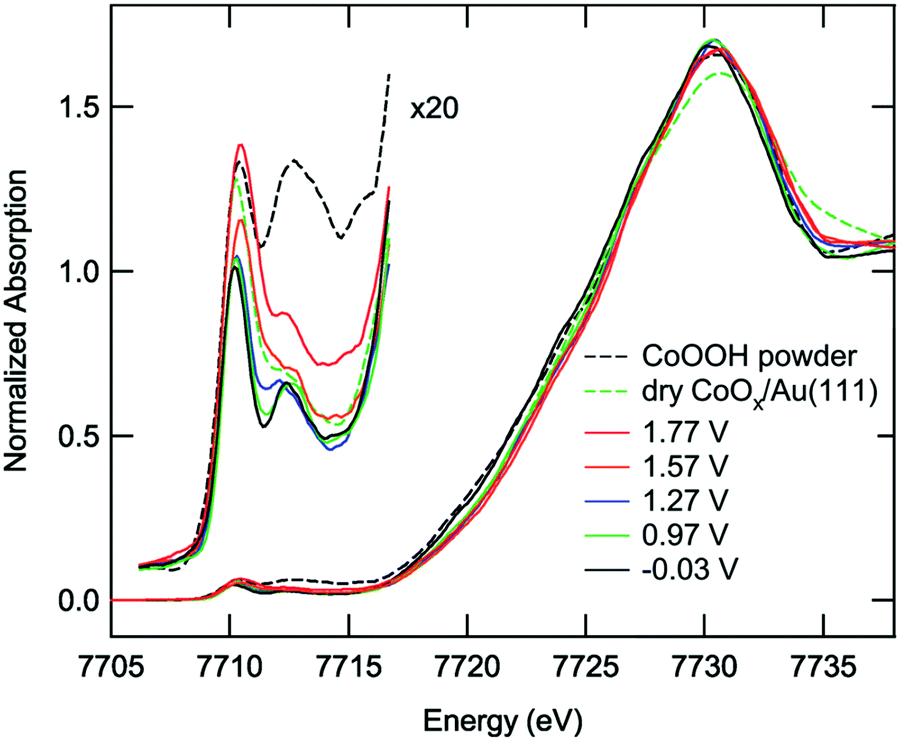 | ||
| Fig. 21 In situ HERFD XAS structures of the Co-Pi-CoCat on Au at different potentials. Furthermore the spectra of a dry, as-prepared Co/Au sample and a CoOOH(s) reference sample are shown. Reproduced from ref. 84 with permission from the PCCP Owner Societies. | ||
A slightly higher Co oxidation state was found for the CoCat in neutral phosphate buffer studied by Kanan83 when compared to that of the CoPi in alkaline buffer studied by Friebel.84 The difference in Co oxidation state was ascribed to different solubility of the Co2+ ions at various pH values. The high solubility of Co2+ at low pH results in the formation of small cobaltate clusters, whereas at higher pH, the solubility of Co2+ is reduced by 12 orders of magnitude. Therefore, at high pH, large aggregates of HxCoO2 form and limit the proton exchange via CoOOH + (1 − x)OH− → HxCoO2 + (1 − x)H2O + (1 − x)e−, with x < 1. This reaction hampers the proton exchange between CoOOH and H2O and thereby impedes the formation of new oxidation states under alkaline buffers.
Bergmann and co-workers (2015) studied the crystalline Co-oxide Co3O4 spinel.85 This Co3O4 catalyst has been widely explored as an active OER catalyst and shares structural motifs with Nocera's CoCat as it consists of Co-deficient CoO6 layers, which are connected via octahedral Co3+ ions and tetrahedral Co2+ ions.57,85 Bergmann and co-workers used in situ Co K-edge XAS to study the structural changes of the electrocatalyst during OER (Fig. 22). XANES studies indicated a mean oxidation state between 2+ and 3+ for the as-prepared catalyst, consistent with Co3O4, whereas upon increasing the electrode potential to OER conditions (+1.62 V vs. RHE) the mean oxidation state increased, indicating a higher amount of Co3+ and Co4+ ions. EXAFS identified changes in the Co coordination during OER, where the OER-active state at +1.62 V vs. RHE contained more di-μ-oxo bridged octahedrally coordinated Co ions. After OER, both the XANES and EXAFS structures showed high similarities with the as-prepared catalyst, suggesting that the structural changes were reversible. The geometry of the Co3O4 catalyst was also studied by Wang and co-workers (2016).86 To investigate the active species in the catalyst, in situ Co K-edge XAS was used to compare the structure of the Co3O4 catalyst to various model catalysts where the tetrahedral Co2+ ions or octahedral Co3+ ions were substituted with inactive ions. The in situ XAS studies with a voltage range of 0.5 to 1.0 V suggested that the tetrahedral Co2+, which is capable of releasing electrons under applied bias, is responsible for the formation of the active CoOOH species.
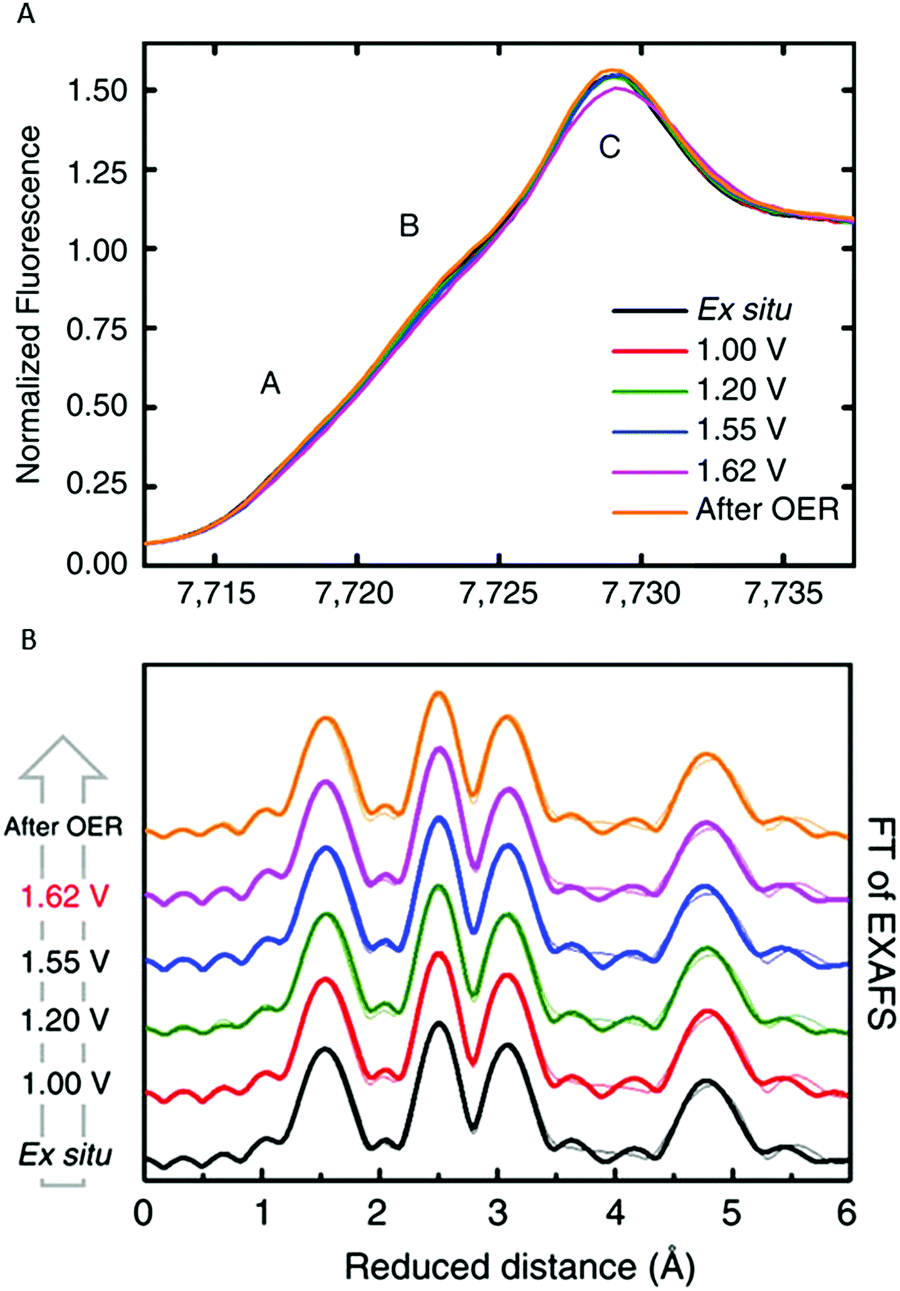 | ||
| Fig. 22 (A) In situ XANES structure of the Co3O4 spinel catalyst. (B) In situ EXAFS structure of the Co3O4 spinel catalyst. Reproduced with permission from ref. 85 under a Creative Commons License CC-BY 4.0. | ||
In situ Co K-edge XAS was used by Seo et al. (2016) to study the structure of cobalt oxide nanoparticles of different sizes supported on carbon nanotubes.87 XANES spectra of the CoOx catalyst at OCV and OER potential (1.8 V vs. RHE) indicated that regardless of the CoOx particle size, the average oxidation state of Co increased upon increasing the potential to the OER potential. Furthermore, XANES analysis using linear combination fitting and EXAFS studies indicated a phase transformation of Co3O4 and/or CoO for the as-prepared catalyst to a Co3O4 mixed phase in the active catalyst in OER. By combining the electronic and structural information obtained by the in situ XAS experiments with electrocatalytic activity trends it was suggested that Co3+ species are related to the active intermediates for OER.
4.2 Nickel-based WOCs
In 2012 Bediako et al. studied the electronic and atomic structure in electro-oxidative activated and non-activated NiBi-NiCats using in situ XAS.88 During the electro-oxidative activation the catalyst was held at a potential of 1.1 V in a 1 M KBi electrolyte (pH = 9.2) for 2.5 hours and an activity increase of three orders of magnitude was observed when compared to a non-activated NiBi-Cat. This contrasts with the CoCats, where high WOC is observed directly upon electro-deposition. Ni K-edge XANES structures were collected for both samples at a potential below the onset for water oxidation catalysis (0.4 V) and at a potential at which oxygen evolution catalysis occurs (1.0 V). At the potential of 0.4 V, nickel centers are found to be in a 2+ oxidation state for both the activated and non-activated catalyst. This oxidation state is lower than that observed in the ex situ experiments by Risch and co-workers,70 which can be explained by reduction due to the applied potential (0.4 V). During water oxidation at a potential of 1.0 V, the non-activated Ni-Bi exhibits an oxidation state of 3.16+, whereas the activated Ni-Bi exhibits a mean oxidation state of 3.6+. This indicates that the electro-oxidative pretreatment causes an increase in the presence of Ni 4+ species by a factor of ∼3. The oxidation state of the activated Ni-Bi closely resembles that of the Ni-Bi in the ex situ state,70 suggesting that major changes are predominantly due to the electro-oxidative pretreatment of the catalyst rather than due to reaction conditions.EXAFS was used to study the local geometry of the Ni centers (Fig. 23). The FT EXAFS of the activated NiCat indicated a Ni–O distance of 1.88 Å and a Ni–Ni distance of 2.82 Å, consistent with a γ-NiOOH structure and the structure reported by ex situ XAS studies by Risch et al. (2011).70 The non-activated catalyst showed a EXAFS structure more similar to the Jahn–Teller distorted β-NiOOH, with a Ni–O distance of 1.87 Å and a Ni–Ni distance of 2.03 Å. The oxidation state of 3.16+ found for the non-activated catalyst was consistent with a β-NiOOH phase, whereas the 3.6+ oxidation state found for the activated catalyst was consistent with a γ-NiOOH phase.
 | ||
| Fig. 23 (A) FT EXAFS structures for a γ-NiOOH reference and the Ni-Bi-cat electro-oxidized at 1.05 V. (B) Crystal structure of γ-NiOOH, with nickel in green, oxygen in red and sodium ion in blue. Water molecules intercalated between the NiO2 slabs are omitted for clarity. Reprinted with permission from ref. 88. Copyright 2012 American Chemical Society. | ||
Both the change in oxidation state and structure upon electro-oxidative activation suggest a transition from a β-NiOOH phase to a γ-NiOOH phase with a higher amount of Ni4+ species. The significantly higher water oxidation activity for electro-oxidative activated NiBi-cats suggests that γ-NiOOH can be related to a higher OER activity, challenging previous findings where the β-NiOOH phase was found to be more active in OER.89,90 Reaction conditions do not seem to change the oxidation state of the activated catalyst, either at 1.1 V or 1.15 V, where the OER activity is significantly higher. This suggests that either the transition metal oxide radical generated by hole injection traps the positive charge on the oxygen rather than on the nickel, in the form of an oxyl radical, or a minor equilibrium is established where Ni4+ catalytic intermediates formed on applying potential are quickly reduced by water oxidation.
A study on Ni-Bi by Yoshida et al. (2014) used in situ XAS experiments to study electronic and structural changes.91 The transformation to a γ-NiOOH species upon applying potential was consistent with the findings of Bediako et al. (2012) for their activated Ni-Bi-Cat. During the in situ experiment the electrode potential was increased from 0.2 V to 1.1 V, a potential above the onset for water oxidation. XANES analysis indicated the Ni species oxidized from 2.1+ to 3.8+ when going from 0.2 V to 1.1 V. The change in the local structure upon applying a potential was studied by EXAFS. At 0.2 V the local structure of Ni-Bi was in agreement with that of a Ni(OH)2 reference, whereas at 1.1 V, the structure was similar to that of γ-NiOOH.
4.3 Manganese-based WOCs
The active phases of a MnOx/Au-Si3N4 catalyst under electrochemical reaction conditions for OER were studied by Gorlin et al. (2013) using in situ XAS.80Fig. 24A shows the Mn K-edge XANES structures collected at a potential below the onset for water oxidation catalysis (−0.76 V) and at a potential at which oxygen evolution catalysis occurs (1.04 V). When increasing the voltage from −0.76 V to +1.04 V, the oxidation state showed a change from 2.8+ to 3.6+. The oxidation state of 3.6+ is higher than the 3+ oxidation state obtained in the phases of MnOx explored in the ex situ studies. While those phases were grown on different substrates, the comparison indicates that OER conditions lead to a higher Mn oxidation state in MnOx. The XANES structure of the catalyst under OER conditions showed a strong overlap with the spectrum of birnessite. However, the oxidation state of the MnOx catalyst was slightly lower than that of a birnessite standard, attributed to the contribution of some electrochemically isolated Mn(II,III,III)3O4 domains. | ||
| Fig. 24 (A) In situ XANES structure of MnOx/Au-Si3N4 film at 1.04 V together with reference spectra of α-Mn2O3, β-MnO2, Mn3O4 and birnessite. (B) EXAFS structure of MnOx/Au-Si3N4 film at 1.04 V compared to reference spectra of α-Mn2O3, Mn3O4 and birnessite. Reprinted with permission from ref. 80. Copyright 2013 American Chemical Society. | ||
The EXAFS structure of the catalyst at −0.76 V indicated a Mn3II,III,IIIO4 phase. A shift to OER conditions (1.04 V) indicated a structural change to a birnessite-like phase, as shown in Fig. 24B, and therefore bears similarity to the MnOx catalyst discussed above. However, a smaller coordination number N was found, implying a smaller particle size compared to the extended crystalline reference material or the presence of an increased amount of Mn2+.
Yoshida et al. (2013) used in situ XANES to study the photogenerated carrier transfer towards a Mn oxide cocatalyst on a n-type Nb:SrTiO3 photo-electrode.92 First the sample was studied as a function of applied potential without UV irradiation. Mn K-edge spectra were measured at several potentials between −1.3 V and +1.7 V. At a potential of −1.3 V a Mn oxidation state of 3+ was found. Upon increasing the potential from −1.3 V to −0.3 V the edge position shifted to higher energy, indicating the partial oxidation of Mn to an oxidation state higher than 3+. The oxidation of Mn upon increasing the potential on Nb:SrTiO3 implies that, under positive applied potential, holes within the Nb:SrTiO3 substrate migrate into the Mn oxide cocatalyst and electrons from the Mn oxide cocatalyst can migrate into the substrate. Upon further increase of the potential to +1.7 V, the edge position remains constant, which could be due to the steady state conditions that do not allow for an accumulation of holes in the Mn oxide cocatalyst.
Upon UV illumination of the Mn oxide cocatalyst at a constant potential of 1.2 V, a gradual shift of the edge energy suggested the oxidation of Mn2.8+ to Mn3.6+ as shown in Fig. 25A. This oxidation implies the migration of photo-excited holes from the Nb:SrTiO3 substrate to the Mn oxide cocatalyst. Similarly to the voltage dependent experiments, the oxidation state of Mn in a MnOx compound was found to increase to 3.6+. Another study by Yoshida et al. (2014) confirmed the oxidation of Mn3+ species to Mn4+ species in a Mn oxide cocatalyst on a SrTiO3 photo-electrode during UV irradiation at +0.5 V.93
 | ||
| Fig. 25 In situ Mn K-edge spectra of the MnOx (A) thin film and (B) particles on a Nb:SrTiO3 photoelectrode at +1.2 V vs. NHE under UV irradiation. Reproduced from ref. 92 with permission from the Royal Society of Chemistry. | ||
Besides Mn oxide thin films, Mn oxide particles on a Nb:SrTiO3 photo-anode were also studied at 1.2 V under UV illumination (Fig. 25B). The formation of a lower energy peak upon photo-irradiation indicated an increased amount of Mn2+. This suggests that part of the Mn3+ reduces to Mn2+, whereas the other part of the Mn oxide particles oxidizes to Mn4+ or remains as Mn3+. As Mn3+ and Mn4+ are believed to function as water oxidation catalysts, both active and inactive Mn oxide was present in the Mn oxide particles.
For the Mn oxide cocatalyst on a n-type Nb:SrTiO3 photo-electrode, the importance of band bending for the photo-excited hole migration into the catalyst was studied by Mn K-edge XANES experiments under UV irradiation at −0.5 V, 0.0 V and +0.5 V.93 The XANES structures obtained at both 0.0 V and +0.5 V showed an increase in edge energy, consistent with the oxidation of Mn3+ species to Mn4+ species. The oxidation state change for the catalyst at 0.0 V was less rapid than that observed for the sample at 0.5 V. The XANES structures at −0.5 V did not show a change in Mn oxidation state under UV irradiation, indicating that photo-excited holes were not transferred to the Mn oxide cocatalyst. The potential-dependence of Mn oxidation for potentials that can significantly alter the band bending, but not the water oxidation activity, suggests that the XAS Mn K-edge measurements report on hole injection driven by band bending in the n-type Nb:SrTiO3 photo-electrode.
4.4 Overview of in situ metal K-edge XAS
The in situ XAS studies demonstrate the value of in situ K-edge XAS in investigating changes in the oxidation state and local environment in WOC materials with applied potential or light. The results are reported in Table 3. For all the studied catalysts it was found that upon increasing the potential to an OER relevant potential, the metal oxidation state increased to a value higher than 3+. This suggests that an increased amount of 4+ species can be important for WOC with Co-, Ni- and Mn-based oxide catalysts. The increased metal oxidation state is a property of either the as-prepared catalyst or the catalyst under reactions, which can be differentiated by comparing in situ XAS results to ex situ XAS. In the Mn and Co based oxide catalysts, an oxidation state higher than that found in the ex situ studies was found. The most clear evidence for a higher oxidation state of the metal under reaction conditions is the increased Co oxidation state for the CoPi-Cats (>3+). The oxidation state of Mn in MnOx birnessite-like catalysts was found to increase under reaction conditions in two separate studies (one potential, one light driven) to 3.6+ from the nominal value of 3+ observed for the as-prepared catalyst under ex situ conditions. It is important to note that the comparison to as-prepared (3+) conditions for MnOx involves a study by a separate group and on a different substrate. The higher metal oxidation states found for the Co and Mn WOCs under reaction conditions suggest that a transition metal oxide radical with significant metal character is formed. In contrast, the oxidation state of the activated Ni-Bi-Cats under reaction conditions closely resembles that of the Ni-Bi in the ex situ state,70 suggesting that major changes are predominantly due to the electro-oxidative pretreatment of the prepared catalyst rather than due to reaction conditions. It is suggested that in Ni oxide catalysts, a radical with oxyl character is created. However, the lack of an oxidation state on the metal site could also be due a rapid pre-equilibrium of Ni 4+ with the solution, or due to the effects of impurities, such as Fe on Ni oxide catalysts.7 XAS studies of the O K-edge would be helpful in resolving this issue, and are discussed further below.The in situ XAS studies also demonstrate that a reductive potential partially reduces the metal oxidation state. As shown in Table 3, for potentials below the onset for WOC, the metal oxidation state is often lower than the value reported for ex situ experiments. This was especially clear for the NiBi-Cats, where an oxidation state of ∼2+ was found at potentials of 0.4 V or 0.2 V, significantly lower than the oxidation state observed for a similar catalyst in ex situ XAS experiments (>3+).70 Furthermore, Kanan (2010) found that when the CoPi system was switched from 1.25 V to OCP, residual water oxidation activity led to a reduction of Co. In the NiBi-Cats, the significant change in the metal oxidation state suggests that the reduction is occurring for bulk Ni centers. On the other hand, a reduction due to residual water oxidation activity in the CoPi system suggests that surface reactive metals are being reduced. The difference is indicative of a larger role of the metal within the transition metal oxide radical in the Co based catalysts compared to the Ni based catalysts.
As shown by Yoshida and co-workers (2013, 2014), the metal oxidation state can also increase as a result of photo-excited holes. They used XAS to study photo-excited hole transfer into a MnOx overlayer from a UV-irradiated Nb:SrTiO3 substrate. The fact the Mn oxidation state increased with applied voltage92,93 indicates that band bending at the MnOx/Nb:SrTiO3 acts as a driving force for photo-excited carrier separation and hole transfer to the catalyst. Studies such as this one by Yoshida suggest that light driven catalysis can be investigated on otherwise “dark” Mn, Co, and Ni catalysts.
EXAFS studies were used to study the structure of the catalyst under OER conditions, also reported in Table 3. In all cases, the structure observed is similar to that found for the as-prepared catalysts studied under ex situ conditions. Both Friebel (2013) and Kanan (2010) found a HxCoO2 structure consisting of edge-sharing CoO6 octahedra for the active CoPi-Cats, consistent with the findings by Risch (2009, 2012) in the ex situ XAS experiments.59,83,84 EXAFS studies on the NiCat by Bediako (2012) and Yoshida (2014) suggested a γ-NiOOH species as the active phase, thereby contradicting earlier findings that claimed a β-NiOOH phase to be a more efficient water oxidation catalyst.88,91 Gorlin and coworkers (2013) found that the active MnOx/Au-Si3N4 catalyst consisted of an oxidized birnessite-like phase, containing Mn3+ and Mn4+, and areas with more reduced MnII,III,III3O4.80
5 Other X-ray experiments on WOCs
In this section we describe soft X-ray absorption experiments based on the oxygen K-edge and the metal L-edges of WOCs. Furthermore soft and hard X-ray RIXS experiments will be described. We start with a description of dedicated in situ cells for experiments with soft X-rays.5.1 Development of in situ cells
In order to conduct soft X-ray and RIXS experiments under reaction conditions, novel cells had to be designed and developed. While they are reviewed more extensively elsewhere,94 we provide a brief overview here. From the perspective of the X-ray beam, the cell design is tailored to meet the requirements of a much larger soft X-ray cross section of materials and electrolyte compared to the hard X-ray cross-section (a penetration depth of 100–500 nm for the soft X-ray regime compared with 100s of microns for the hard X-ray regime). The cell also must accommodate a liquid environment near the electrode that is enclosed from the ultra high vacuum (UHV) chamber through which the X-ray beam passes. As opposed to hard X-ray chambers that are completely enclosed by hutches, the soft X-ray beam is on the main floor of the synchrotron and is instead shielded by UHV conditions. Given the large cross section of soft X-rays, along with the long collection times associated with RIXS, the cells are also designed to prevent X-ray induced damage. In particular, they accommodate a flow of the electrolyte to help maintain a similar surface during the course of experiments. These flow conditions also help maintain a similar surface from the perspective of the catalysis itself, which can lead to modifications over time if the electrolyte is not replenished. From the perspective of experimental controls, these flow conditions allow for pH and chemical composition of the electrolyte to be tuned during the course of data collection.The cell designs, developed largely at the Advanced Light Source at Lawrence Berkeley National Laboratory, are depicted in Fig. 26. Fig. 26(a) shows the essential feature of the cell that allows for it to be accommodated within UHV conditions: namely the transparent window through which the soft X-ray beam passes to the electrode is a 1 × 1 mm, 100 nm thick Si3N4 cell window. This cell window, along with an O-ring, effectively seals the liquid from the UHV environment, but is thin enough to be transparent in the soft X-ray regime. A cell containing this cell window can also incorporate the full 3 electrodes necessary for electrochemistry, and a diagram of such a cell is depicted in Fig. 26(b) with (i) denoting the cell window and (ii) the liquid reservoir. The liquid flow cell, depicted in Fig. 26(c), includes the same structure as Fig. 26(b), with the Si3N4 cell window (i), the O-ring (iii), and the 3 electrodes (iv, v, and vi), but with an arm that allows for an inlet and outlet of flow to refresh the reservoir. Besides the work at the Advanced Light Source, development and applications of in situ soft X-ray transmission liquid cells suitable for following electrochemical reactions were also reported by Kosugi et al.95,96 and Kondoh et al.97,98 While not the focus of this review, gas-phase studies of catalytic surfaces can yield valuable information and a gas flow-cell diagram is shown in Fig. 26(d). In the gas phase, certain experiments such as X-ray photoemission spectroscopy become possible and are more surface sensitive than X-ray absorption. On the other hand, gas-phase studies do not lend themselves to reaction conditions tuned by voltage.
 | ||
| Fig. 26 Cell designs for soft X-ray experiments: (a) static liquid cell, (b) static liquid cell with a 3-electrode setup, (c) a liquid flow cell with a 3-electrode setup, and (d) a gas flow cell. Reprinted with permission from ref. 94, copyright 2015 and ref. 102, copyright 2010 and ref. 103, copyright 2007. | ||
Finally, a range of nanoreactors have been designed especially for use with X-ray microscopes.99,100 These nanoreactors are used in transmission mode and use two 10–30 nm thin Si3N4 windows that hold a 10–100 micron thick gas volume up to pressures of 5 bar. De Smit et al. have used such nanoreactors to track simultaneously the metal L edges, the oxygen K edge of the support and the carbon K edge of the substrate and reactants.101 A similar, modified nanoreactor could also be used for the tracking of water oxidation catalysts under reaction conditions.
5.2 Soft X-ray investigations: O K-edge, M L-edge and RIXS
Although not as exhaustive a list as K-edge and L-edge XAS, various studies have applied oxygen K-edge XAS to explore the effect of the nature of the 3d valence states on catalytic activity. Sun and co-workers (2012) reported the use of O K-edge XAS to study the Ni–O covalence in a NiOx functionalized silicon WOC and found a more ionic Ni–O bonding.72 Yoshida et al. (2015) reported an in situ XAS study on the O K-edge of the Ni-Bi catalyst.98 By monitoring the oxygen species in the Ni-Bi thin film, the formation of NiO6 octahedral domains could be directly monitored. Different behaviour for upward and downward potential sweeps suggested that the water oxidation catalysis likely proceeds at the domain edge of the NiO6 octahedra. More recently, based on the results obtained from a combination of XAS and RIXS, Xiao et al. suggested that enhancement in water oxidation catalytic activity originated from a narrowing of the local HOMO–LUMO gap when potential and visible light illumination were simultaneously applied to a dinuclear Mn3+ system.104 RIXS experiments were also performed by Khan and coworkers (2014) on MnOx nanoparticles loaded into Nafion, indicating that the MnOx catalyst with the lowest d–d transitions and the strongest charge transfer showed the highest catalytic activity.81 Bokarev et al. studied the difference in the behaviour of the different oxidation states of manganese regarding the photo-electrooxidation of water.1055.3 Hard X-ray RIXS
Friebel et al. combined 1s XAS with 1s2p (Kα) RIXS in order to identify the active state of a Co electrocatalyst during the oxygen evolution reaction.84 They showed the 1s2p RIXS planes of cobalt oxides, where CoO has multiple pre-edge quadrupole-based peaks due to the coupled 1s3d excitation and 1s2p decay, as calculated by Kurian et al.43 The 1s2p RIXS plane of trivalent oxides looks quite different and is dominated by the non-local dipole peak due to 1s4p dipole transitions into the 3d-band.106 Using these references, a gold-supported cobalt oxide was tracked during oxygen formation.84 Glatzel and co-workers highlighted the advantage of RIXS analysis on the Mn K pre-edge feature for a series of Mn model complexes to access detailed spin features.1076 Conclusions
As the search for a viable water oxidation catalyst for incorporation into a large scale solar fuel device progresses, the fundamental understanding of the structure–activity relationship needs to be explored and XAS is a strong characterization tool that provides valuable insight. Thus far, some of the most catalytically active WOCs – namely Co, Ni, and Mn oxides – have shown similar, as-prepared electronic structures with an average metal oxidation state of 3+, octahedral coordination, and a M–O distance of ∼1.9 Å. The M–M distance of ∼2.8 Å suggests the importance of di-μ oxo bridging between neighboring metal sites, which bears similarity to the Mn–oxide complex of photosystem II. For the Mn and Co oxide catalysts, the metal oxidation state increases (>3+) under reaction conditions, suggesting that the transition metal oxide radical has significant metal character. In contrast, the metal oxidation state of Ni oxide catalysts is not observed to change under reaction conditions. In all cases studied thus far, the coordination environment of the catalyst does not change under reaction conditions, at the level of XAS and EXAFS sensitivity to the structure. In general, EXAFS finds that M–M distances beyond nearest neighbor are significantly suppressed in the more active WOCs, which suggests that disorder is correlated with activity. Further correlations with activity were explored using the well-defined, homogeneous structures of the Co-POMs. However, XAS and EXAFS could not differentiate catalysts with similar overall electronic structures, but with significant differences in activity. The X-ray studies of heterogeneous and homogeneous WOCs would significantly benefit from X-ray techniques that are more sensitive to the electronic structure, in order to determine to what extent the metal and oxygen are involved in the transition metal oxide radical and to differentiate details in the ground state electronic structure that could be markers of activity. Therefore, two further directions are proposed: (1) soft X-ray O K-edge XAS studies of as-prepared catalysts and under reaction conditions and (2) RIXS studies of the ground state electronic structure, focused on d–d transitions and charge transfer between metal and oxygen sites.References
- F. Osterloh and B. Parkinson, MRS Bull., 2011, 36, 17–22 CrossRef CAS.
- A. Ismail and D. Bahnemann, Sol. Energy Mater. Sol. Cells, 2014, 128, 85–101 CrossRef CAS.
- R. Eisenberg and H. Gray, Inorg. Chem., 2008, 47, 1697–1699 CrossRef CAS PubMed.
- G. Ketteler, S. Yamamoto, H. Bluhm, K. Andersson, D. Starr, D. Ogletree, H. Ogasawara, A. Nilsson and M. Salmeron, J. Phys. Chem. C, 2007, 111, 8278–8282 CAS.
- M. Zhang and H. Frei, Catal. Lett., 2015, 145, 420 CrossRef CAS.
- J. Guo, P. Glans, Y. Liu and C. Chang, On Solar Hydrogen and Technology, Electronic Structure Study of Nanostructured Transition Metal Oxides Using Soft X-Ray Spectroscopy, John Wiley and Sons, Asia, 1st edn, 2009 Search PubMed.
- M. S. Burke, L. J. Enman, A. S. Batchellor, S. Zou and S. W. Boettcher, Chem. Mater., 2015, 27, 7549–7558 CrossRef CAS.
- M. Zhang, M. de Respinis and H. Frei, Nat. Chem., 2014, 6, 362–367 CrossRef CAS PubMed.
- F. L. Formal, E. Pastor, S. Tilley, C. Mesa, S. Pendlebury, M. Grätzel and J. Durrant, J. Am. Chem. Soc., 2015, 137, 6629–6637 CrossRef PubMed.
- O. Zandi and T. W. Hamann, Phys. Chem. Chem. Phys., 2015, 17, 22485–22503 RSC.
- J. Guo, Int. J. Quantum Chem., 2009, 109, 2714–2721 CrossRef CAS.
- R. Hocking, R. Brimblecombe, L. Chang, A. Singh, M. Cheah, C. Glover, W. Casey and L. Spiccia, Nat. Chem., 2011, 3, 461–466 CAS.
- E. Miller and R. Rocheleau, J. Electrochem. Soc., 1997, 144, 1995–2003 CrossRef CAS.
- V. Artero, M. Chavarot-Kerlidou and M. Fontecave, Angew. Chem., Int. Ed., 2011, 50, 7238–7266 CrossRef CAS PubMed.
- E. Fabbri, A. Habereder, K. Waltar, R. Kötz and T. Schmidt, Catal. Sci. Technol., 2014, 4, 3800–3821 CAS.
- S. Lee, D. González-Flores, J. Ohms, T. Trost, H. Dau, I. Zaharieva and P. Kurz, ChemSusChem, 2014, 7, 3442–3451 CrossRef CAS PubMed.
- P. Rasiyah and A. Tseung, J. Electrochem. Soc., 1984, 131, 803 CrossRef CAS.
- S. Trasatti, J. Electroanal. Chem., 1980, 111, 125 CrossRef CAS.
- Y. Surendranath, M. Kanan and D. Nocera, J. Am. Chem. Soc., 2010, 132, 16501 CrossRef CAS PubMed.
- D. Bediako, Y. Surendranath and D. Nocera, J. Am. Chem. Soc., 2013, 135, 3662 CrossRef CAS PubMed.
- D. Bediako, C. Costentin, E. Jones, D. Nocera and J. Savéant, J. Am. Chem. Soc., 2013, 135, 3662 CrossRef CAS PubMed.
- M. Huynh, D. Bediako and D. Nocera, J. Am. Chem. Soc., 2014, 136, 6002 CrossRef CAS PubMed.
- D. Herlihy, M. Waegele, X. Chen, C. Pemmaraju, D. Prendergast and T. Ćuk, Nat. Chem., 2016, 8, 549–555 CrossRef CAS PubMed.
- O. Zandi and T. Hamann, Nat. Chem., 2016, 8, 778–783 CrossRef CAS PubMed.
- D. Moonshiram, I. Alperovich, J. Concepcion, T. Meyer and Y. Pushkar, Proc. Natl. Acad. Sci. U. S. A., 2013, 110, 3765–3770 CrossRef CAS PubMed.
- G. Bunker, Introduction to XAFS: A Practical Guide to X-ray Absorption Fine Structure, Cambridge University Press, 2010 Search PubMed.
- J. Stohr, NEXAFS Spectroscopy, Springer, 1992 Search PubMed.
- J. Rehr and R. Albers, Rev. Mod. Phys., 2000, 72, 621–654 CrossRef CAS.
- F. de Groot and A. Kotani, Core Level Spectroscopy of Solids, CRC Press, 1st edn, 2008 Search PubMed.
- A. Kudo and Y. Miseki, Chem. Soc. Rev., 2009, 38, 253–278 RSC.
- F. Osterloh, Chem. Soc. Rev., 2013, 42, 2294–2320 RSC.
- H. Ahmad, S. Kamarudin, L. Minggu and M. Kassim, Renewable Sustainable Energy Rev., 2015, 43, 599–610 CrossRef CAS.
- X. Deng and H. Tuysuz, ACS Catal., 2014, 4, 3701–3714 CrossRef CAS.
- D. Joseph, S. Basu, S. Jha and D. Bhattacharyya, Nucl. Instrum. Methods Phys. Res., Sect. B, 2012, 274, 126–128 CrossRef CAS.
- J. Wong, F. Lytle, R. Messmer and D. Maylotte, Phys. Rev. B: Condens. Matter Mater. Phys., 1984, 30, 5596–5610 CrossRef CAS.
- G. Henderson, F. de Groot and B. Moulton, Rev. Mineral. Geochem., 2014, 78, 75–138 CrossRef CAS.
- T. Westre, P. Kennepohl, J. De Witt, B. Hedman, K. Hodgson and E. Solomon, J. Am. Chem. Soc., 1997, 119, 6297–6314 CrossRef CAS.
- F. de Groot, G. Vanko and P. Glatzel, J. Phys.: Condens. Matter, 2009, 21, 104207 CrossRef PubMed.
- D. Koningsberger, B. Mojet, G. van Dorssen and D. Ramaker, Top. Catal., 2000, 10, 143–155 CrossRef CAS.
- M. Newville, Fundamentals of XAFS, 1st edn, 2004, Published online: http://xafs.org/Tutorials Search PubMed.
- J. Cook Jr. and D. Sayers, J. Appl. Phys., 1981, 52, 5024–5031 CrossRef.
- L. Ament, M. van Veenendaal, T. Devereaux, J. Hill and J. van den Brink, Rev. Mod. Phys., 2011, 83, 705–767 CrossRef CAS.
- R. Kurian, M. van Schooneveld, N. Zoltan, G. Vankó and F. de Groot, J. Phys. Chem. C, 2013, 117, 2972–2981 Search PubMed.
- A. Juhin, F. de Groot, G. Vankó, M. Calandra and C. Brouder, Phys. Rev. B: Condens. Matter Mater. Phys., 2010, 81, 115115 CrossRef.
- A. Singh, S. Chang, R. Hocking, U. Bach and L. Spiccia, Energy Environ. Sci., 2013, 6, 579–586 CAS.
- C. Ohlin, S. Harley, J. McAlpin, R. Hocking, B. Mercado, R. Johnson, E. Villa, M. Fidler, M. Olmstead, L. Spiccia, R. Britt and W. Casey, Chem. – Eur. J., 2011, 17, 4408–4417 CrossRef CAS PubMed.
- D. M. Robinson, Y. B. Go, M. Mui, G. Gardner, Z. J. Zhang, D. Mastrogiovanni, E. Garfunkel, J. Li, M. Greenblatt and G. C. Dismukes, J. Am. Chem. Soc., 2013, 135, 3494–3501 CrossRef CAS PubMed.
- I. Zaharieva, P. Chernev, M. Risch, K. Klingan, M. Kohlhoff, A. Fischer and H. Dau, Energy Environ. Sci., 2012, 5, 7081–7089 CAS.
- B. Thole and G. van der Laan, Phys. Rev. B: Condens. Matter Mater. Phys., 1988, 38, 3158–3171 CrossRef CAS.
- F. Morales, F. de Groot, P. Glatzel, E. Kleimenov, H. Bluhm, M. Havecker, A. Knop-Gericke and B. Weckhuysen, J. Phys. Chem. B, 2004, 108, 16201–16207 CrossRef CAS.
- M. Delgado-Jaime and P. Kennepohl, J. Synchrotron Radiat., 2010, 17, 119–128 CAS.
- J. Suntivich, W. Hong, Y. Lee, J. Rondinelli, W. Yang, J. Goodenough, B. Dabrowski, J. Freeland and Y. Shao-Horn, J. Phys. Chem., 2014, 118, 1856–1863 CAS.
- J. Suntivich, H. Gasteiger, N. Yabuuchi, H. Nakanishi, J. Goodenough and Y. Shao-Horn, Nat. Chem., 2011, 3, 546–550 CrossRef CAS PubMed.
- J. Suntivich, K. May, H. Gasteiger, J. Goodenough and Y. Shao-Horn, Science, 2011, 334, 1383–1385 CrossRef CAS PubMed.
- F. de Groot, M. Grioni, J. Fuggle, J. Ghijsen, G. Sawatzky and H. Petersen, Phys. Rev. B: Condens. Matter Mater. Phys., 1989, 40, 5715–5723 CrossRef CAS.
- E. Solomon, B. Hedman, K. Hodgson, A. Dey and R. Szilagyi, Coord. Chem. Rev., 2005, 249, 97–129 CrossRef CAS.
- M. Kanan and D. Nocera, Science, 2008, 321, 1072–1075 CrossRef CAS PubMed.
- M. Risch, V. Khare, I. Zaharieva, L. Gerencser, P. Chernev and H. Dau, J. Am. Chem. Soc., 2009, 131, 6936–6937 CrossRef CAS PubMed.
- M. Risch, K. Klingan, F. Ringleb, P. Chernev, I. Zaharieva, A. Fischer and A. Dau, ChemSusChem, 2012, 5, 542–549 CrossRef CAS PubMed.
- Y. Surendranath, M. Dinça and D. Nocera, J. Am. Chem. Soc., 2009, 131, 2615–2620 CrossRef CAS PubMed.
- H. Dau, P. Liebisch and M. Haumann, Anal. Bioanal. Chem., 2003, 376, 562–583 CrossRef CAS PubMed.
- T. Yamamoto, X-Ray Spectrom., 2008, 37, 572–584 CrossRef CAS.
- A. Sartorel, M. Carraro, G. Scorrano, R. De Zorzi, S. Geremia, N. McDaniel, S. Bernhard and M. Bonchio, J. Am. Chem. Soc., 2008, 15, 5006–5007 CrossRef PubMed.
- Q. Yin, J. Tan, C. Besson, Y. Geletii, D. Musaev, A. Kuznetsov, Z. Luo, K. Hardcastle and C. Hill, Science, 2010, 328, 342–345 CrossRef CAS PubMed.
- R. Schiwon, K. Klingan, H. Dau and C. Limberg, Chem. Commun., 2014, 50, 100–102 RSC.
- A. Hibberd, H. Doan, E. Glass, F. de Groot, C. Hill and T. Ćuk, J. Phys. Chem. C, 2015, 119, 4173–4179 CAS.
- H. Lv, J. Song, Y. Geletii, J. Vickers, J. Sumliner, D. Musaev, P. Kögerler, P. Zhuk, J. Bacsa, G. Zhu and C. Hill, J. Am. Chem. Soc., 2014, 136, 9268–9271 CrossRef CAS PubMed.
- J. Stracke and R. Finke, J. Am. Chem. Soc., 2011, 133, 14872–14875 CrossRef CAS PubMed.
- M. Dinça, Y. Surendranath and D. Nocera, Proc. Natl. Acad. Sci. U. S. A., 2010, 107, 10337–10341 CrossRef PubMed.
- M. Risch, K. Klingan, J. Heidkamp, D. Ehrenberg, P. Chernev and I. Zaharieva, Chem. Commun., 2011, 47, 11912–11914 RSC.
- H. Dau and M. Haumann, Coord. Chem. Rev., 2008, 252, 273–295 CrossRef CAS.
- K. Sun, N. Park, Z. Sun, J. Zhou, J. Wang, X. Pang, S. Shen, S. Noh, Y. Jing, S. Jin, P. Yu and D. Wang, Energy Environ. Sci., 2012, 5, 7872–7877 CAS.
- K. Yachandra, K. Sauer and M. Klein, Chem. Rev., 1996, 96, 2927–2950 CrossRef PubMed.
- M. Morita, C. Iwakura and H. Tamura, Electrochim. Acta, 1977, 22, 325–328 CrossRef CAS.
- M. Morita, C. Iwakura and H. Tamura, Electrochim. Acta, 1978, 4, 331–335 CrossRef.
- T. Takashima, K. Hashimoto and R. Nakamura, J. Am. Chem. Soc., 2012, 134, 1519–1527 CrossRef CAS PubMed.
- C. Kuo, I. Mosa, A. Poyraz, S. Biswas, A. El-Sawy, W. Song, Z. Luo, S. Chen, J. Rusling, J. He and J. Suih, ACS Catal, 2015, 5, 1693–1699 CrossRef CAS.
- F. Jiao and H. Frei, Chem. Commun., 2010, 46, 2920–2922 RSC.
- S. Webb, B. Tebo and J. Bargar, Am. Mineral., 2005, 90, 1342–1357 CrossRef CAS.
- Y. Gorlin, B. Lassalle-Kaiser, J. Benck, S. Gul, S. Webb, V. Yachandra, J. Yano and T. Jaramillo, J. Am. Chem. Soc., 2013, 135, 8525–8534 CrossRef CAS PubMed.
- M. Khan, E. Suljoti, A. Singh, S. Bonke, T. Brandenburg, K. Atak, R. Golnak, L. Spiccia and E. Aziz, J. Mater. Chem. A, 2014, 2, 18199–18203 CAS.
- J. Park, H. Kim, K. Jin, B. Lee, Y.-S. Park, H. Kim, I. Park, K. Yang, H.-Y. Jeong, J. Kim, K. Hong, H. Jang, K. Kang and K. Nam, J. Am. Chem. Soc., 2014, 136, 4201–4211 CrossRef CAS PubMed.
- M. Kanan, J. Yano, Y. Surendranath, M. Dina, V. Yachandra and D. Nocera, J. Am. Chem. Soc., 2010, 132, 13692–13701 CrossRef CAS PubMed.
- D. Friebel, M. Bajdich, B. Yeo, M. Louie, D. Miller, H. Casalongue, F. Mbuga, T. Weng, D. Nordlund, D. Sokaras, R. Alonso-Mori, A. T. Bell and A. Nilsson, Phys. Chem. Chem. Phys., 2013, 15, 17460–17467 RSC.
- A. Bergmann, E. Martinez-Moreno, D. Teschner, P. Chernev, M. Gliech, J. Ferreira de Araújo, T. Reier, H. Dau and P. Strasser, Nat. Commun., 2015, 6, 8625 CrossRef CAS PubMed.
- H.-Y. Wang, S.-F. Hung, H.-Y. Chen, T.-S. Chan, H. Chen and B. Liu, J. Am. Chem. Soc., 2016, 138, 36–39 CrossRef CAS PubMed.
- B. Seo, Y. Sa, J. Woo, K. Kwon, J. Park, T. Shin, H. Jeong and S. Joo, ACS Catal., 2016, 6, 4347–4355 CrossRef CAS.
- D. Bediako, B. Lassalle-Kaiser, Y. Surendranath, J. Yano, V. Yachandra and D. Nocera, J. Am. Chem. Soc., 2012, 134, 6801–6809 CrossRef CAS PubMed.
- P. Lu and S. Srinivasan, J. Electrochem. Soc., 1978, 125, 1416–1422 CrossRef CAS.
- M. Lyons and M. Brandon, Int. J. Electrochem. Sci., 2008, 3, 1386–1424 CAS.
- M. Yoshida, T. Iida, T. Mineo, T. Yomogida, K. Nitta, K. Kato, H. Nitani, H. Abe, T. Uruga and H. Kondoh, Electrochemistry, 2014, 82, 355–358 CrossRef CAS.
- M. Yoshida, T. Yomogida, T. Mineo, K. Nitta, K. Kato, T. Masuda, H. Nitani, H. Abe, S. Takakusagi, T. Uruga, K. Asakura, K. Uosaki and H. Kondoh, Chem. Commun., 2013, 49, 7848–7850 RSC.
- M. Yoshida, T. Yomogida, T. Mineo, K. Nitta, K. Kato, T. Masuda, H. Nitani, H. Abe, S. Takakusagi, T. Uruga, K. Asakura, K. Uosaki and H. Kondoh, J. Phys. Chem., 2014, 118, 24302–24309 CAS.
- Y. Liu, P. Glans, C. Chuang, M. Kapilashrami and J. Guo, J. Electron Spectrosc. Relat. Phenom., 2015, 200, 282–292 CrossRef CAS.
- M. Nagasaka, T. Hatsui, T. Horigome, Y. Hamamura and N. Kosugi, J. Electron. Spectrosc. Relat. Phenom., 2010, 177, 130–134 CrossRef CAS.
- M. Nagasaka, H. Yuzawa and N. Kosugi, J. Electron. Spectrosc. Relat. Phenom., 2015, 200, 293–310 CrossRef CAS.
- R. Toyoshima and H. Kondoh, J. Phys.: Condens. Matter, 2015, 27, 083003 CrossRef PubMed.
- M. Yoshida, Y. Mitsutomi, T. Mineo, M. Nagasaka, H. Yuzawa, N. Kosugi and H. Kondoh, J. Phys. Chem. C, 2015, 119, 19279–19286 CAS.
- F. de Groot, E. de Smit, M. van Schooneveld, L. Aramburo and B. Weckhuysen, ChemPhysChem, 2010, 11, 951 CrossRef CAS PubMed.
- S. Kelly, P. Nigge, S. Prakash, A. Laskin and B. Wang, Rev. Sci. Instrum., 2013, 84, 073708 CrossRef PubMed.
- E. de Smit, I. Swart, J. Creemer, G. Hoveling, M. Gilles, T. Tyliszczak, P. Kooyman, H. Zandbergen, C. Morin, B. Weckhuysen and F. de Groot, Nature, 2008, 456, 222 CrossRef CAS PubMed.
- P. Jiang, J.-L. Chen, F. Borondics, P.-A. Glans, M. West, C.-L. Chang, M. Salmeron and J. Guo, Electrochem. Commun., 2010, 12, 820–822 CrossRef CAS.
- J. Guo, T. Tong, L. Svec, J. Go, C. Dong and J.-W. Chiou, J. Vac. Sci. Technol., A, 2007, 25, 1231 CAS.
- J. Xiao, M. Khan, A. Singh, E. Suljoti, L. Spiccia and E. Aziz, ChemSusChem, 2015, 8, 872–877 CrossRef CAS PubMed.
- S. Bokarev, M. Khan, M. Abdel-Latif, J. Xiao, R. Hilal, S. Aziz, E. Aziz and O. Kühn, J. Phys. Chem. C, 2015, 119, 19192–19200 CAS.
- G. Vankó, F. de Groot, S. Huotari, R. Cava, T. Lorenz and M. Reuther, 2008, arXiv:0802.2744.
- P. Glatzel and U. Bergmann, Coord. Chem. Rev., 2005, 249, 65–95 CrossRef CAS.
| This journal is © The Royal Society of Chemistry 2017 |