A data-driven strategy for predicting greenness scores, rationally comparing synthetic routes and benchmarking PMI outcomes for the synthesis of molecules in the pharmaceutical industry†
Jun
Li
,
Eric M.
Simmons
and
Martin D.
Eastgate
*
Chemical and Synthetic Development, Bristol-Myers Squibb, 1 Squibb Drive, New Brunswick, NJ 08903, USA. E-mail: martin.eastgate@bms.com
First published on 25th October 2016
Abstract
Cumulative Process Mass Intensity (PMI) is one of the most popular greenness metrics tracked during the lifecycle of a pharmaceutical compound. Its use is wide-spread, having come to represent the foundation of many assessments of efficiency. These metrics are critical during the development of a compound as analysis of efficiency data (such as PMI outcomes) can help minimize the environmental impact of pharmaceutical manufacturing, highlight areas for potential improvement and thus drive sustainability. However, there are several issues with many of the current metrics, one of the most pressing being the absence of such information when key synthetic strategy decisions are made in early development; many metrics articulate the impact of strategy decisions made in the absence of efficiency data. In this article, we develop a predictive analytics framework, coupled to Monte Carlo simulation, to address this issue and enable a rich understanding of potential PMI outcomes during both the decision making process (prediction) and the outcome review process (comparison). This method leverages real-world data to predict probable PMI ranges for a potential synthesis being considered, utilizing accumulated data which spans a range of molecules and phases of development. The approach can serve two critical functions lacking in current methods: (1) it can act as a decision-aiding tool during the route discovery process, predicting probable PMI outcomes for proposed, potential or unoptimized synthetic routes; (2) it can enable the direct comparison of the PMI outcome of a synthesis to all comparable chemistry, thus providing a benchmarking methodology capable of comparing PMIs across molecules. We envision that this approach will deliver significant impact to the green chemistry community by enabling greener decisions to be made at critical phases of invention, namely the ideation, route selection and development processes (designing green), along with providing a rational method to compare a specific outcome to prior art (benchmarking).
Introduction
For the last 20 years, ‘Green Chemistry’ has been an important area of focus in both the pharmaceutical industry and academia. The development of the ‘12 Principles of Green Chemistry’ catalysed the development of greener synthetic methods,1a the development of metrics to understand and quantify ‘greenness’,1b and the collation of guides – such as the solvent selection guide1g – all of which facilitate the development of greener processes. Concepts such as E-factor,2 Process Mass intensity (or PMI),3 and Green Aspiration level (or GAL),4 have enabled researchers to quantify the impact of their chemistry using a harmonized approach. PMI was developed, and quickly adopted, by the pharmaceutical industry3a largely due to its simplicity; it is now widely used, resulting significant quantities of PMI information residing in both company data repositories and the open scientific literature. This information, if properly aggregated, effectively summates the efficiency of a range of chemical reactions in a wide range of settings.While these metrics have driven significant change, there are several areas still lacking with respect to our ability to understand the impact of the chemical community on the environment. These items negatively impact our ability to maximize the application of ‘green by design’ principles and can be separated into three main problem statements:
(1) The application of ‘green thinking’ comes too late in the design phase. In inventing a new route to a complex molecule, chemists tend to develop several potential synthetic strategies, make decisions about which concepts to test in the laboratory and experiment against only a few selected options, eventually gaining a proof of concept (POC) for their approach. This is an exploration phase, and occurs at a stage when only a ‘guestimate’ of the potential outcome is known to the innovator. However, important selections are being made during this process (which ideas are on paper, which are selected for testing and which are resourced to POC), decisions that dominate the resulting efficiency of the synthesis. Thus, during the ideation phase, important ideas and approaches are set aside in favour of others that appeal to the innovator's bias. Inherent in this process is the fact that several important decisions, all with the potential to significantly impact the PMI outcome of the final route, have already been made, even before a scientist enters the lab; in some respects the die is cast on the probable PMI outcome before the first experiment is performed. These decisions and selections are based only on experience or intuition. It is after a POC is achieved that many chemists start optimizing and focusing on improving the efficiency of the transformations discovered and start considering the application of green principles (reagent and solvent selection, optimizing process design, etc.). However, the optimization of a synthesis can only take a given strategy so far in terms of its efficiency – in many ways, optimization can be considered as a period of marginal gain, not disruptive change. If the selected route has a sub-optimal strategy, the maximum efficiency (or greenness) for the molecule will never be obtained. Thus, the ‘paper chemistry’ (ideation) and route scouting (selection) phases, are critical and generally outside of the scope of most green assessment methodologies. This notion is supported by the precedence that all of the green chemistry award-winning approaches were realized by judicious route selection.5
(2) The metrics at hand cannot compare between molecules. Metrics such as E-factor or PMI are appropriate (as long as used holistically, vide infra) for comparing different approaches to the same molecule; however, one cannot compare the PMI's of two different structures in any meaningful way to determine the relative efficiency of the synthesis, within a broader context. This is driven by current metrics not accounting for the structural complexity of the molecule, and, at an even more basic level, ignoring the molecular weight of the compound. Chemistry at its core is based on moles, not kilos. The impact of this can be significant in certain settings, the PMI for a transformation that affords a product with higher molecular weight will appear more efficient than the identical reaction conditions conducted on a molecule with lower molecular weight. The combination of these factors translates into a lack of understanding of how molecular complexity (and size) impacts efficiency. As pharmaceutical compounds have become more complex, a rational method to compare greenness metrics is critical.3d We have no methodology that can use PMI to compare how efficient a synthesis is with respect to other peer compounds.
(3) Concepts of greenness can be wrongly interpreted and significantly under reported. A known liability of PMI is that it does not take into account the impact of what is above and below the reaction arrow3 – meaning impacts such as metal mining, ligand synthesis6 and complex reagent synthesis are not included in the PMI assessment. There is also a known lack of alignment on what constitutes a starting material with respect to PMI.4 The external supply-chain of self-defined starting materials has been reported to dominate the life-cycle of a synthesis,3a hence reporting PMI from a self-selected late-stage intermediate seems inconsistent with a full and transparent understanding of efficiency. If a component of tracking metrics is to change culture and influence decision making, our metrics needs to be significantly more inclusive so that the full impact of decisions made during development are known to innovators. The fact that PMI does not include reagent or reactant synthesis effectively sweeps the environmental impact of key decisions under the rug. As an example, the focus on catalysis as a universal approach to green chemistry can be a route cause of inefficient, non-green processes, when looked at from a global perspective. If the efficiency of a synthesis is judged solely on PMI, as currently defined, the use of a complex ligand in a catalytic transformation (a ligand which may take 10 or more steps to prepare), would be rational vs. a one or two step longer linear sequence, as the environmental cost of the ligand is not included in the assessment of efficiency. In reality the longer linear route may be more efficient in a holistic sense. Strategic selections such as this may be rational based on current metrics, but maybe viewed as irrational if looked at more globally. Thus, reaction types considered to be inherently green may be, but only when the full potential impact of that selection is contrasted to other potential disconnections.6 In the design phase of a new synthesis, a reliance on principles, based on non-inclusive metrics that lack transparency, can lead to poor decision making and a culture inconsistent with the desired outcome of global efficiency.
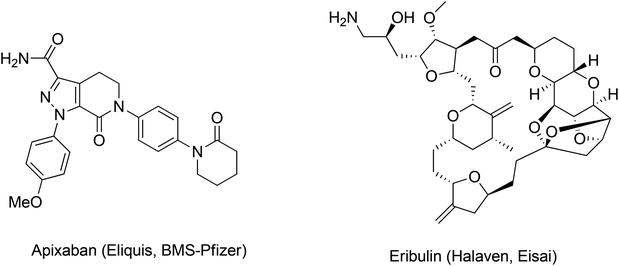
We hoped to develop a frame-work to address these important questions by refining our approach to greenness and efficiency. Our first goal was to leverage prior art to develop a predictive method that could provide information and context at the time of key decisions, revealing the probable outcomes of the myriad of options faced by innovators. In many ways, the challenges outlined above can be summed up in one question: How can we enable ourselves to accurately compare the greenness metrics for the syntheses of Eliquis to those of Halaven? (Fig. 1).
Concept
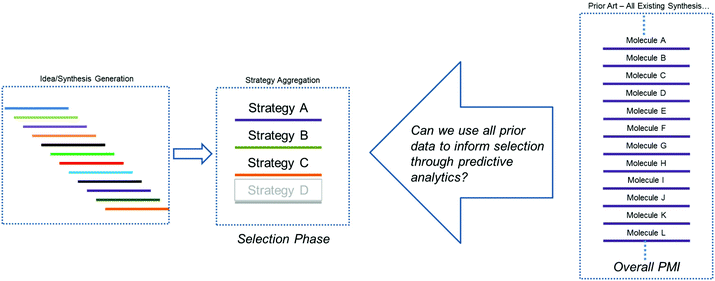
As outlined above, our hypothesis focused on the need to understand greenness via the quantitation of probable outcomes during both the design phase (route conceptualization or ideation) and the route scouting (selection) phase of route invention, in order to maximize the efficiency of the final route produced. Several previous methods have been explored for comparing synthetic approaches to molecules, beyond simple step-count comparisons. One such approach is Baran's ideality score,7 which can be used as a quantitative measure of tactical efficiency by differentiating the number of productive steps from the total number of steps, and could be used during the design phase. However, while is important as a method for understanding operational efficiency, ideality does not necessarily correlate to key greenness metrics such as process mass intensity (PMI).A recent survey of industry showed that the PMI metric has been used by more than two-thirds of all chemical companies and in most major pharmaceutical companies.1c Within Bristol-Myers Squibb, we have developed an online database to calculate and store a range of process greenness metrics, including PMI, for synthetic campaigns from across our portfolio. We recognized that this constituted a wealth of underutilized process greenness data, and this information exists both internally and more broadly across the pharmaceutical industry. Thus, we sought to determine if this large data set could be used to help guide decision making during the critical phases of ideation and route scouting. As we face developing an approach to a new molecule, a period of ideation generates a range of synthetic ideas which are aggregated into common strategies. Improvements in our ability to predict the probable outcome of each route/strategy would greatly aid the selection process and hopefully improve outcomes with respect to process greenness. Additionally, we hoped that any method we developed would provide an improved approach to comparing molecules and provide a refined strategy for benchmarking. More specifically, we posed the question, could we leverage the sum of all prior art to inform selections during the development of new chemistry (Fig. 2)?
In prior work, we developed a mathematical method for calculating the complexity of organic molecules, developing the theory of current complexity.8 In that study we evaluated the responses of a population of organic chemists to a training set of molecules, to define the parameters important to the organic chemist's perception of complexity. Key to this analysis was the prudent segmentation of the data, resulting in a model which could predict the population's response to any new system; from this method we then developed an index for a molecule's current complexity. We realized that a similar data segmentation approach could be applied to our internal database of PMI information, which we hoped would enable us to develop a model suitable to address the three aims outlined above.
In this article we detail this approach and propose that this data-driven strategy, coupled with predictive analytics, provides a new direction to understand probable PMI (or greenness) outcomes and acts as a method to compare an actual optimized synthesis against all other similar processes – enabling comparison between molecules and the benchmarking of a synthesis within a broad context. We envision that the adoption of a data analytics approach to rank the greenness of proposed or unoptimized synthetic routes, at an early phase of decision making, could change our lens for decision making and fundamentally change our ability to be green in process development organizations.
Methodology
In order to develop a method which could both predict the outcome of a potential route, as well as compare actual routes, we needed to ensure that the method was built from extensive real-world data and contained factors independent of the unknowns that would exist at the start of a project. We hypothesized that we could pool the rich data available from a broad range of molecules to address this issue; i.e., could an understanding of the PMI for all amide bond forming reactions, across all molecules, be used to inform the probable PMI outcome of any new amide bond forming reaction?Thus, we developed an approach using historical scale-up data from our internal database, supplemented with similar industrial examples from the literature. We then segmented this data by reaction type with the premise that each reaction type may exhibit a characteristic distribution of PMI, reflective of the operational complexity of the transformation. In the initial phase of this process, we elected to use all available information in our database, data which span all phases of development (early, middle and late, though biased toward early/mid development) where the degree of optimization of the synthetic procedures (and hence their efficiency) varies widely. We anticipated that this approach would allow us to extract statistics for step PMI on scale, for any of the reaction types, while taking into account the general descending PMI trend observed from preclinical investigational new drug, through to the commercial stages of manufacturing. An additional benefit of this ‘all data’ approach is one of diversity – a broad range of molecules are included in the database, thus the predicted outcome will naturally account for variations in molecular size and complexity; our hope was that this would help account for the impact of molecular size and complexity on PMI.
At the outset, we were confronted by the lack of a straightforward mathematical formula correlating step PMI to the cumulative PMI of the final drug compound (or API, active pharmaceutical ingredient). While cumulative PMI and step PMI can be readily calculated using the PMI calculation tool developed by ACS green chemistry pharmaceutical roundtable,3d–f there is no equation describing cumulative PMI as the dependent variable of step PMI, cumulative PMI = f (step PMI). To utilize the knowledge and scale-up experiences extracted from the database, we needed to derive this relationship.
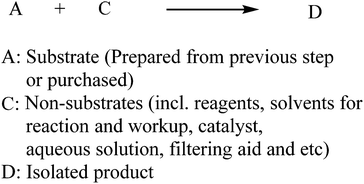
Since PMI is described as the total mass of the input materials (in kg) used to prepare a kilogram of the product, we can simplify the general chemical transformation to only consider the input materials and isolated product without including by-products. In a simple linear synthesis shown in Scheme 1, the input materials can be classified into substrate and non-substrate categories, where A is a substrate that is either purchased or prepared from the previous step, and C encompasses all of the other reaction components such as reagents, catalysts, organic solvents for reaction/workup/crystallization, aqueous solutions, filtering aids, etc.
The relationship between cumulative and step PMI at step i in above linear synthesis can be derived as eqn (1) (for details see ESI†). This provided us the foundation to determine the cumulative PMI based on step PMI and step molar yield. It should be noted that the same treatment of mass ratio to a so-called reference factor has also been recently reported.9 With availability of eqn (1), the sequence of the cumulative PMI at each step can be generated in a recursive fashion by starting from step i and walking backwards through the synthetic sequence, step-by-step, using the inputs of each step PMI and step molar yield until arrival at the beginning of the synthesis.
 | (1) |
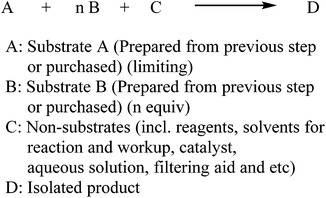
This approach was expanded into a convergent synthesis where substrate A can be joined by substrate B prepared from another synthetic sequence (Scheme 2). The relationship of cumulative PMI at step i can be derived in the same manner, as in eqn (2). Essentially, the cumulative PMI at joining step i can be envisioned as the contributions from substrate A in the main sequence (cumulative PMI at step i − 1), substrate B in the side-chain sequence (cumulative PMI assuming j steps), and the joining step PMI at i step.
 | (2) |
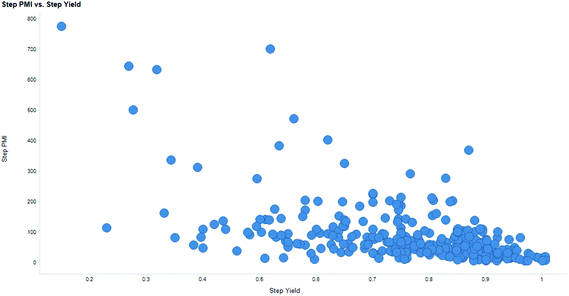
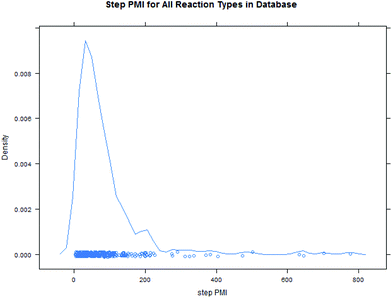
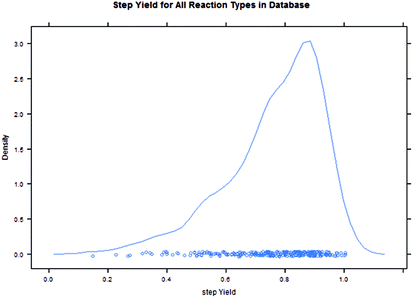
Intuitively, step yield and step PMI are negatively correlated. Typically, the higher the isolated step yield, the lower the step PMI. Specifically, in our database, an inverse relationship with negative correlation of −53% was observed for all transformations across all phases of development (Fig. 3). The true relationship between step PMI and step molar yield is discussed in the supplemental material. The corresponding density plots of step PMI and step yield for all BMS campaigns included are shown in the Fig. 4 and 5, respectively. The order of magnitude difference on the y-axis between step PMI and step yield indicated that step yield is distributed more narrowly than the step PMI. The median step PMI is about 58 and the average step PMI is around 85, while the median step yield is 80 M% and the average step yield is around 77 M%; it is worthwhile noting that the majority of the chemistry analyzed were programs in the earlier phases of development. We then categorized the data by reaction type, using a box-plot to convey the trends observed in the data from the 15 most common reaction types (Fig. 6). A total of 234 reactions (Table 1) were aggregated in the top 15 reaction types from the database. Boxplot analysis indicates 50% of the sampling distribution between the lower and upper edges of the box (lower to upper quartile) and the solid black line in the middle of the box signifies 50% sampling distribution above and below the line. The dots are marked as the outliers for each reaction type.
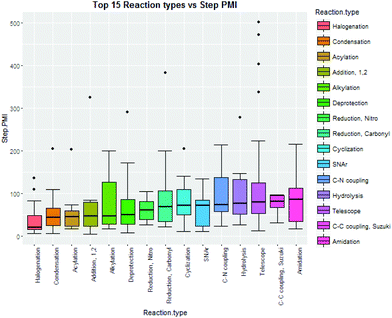 | ||
| Fig. 6 Boxplots of top 15 reaction type step PMI10 from BMS database. | ||
| Reaction type | Counts |
|---|---|
| Halogenation | 14 |
| Condensation | 25 |
| Acylation | 8 |
| Addition, 1,2 | 6 |
| Alkylation | 14 |
| Deprotection | 25 |
| Reduction, nitro | 7 |
| Reduction, carbonyl | 9 |
| Cyclization | 12 |
| SNAr | 10 |
| C–N coupling | 8 |
| Hydrolysis | 10 |
| Telescope | 58 |
| C–C coupling, Suzuki | 6 |
| Amidation | 22 |
As our database contains all of the scale-up processing information, including step PMI and step yield, across multiple campaigns and all major chemical transformation types developed internally during the past decade, we can adopt a simulation based approach to predict probable step PMI for a given transformation. This method approximates the negatively correlated bivariate distribution in both step PMI and yield. Here we assume that step PMI and yield can be sampled from a negatively-correlated bivariate normal distribution.11 The assumption allows us to provide input ranges between a pair of optimistic and pessimistic values for both step PMI and yield for each of the steps within the synthetic sequence. These ranges can be estimated based on the existing data in the database, other published scale-up procedures for a similar chemical transformation, or experiences acquired by the chemists during the studies. As shown in Fig. 7, this is a scatter plot of a bivariate distribution sampled for a particular scale-up process having step PMI between 26 to 105, and the step yield between 53 to 94 M%. This type of distribution with a large uncertainty is especially suitable for a transformation in a proposed synthetic sequence during the planning phase or an unoptimized laboratory run which has not been taken to larger scale. In essence, it is embedded in the analysis that there is a probability of a PMI outcome due to the inherent ranges at each step across the phases of development.
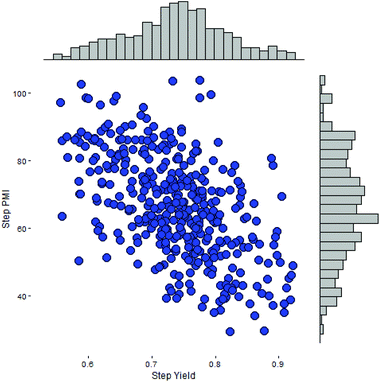 | ||
| Fig. 7 Simulated sampling of a negatively-correlated bivariate step PMI and step yield for a single step. | ||
With the availability of the cumulative PMI algorithm described above in both linear and convergent synthesis, and the assumption of a negatively-correlated bivariate distribution between step PMI and step yield, we can provide anticipated ranges for step PMI and yield based experience from similar reaction types. By providing these ranges for each individual proposed or unoptimized step in the synthetic sequence, we can predict the cumulative PMI for a given API.12 The average and the 95% confidence intervals for the predicted cumulative PMI can be retrieved from a Monte Carlo simulation (Fig. 8).
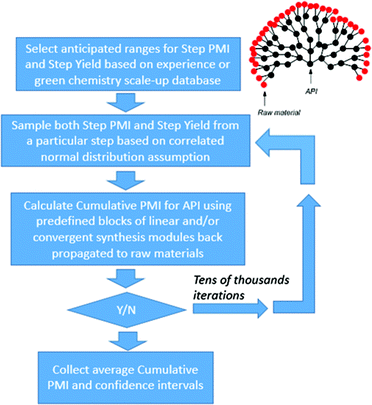 | ||
| Fig. 8 Monte Carlo simulation of cumulative PMI from step PMIs and step yields in a synthetic sequence. | ||
Results and discussion
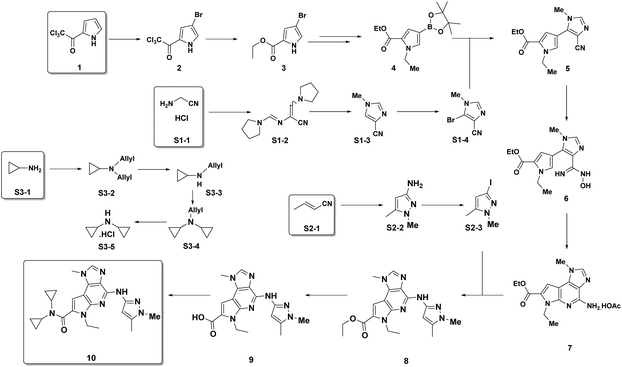
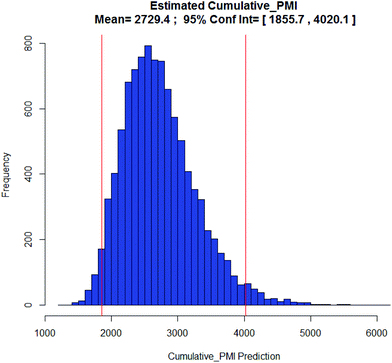
Examples of the use of predictive analytics methodology for cumulative PMI, as outlined above, are presented in the following case studies from the BMS portfolio: the JAK2 inhibitor BMS-911543,13 the VEGFR inhibitor brivanib,15 the CCR2 inhibitor BMS-741672,16 and the oral anticoagulant apixaban.17 In each case the analysis is performed holistically, starting from readily available bulk chemicals for all the fragments of each molecule, thus these are full PMI comparisons of the linear routes, not just comparisons based on leveraging an arbitrarily selected late stage intermediate as a proposed starting material.BMS-911543: A potent JAK2 inhibitor BMS-911543, 10, was discovered by BMS as a potential treatment for myeloproliferative disorders. To support the preclinical and early clinical development of the compound, a highly convergent route to this complex heterocycle was developed by inventing a Ni-mediated C–H functionalization (Scheme 3).13 The PMI for each step was determined after the scale-up from an initial clinical campaign, and the cumulative PMI for the API was about 3600 (see ESI†). For comparison, we retrospectively carried out a Monte Carlo simulation using the ranges of optimistic and pessimistic values for the anticipated reaction types from the BMS green chemistry database to predict the cumulative PMI. Gratifyingly, the prediction (Fig. 9) provided mean value of 2729 with 95% confidence interval between 1856 and 4020,14 which encompasses the actual PMI of 3600. The observed PMI is on the higher end of the prediction, consistent with this process being an unoptimized sequence from an early phase campaign. Given that the database contains process information from all phases of development, it is reasonable to assume that the predicted response can effectively be segmented based on phase of development (Fig. 10).
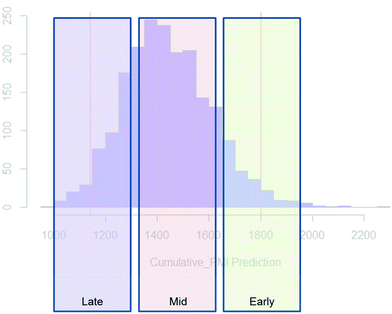 | ||
| Fig. 10 Schematic illustration of PMI ranges based on phase of the development, early, mid and late-phase development. | ||
This approach can also serve as a decision making tool post ideation, incorporating manufacturing and sustainability projections to the selection of which routes to explore, enabling decisions to be made based on the probability of obtaining high efficiency. For example, we can compare another potential route to BMS-911543, which was proposed at the time of the original route scouting but was not pursued, (alternate 1, Fig. 11). At the time of our initial work this alternate route was deprioritized, but was ultimately shown to have better efficiency, matching with the below prediction.
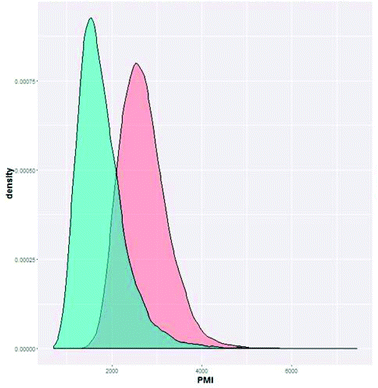 | ||
| Fig. 11 Cumulative PMI predicted for Ni-mediated C–H functionalization route (option 1, red) and another route (alternate 1, blue, unpublished). | ||
In order to develop a method for comparing routes, we looked to comparing the actual PMI outcome to the prediction. By comparing the actual cumulative PMI against the bell curve of the predicted cumulative PMI, we can see how this synthesis compares to the sum of all historical experiences of similar chemistry. For this early development enabling route, our PMI was in the high third… i.e. better than only 10% of prior similar chemistry. We clearly had a long way to go before this approach was efficient in the global context.
With this knowledge in hand, we can make a data-driven decision on our next phase of development, namely, should we invest time and effort to improve the efficiency of the existing approach, or would another option give a higher probability of achieving greater efficiency. It is clear from Fig. 11 that the other option (alternate 1) offered a higher chance of achieving an efficient outcome, suggesting that it was not worth the effort to develop the existing approach; alternate 1 had a much higher probability of being green. If we were making this decision today, we may have chosen alternate 1 from the beginning, saving time, energy and resources. This analysis helps us see that individual step efficiency is not a hallmark of overall efficiency if the synthetic strategy is the problem.
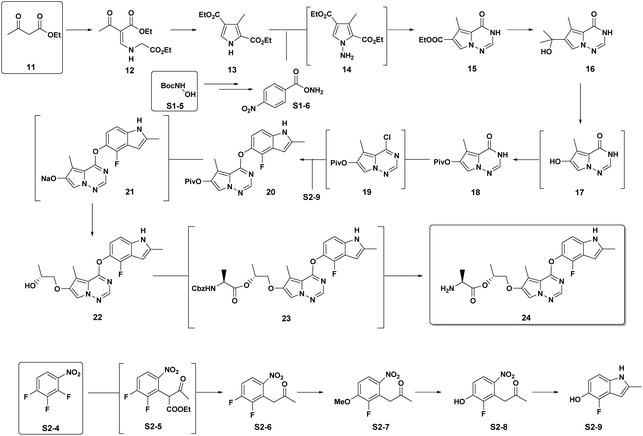
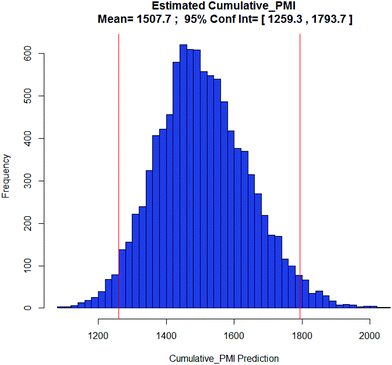
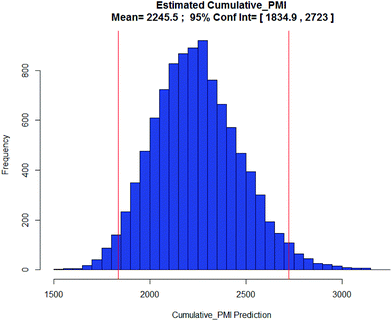
Brivanib: Our 2nd case study is brivanib (24), a pyrrolotriazine VEGFR/FGFR inhibitor developed by BMS as part of our oncology portfolio.15 This project was progressed to a much later stage of development to where a fully optimized and robust manufacturing route was developed (Scheme 4). The cumulative PMI for the overall process was 1488 – from readily available commercial starting materials. By comparing this value to the predicted cumulative PMI range (Fig. 12), we see the actual PMI is slightly lower than the average predicted PMI – indicating that this optimized synthesis had a cumulative PMI in the 54th percentile with respect to similar chemistries executed on scale at different development stages. We could call this an efficient synthesis, though not highly efficient vs. similar chemistries, especially considering the late phase of development.
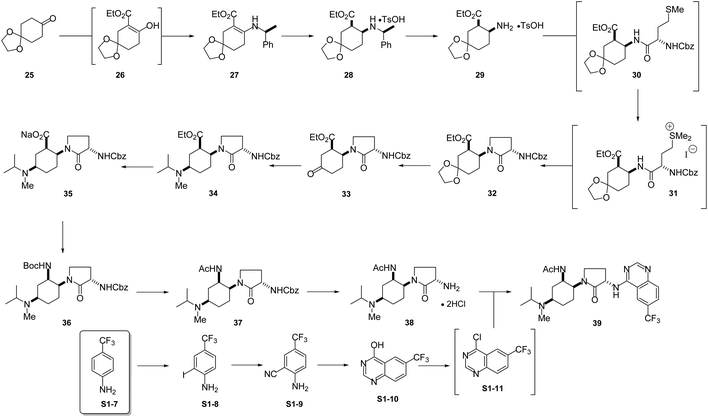
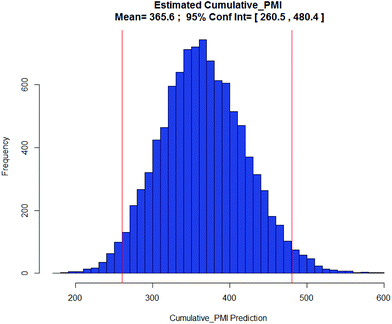
BMS-741672: The 3rd case study involves CCR2 antagonist BMS-741672 (39), a highly complex molecule developed as a prospective therapeutic agent for the treatment of inflammatory, cardiovascular and metabolic diseases (Scheme 5).16 Except for the API step, the individual step PMI values were all on the lower end of the spectrum, with many steps having PMI's <20, while the actual cumulative PMI for the overall process from readily available bulk chemicals was 1717 (see ESI†). Compared to the predicted cumulative PMI (Fig. 13), the actual results are well below the lower end of the 95% confidence interval. Considering the complexity of the molecule and the early-stage of the development, this is clearly a well optimized synthesis, with several steps that are much greener than their peer group.
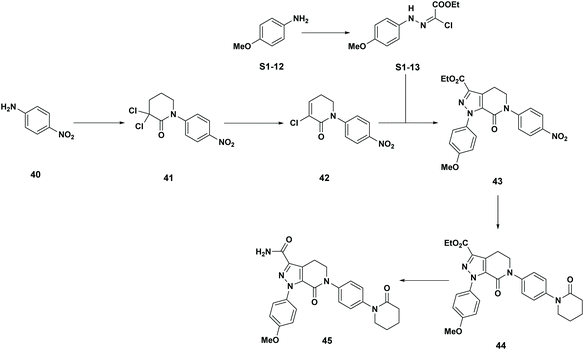
Apixaban: Our final case study is apixaban (45), an orally bioavailable inhibitor of blood coagulation factor Xa, developed for thrombotic diseases and commercialized as Eliquis (Scheme 6).17 This highly optimized process evolved through multiple rounds of development and the data reported is taken from the validation campaign, thus ready for product launch. The actual cumulative PMI for the overall process was 197, which is significantly below the lower end of the 95% confidence interval for the predicted cumulative PMI (Fig. 14). In essence, it is lower than 99.9% of the similar chemistries executed on scale at different development stages. This is the one of a few commercial assets in our current database, and while obviously efficient, this score should be viewed with the perspective that most of the data available to us in this proof of concept study is in the development phase, and thus encompasses a wide range of optimization levels. However, in order to compare more globally, more data, from more companies, and across all phases of development is needed.
The examples highlighted above serve as case studies to demonstrate the potential applications of this approach, both in decision making and benchmarking, by comparing the status of an actual synthesis with the predicted ranges – which are based on real-world data. In a broader context, we can now leverage the PMI score for each synthesis, in comparison to the predicted distribution, with any other molecule's percentile score – which allows us to benchmark the PMI scores for these different molecules. In the examples listed above, apixiban is the most efficient (99.9th percentile), followed by the CCR2 molecule BMS-741672 (99th percentile), brivanib (54th percentile) and finally the JAK2 inhibitor BMS-911543 (10th percentile).
In order to understand how the input variables, such as the pessimistic and optimistic pairs of step PMI and molar yield ranges, impact the cumulative PMI prediction we performed a sensitivity analysis, using the predicted PMI of Apixaban as an example. The tornado plot (Fig. 15), clearly shows that the largest impact comes from the step molar yield closest to the API, as would be expected. The last two steps after the convergent step contributed to the major variabilities in the predicted cumulative PMI score albeit less than ±2% in response to 5% perturbation from the input variable.
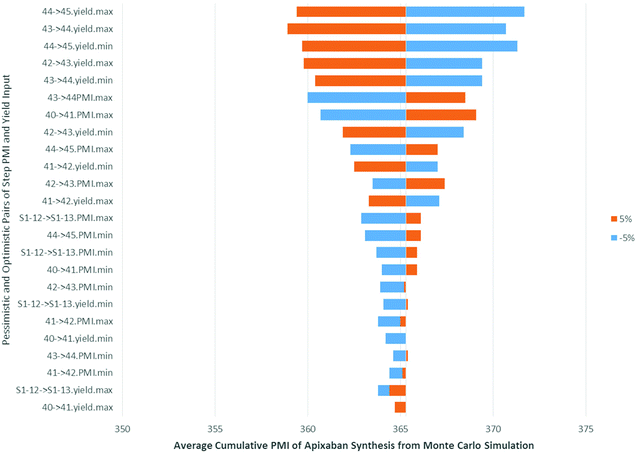 | ||
| Fig. 15 Tornado plot of input variables on predicted apixaban cumulative PMI (mean) in Monte Carlos simulation. | ||
The main limitations associated with the current model pertains to the lack of data. We have leveraged our internal database for the majority of the information that enabled the development of this methodology, though modestly supplemented with additional literature data. With this information we have successfully outlined the method and developed this proof of concept. However, the accuracy of the predictions, especially for the comparison between molecules and phases of development would be significantly enhanced by the availability of more data and information. In the next phase of this work, we hope to expand the data included in this analysis through collaboration with other organizations, investigate other foundational metrics and to expand the accuracy and validity of the output to develop a true benchmarking method. With an expanded data set, we also hope to include PMI metrics for the reagents/reactants above and below the arrow, predicting both the reaction PMI as well as probable reagents, catalysts or ligands. This will provide a more thorough prediction of the holistic impact of a proposed synthesis.
Conclusion
We have demonstrated that data analytics can help answer two critical questions confronting chemists: How do I make green decisions early in development? How do I know how good my synthesis is against other molecules?We believe that this approach, based on predictive modeling capabilities, will enable teams across the pharmaceutical industry to make more sophisticated selections during both the route design (ideation) and route scouting (selection) phases of development, as well as in understanding the impact of their work in its ultimate outcome (comparison). We believe the importance of data aggregation will further expand the knowledge in the database; it is vital that more data be added to expand the impact and accuracy of this approach. Expansion of the data set will likely improve the quality of the predictions, which will lead to more accurate analysis and comparison. A second important area of expansion is in developing a more holistic understanding of the impact of key decisions, addressing the third issue noted in the introduction. With the integration of data on the preparation of key reagents, reactants, catalysts and ligands, coupled with a prediction of their probable use in a given transformation, the simulation could enable us to include the PMIs of proposed reagents, reactants and likely catalysts and ligands in decision making. Thus, the framework outlined herein is capable of providing a more global analysis of the efficiency of a proposed molecule and the optionality in its synthesis, integrating the full impact of chemistry selections into the route design process. Significantly more data is needed for this expansion, but in order to understand the global impact and efficiency of a synthesis, this is an essential next step.
Green chemistry has developed multiple principles and metrics, with improvements being made regularly (such as the recent development of the GAL methodology4). However, it is time to bring this information to life, leveraging these amassed data sets to make smarter, greener decisions.
Acknowledgements
The authors would like to thank Dr Srinivas Tummala, Dr Robert Waltermire, Dr David Leahy, Dr Yi Hsiao and the chemistry community at Bristol-Myers Squibb for their endless inspiration and for providing the data and support for this work.References
- (a) P. T. Anastas and J. C. Warner, Green Chemistry: Theory and Practice, Oxford University Press, New York, 1998 Search PubMed; (b) A. Lapkin and D. Constable, Green chemistry Metrics: Measuring and Monitoring Sustainable Processes, Wiley, 2008 Search PubMed; (c) W. J. W. Watson, Green Chem., 2012, 14, 251–259 RSC; (d) R. A. Sheldon, Chem. Soc. Rev., 2012, 41, 1437–1451 RSC; (e) P. J. Dunn, Chem. Soc. Rev., 2012, 41, 1452–1461 RSC; (f) C. Cappello, U. Fischer and K. Hungerbuhler, Green Chem., 2007, 9, 927–934 RSC; (g) R. K. Henderson, C. Jiménez-González, D. J. C. Constable, S. R. Alston, G. G. A. Inglis, G. Fisher, J. Sherwood, S. P. Binks and A. D. Curzons, Green Chem., 2011, 13, 854–862 RSC; (h) R. J. Giraud, P. A. Williams, A. Sehgal, E. Ponnusamy, A. K. Phillips and J. B. Manley, ACS Sustainable Chem. Eng., 2014, 2, 2237–2242 CrossRef CAS; (i) R. Ciriminna and M. Pagliaro, Org. Process Res. Dev., 2013, 17, 1479–1484 CrossRef CAS; (j) D. J. C. Constable, A. D. Curzons and V. L. Cunningham, Green Chem., 2002, 4, 521–527 RSC.
- (a) R. A. Sheldon, Chem. Ind., 1997, 12–15 CAS; (b) R. A. Sheldon, Green Chem., 2007, 9, 1273–1283 RSC.
- (a) C. Jiménez-González, C. S. Ponder, Q. B. Broxterman and J. B. Manley, Org. Process Res. Dev., 2011, 15, 912–917 CrossRef; (b) C. Jimenez-Gonzalez, D. J. C. Constable and C. S. Ponder, Chem. Soc. Rev., 2012, 41, 1485–1498 RSC; (c) D. P. Kjell, I. A. Watson, C. N. Wolfe and J. T. Spitler, Org. Process Res. Dev., 2013, 17, 169–174 CrossRef CAS; (d) C. Jiménez-González, C. Ollech, W. Pyrz, D. Hughes, Q. B. Broxterman and N. Bhathela, Org. Process Res. Dev., 2013, 17, 239–246 CrossRef; (e) A. S. Cote, et al., 13th Annual Green Chemistry & Engineering Conference, College Park, MD, June 23–25, 2009. http://acs.confex.com/…/paper69453_5.pdf Search PubMed; (f) https://www.acs.org/content/dam/acsorg/greenchemistry/industriainnovation/roundtable/process-mass-intensity-calculation-tool.xls .
- F. Roschangar, R. A. Sheldon and C. H. Senanayake, Green Chem., 2015, 17, 752–768 RSC.
- N. G. Anderson, Org. Process Res. Dev., 2008, 12, 1019–1020 CrossRef CAS.
- P. Yaseneva, P. Hodgson, J. Zakrzewski, S. Falß, R. E. Meadows and A. A. Lapkin, Rect. Chem. Eng., 2016, 1, 229–238 RSC.
- T. Gaich and P. S. Baran, J. Org. Chem., 2010, 75, 4657–4673 CrossRef CAS PubMed.
- J. Li and M. D. Eastgate, Org. Biomol. Chem., 2015, 13, 7164–7176 CAS.
- T. Li and X. Li, Green Chem., 2014, 16, 4241–4256 RSC.
- Note: Step PMI for both deprotection and telescope are grouped categories which include multiple different reaction types.
- Conceptually, see the following reference: D. W. Hubbard, How to measure anything, Wiley, 2nd edn, 2010 Search PubMed. Details see ESI.†.
- Note: The caveat in using the step PMI and step yield in the calculation of cumulative PMI is to make sure both values are based on “effective” step PMI rather than “apparent” step PMI where in some cases low potency product stream mass was treated as a whole in apparent step PMI calculation in the database. It does not affect the cumulative PMI calculation in the database but does need to be corrected for aggregated data process and use in the Monte Carlo algorithm.
- M. A. Fitzgerald, O. Soltani, C. Wei, D. Skliar, B. Zheng, J. Li, J. Albrecht, M. Schmidt, M. Mahoney, R. J. Fox, K. Tran, K. Zhu and M. D. Eastgate, J. Org. Chem., 2015, 80, 6001–6011 CrossRef CAS PubMed.
- It should be noted that the prediction algorithm treats the convergent synthesis as a 1
![[thin space (1/6-em)]](https://www.rsc.org/images/entities/char_2009.gif) :
:![[thin space (1/6-em)]](https://www.rsc.org/images/entities/char_2009.gif) 1 molar ratio between any of the two branches for simplicity. In reality, the typical molar ratios were observed between 1.1–1.3 for the syntheses of 5, 7 and 10. This only introduced ∼8% downward error for the average prediction, which would not be a major concern in face of other uncertainties in the step PMI and step yield input ranges.
1 molar ratio between any of the two branches for simplicity. In reality, the typical molar ratios were observed between 1.1–1.3 for the syntheses of 5, 7 and 10. This only introduced ∼8% downward error for the average prediction, which would not be a major concern in face of other uncertainties in the step PMI and step yield input ranges. - (a) P. C. Lobben, E. Barlow, J. S. Bergum, A. Braem, S.-Y. Chang, F. Gibson, N. Kopp, C. Lai, T. L. LaPorte, D. K. Leahy, J. Müslehiddinoğlu, F. Quiroz, D. Skliar, L. Spangler, S. Srivastava, D. Wasser, J. Wasylyk, R. Wethman and Z. Xu, Org. Process Res. Dev., 2015, 19, 900–907 CrossRef CAS; (b) J. A. Pesti, T. LaPorte, J. E. Thornton, L. Spangler, F. Buono, G. Crispino, F. Gibson, P. Lobben and C. G. Papaioannou, Org. Process Res. Dev., 2014, 18, 89–102 CrossRef CAS; (c) T. L. LaPorte, L. Spangler, M. Hamedi, P. Lobben, S. H. Chan, J. Muslehiddinoglu and S. S. Y. Wang, Org. Process Res. Dev., 2014, 18, 1492–1502 CrossRef CAS.
- J. Deerberg, S. J. Prasad, C. Sfouggatakis, M. D. Eastgate, Y. Fan, R. Chidambaram, P. Sharma, L. Li, R. Schild, J. Müslehiddinoğlu, H.-J. Chung, S. Leung and V. Rosso, Org. Process Res. Dev., 2016 DOI:10.1021/acs.oprd.6b00282.
- (a) D. J. P. Pinto, M. J. Orwat, S. Koch, K. A. Rossi, R. S. Alexander, A. Smallwood, P. C. Wong, A. R. Rendina, J. M. Luettgen, R. M. Knabb, K. He, B. Xin, R. R. Wexler and P. Y. S. Lam, J. Med. Chem., 2007, 50, 5339–5356 CrossRef CAS PubMed; (b) R. Shapiro, L. T. Rossano, B. M. Mudryk, N. Cuniere, M. Oberholzer, H. Zhang and B.-C. Chen, US20060069258A1, 2006 Search PubMed; (c) A. Ramirez, B. Mudryk, L. Rossano and S. Tummala, J. Org. Chem., 2012, 77, 775–779 CrossRef CAS PubMed.
Footnote |
| † Electronic supplementary information (ESI) available. See DOI: 10.1039/c6gc02359b |
| This journal is © The Royal Society of Chemistry 2017 |

