Chemical and functional properties of metal chelators that mobilize copper to elicit fungal killing of Cryptococcus neoformans†
Marian E.
Helsel
,
Elizabeth J.
White
,
Sayyeda Zeenat A.
Razvi
,
Bruno
Alies
and
Katherine J.
Franz
*
Department of Chemistry, Duke University, French Family Science Center, 124 Science Drive, 22708, Durham, NC, USA. E-mail: katherine.franz@duke.edu; Tel: +1 919-660-1541
First published on 17th November 2016
Abstract
A panel of iron (Fe) and copper (Cu) chelators was screened for growth inhibitory activity against the fungal pathogen Cryptococcus neoformans. Select bidentate metal-binding ligands containing mixed O,S or O,N donor atoms were identified as agents that induce cell killing in a Cu-dependent manner. Conversely, structurally similar ligands with O,O donor atoms did not inhibit C. neoformans growth regardless of Cu status. Studies of Cu(II) and Cu(I) binding affinity, lipophilicity, and growth recovery assays of Cu-import deficient cells identified lipophilicity of thermodynamically stable CuIIL2 complexes as the best predictor of antifungal activity. These same complexes induce cellular hyperaccumulation of Zn and Fe in addition to Cu. The results described here present the utility of appropriate metal-binding ligands as potential antifungal agents that manipulate cellular metal balance as an antimicrobial strategy.
Significance to metallomicsMaintenance of the cellular metallome is essential for cell survival, therefore interrupting this balance provides intriguing strategies for developing novel therapies. In this manuscript, we establish chemical and physical properties of simple bidentate metal chelating agents that show antifungal activity against the opportunistic pathogen Cryptococcus neoformans in a manner that depends on copper. The active agents form strong, lipophilic complexes with copper(II) that induce cellular hyperaccumulation of Zn and Fe in addition to Cu, suggesting that alterations of one metal induce changes to the global metallome. The results reported here present the utility of appropriate metal-binding ligands as potential antifungal agents that manipulate cellular metal balance as an antimicrobial strategy. |
Introduction
The emergence of antibiotic resistance to nearly all antimicrobial agents on the market today is a significant threat to public health. Resistant fungal infections are notoriously difficult to treat because yeast share biochemical similarities with mammalian cells that pose challenges for finding drug targets that are unique to the pathogen and avoid damage to the host. Furthermore, opportunistic fungi are ubiquitous in the environment and tend to colonize areas of the body poorly accessible to drugs.1,2Several species of the Cryptococcus genus, including C. neoformans, are pathogenic fungi that are acquired from the environment via inhalation and initially colonize the lung. Subsequent dissemination to the brain can ultimately lead to lethal meningitis, especially in immunocompromised patients.3,4 Current treatment options include three main classes: (1) the azoles, of which fluconazole is one example, inhibit the fungal 14α lanosterol demethylase, thereby disrupting biosynthesis of ergosterol, a main component of the plasma membrane; (2) the polyenes, which include amphotericin B, disrupt membrane integrity by binding to membrane components; and (3) RNA inhibitors like flucytosine, which, upon intracellular conversion to 5-fluorouracil, cause RNA miscoding and inhibition of DNA synthesis.5 While combination therapies sometimes boost efficacy of these drugs, incidences of mortality remain high.6 As a result there is need for new therapeutic strategies with increased efficacy against fungal pathogens.
Studies by others have demonstrated that iron (Fe) and copper (Cu) both play important roles in C. neoformans virulence.7 While both Fe and Cu are essential metals for fungi, excessive levels of either metal can also induce damage and inhibit growth.8,9 Fe is critical for heme biosynthesis and oxidative phosphorylation and serves as a critical cofactor for dozens of enzymatic reactions critical for C. neoformans.10–13 Cu is necessary for melanin formation, Fe uptake, detoxification of reactive oxygen species (ROS), and respiration.4,11,14,15 Under certain conditions, C. neoformans produces a melanin coat on its cell well that is synthesized by laccase, a secreted Cu-dependent oxidase.16 Deletion of the genes encoding either laccase or the secretory compartment Cu importer Ccc2 were found to severely diminish C. neoformans virulence.16,17 Another important role that Cu plays is the acquisition of Fe(II) through a complex formed between the high affinity iron permease Ftr1 and multicopper ferroxidase Fet3.10 Deletion of Ftr1 in another fungal pathogen, Candida albicans, eliminated its infection capacity under Fe-deficient conditions.18 Moreover, C. neoformans mutant strains that lack genes encoding their Cu detoxifying metallothioneins, CMT1 and CMT2, lose virulence under high Cu conditions, while strains lacking the high affinity Cu transporters, CTR1 and CTR4, have severe growth defects under low Cu conditions.19 A recent study has further revealed that C. neoformans switches from a Cu detoxification mode to a Cu acquisition mode as it disseminates from primary infection in the host lung (where Cu is relatively high) to the brain (where Cu is relatively scarce).20 These examples emphasize the dual task of fungal cells to acquire sufficient Cu to promote growth and virulence, while also defending against metal toxicity.7,9
Based on the need of C. neoformans to acquire and regulate these two metals for survival and virulence in a host, we hypothesized that small molecules that alter Fe and/or Cu bioavailability might be potent inhibitors of fungal growth. We therefore assayed a panel of metal chelating agents for their ability to inhibit C. neoformans growth. We show here that chelating agents that tightly sequester Fe or Cu have little effect on growth under our assay conditions, whereas agents that facilitate increased intracellular Cu levels not only inhibit growth, but are fungicidal. We previously reported Cu-dependent antifungal activity for 8-hydroxyquinoline, a bidentate ligand with mixed O,N donor atoms.21 Here we show that other compounds in this category include several bidentate ligands that contain mixed O,S donor atoms. Conversely, similar molecules with O,O donor atoms were ineffective at killing C. neoformans. Furthermore, we show that select O,S mixed donor ligands elicit fungal killing of C. neoformans in a Cu-dependent manner. The ionophores described here underscore the utility of antifungal agents that manipulate Cu as an antimicrobial strategy.
Results and discussion
Screening compounds for antifungal activity
The requirement of C. neoformans to acquire and regulate both Fe and Cu for survival and virulence led us to screen small molecules that bind these metal ions under biological conditions. The compounds shown in Fig. 1 were chosen to cover diverse representation in terms of metal ion selectivity, denticity of metal binding site, type of donor atoms, thermodynamic binding affinity, and lipophilic/hydrophilic nature. In the list, for example, are general metal chelators like ethylenediamine tetraacetic acid (9, EDTA), high-affinity iron chelators desferrioxamine B (7, DFO) and deferasirox (5) that are used clinically to treat iron overload disorders, and intracellular metal chelators like salicylaldehyde isonicotinoyl hydrazine (27, SIH). We also looked at high-affinity extracellular and intracellular Cu binders including bathocuproine disulfonic acid (3, BCS) and neocuproine (20), respectively, as well as ionophores like 8-hydroxyquinoline (12, 8HQ), pyrithione (28, PyS) and disulfiram (32, DSF) recognized for their ability to increase cellular metal concentrations.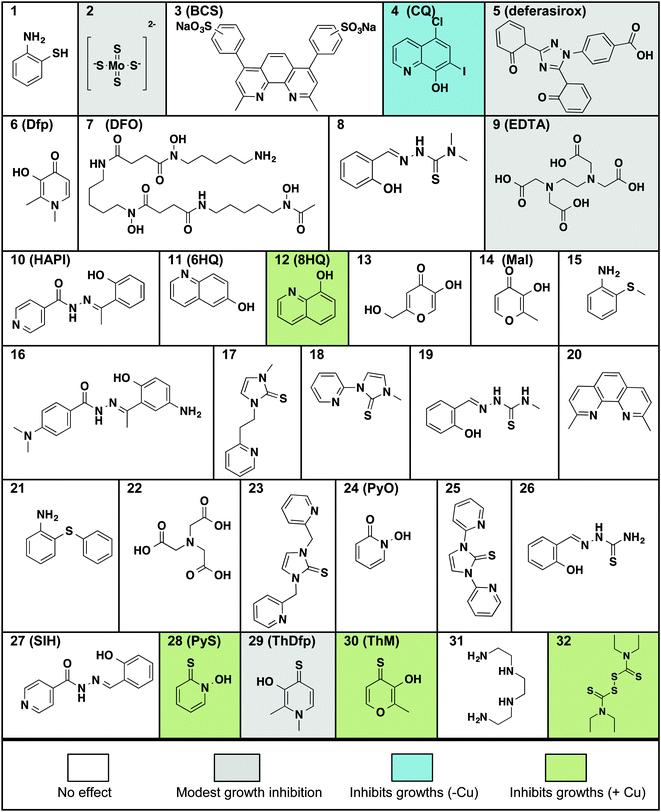 | ||
| Fig. 1 Molecules tested for their effect on C. neoformans’ growth in liquid culture at 30 °C for 48 h. Compounds are arranged in alphabetical order by the chemical names given in Table S1 (ESI†). All compounds were tested at concentrations up to 100 μM, with the exception of ThDfp, which was tested up to 200 μM, in SC medium with and without the addition of 1 mM supplemental CuSO4. Compounds that inhibited growth without added Cu are shaded gray if the effect was only moderate and blue if it was more pronounced, those that inhibited growth only when supplemental Cu was present are shaded green, and those that showed no effect on growth (i.e. MIC > 100 μM) are white. | ||
All compounds in Fig. 1 were assayed for their effect on C. neoformans’ growth in vitro by monitoring the optical density of liquid cultures in SC medium incubated at 30 °C for 48 h in the presence of up to 100 μM compound. The assays were then repeated by including either high (1 mM) or low (10 μM) concentrations of supplemental Cu, added as CuSO4. The minimal inhibitory concentration (MIC) for each compound was calculated as the lowest concentration of compound for which the optical density did not increase, indicating lack of growth (Table 1). We identified four categories of agents: those that do not affect growth, those that moderately slow growth at the maximal dose, those that fully inhibit growth in the absence of supplemental Cu, and those that inhibit growth significantly better in combination with supplemental Cu added to SC medium.
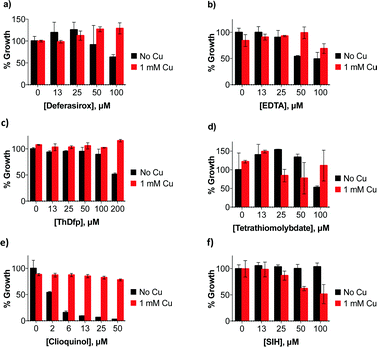
Notable among the compounds that either did not limit growth or only moderately limited growth in SC were those agents considered to be traditional chelators that sequester Fe and Cu, like EDTA, BCS, and desferrioxamine. The results indicate that general chelators like EDTA (12) as well as extracellular and intracellular Fe-sequestering chelators like deferasirox (7) and SIH (27) permit growth over 48 h, as do Cu chelators like BCS (3) and tetrathiomolybdate (2, TTM). The MIC for these agents is higher than 100 μM, although high concentrations (100 μM) of deferasirox, EDTA, ThDfp, and TTM prolonged the lag phase to exponential growth, resulting in a decrease in growth compared to no treatment at 48 h (Fig. 2a–d).
Under our conditions, C. neoformans grows normally even in the presence of 1 mM supplemental Cu, in agreement with previous reports.19 This observation suggests that C. neoformans has robust mechanisms to tolerate high Cu growth conditions. Interestingly, the moderate growth inhibition observed at high concentrations of deferasirox, EDTA, ThDfp, and TTM was reversed when supplemental Cu was present (Fig. 2a–d). This observation suggests that the stunted growth could be due to metal deficiency induced by the chelators, a condition that is likely prevented by saturating them with extra Cu. A similar reversal effect by Cu was observed for clioquinol (4, CQ), one of the few agents for which a reasonable MIC was measured in un-supplemented SC. As shown in Fig. 2e, the 50 μM growth inhibition by CQ was completely abrogated in the presence of 1 mM Cu. The addition of Cu in combination with SIH, on the other hand, inhibited growth slightly (Fig. 2f). Combined, these results indicate that C. neoformans survives under conditions where Fe and Cu are limited by the presence of metal sequestering agents in the growth medium.
Like CQ, pyrithione (30, PyS) and disulfiram (32, DSF) also inhibited growth of C. neoformans in the absence of supplemental Cu. In contrast to CQ, however, added Cu only minimally perturbed the MIC of PyS, with the high Cu condition slightly increasing it from 3 to 6 μM, and the low Cu condition decreasing it to 0.8 μM (Table 1). For DSF, the MIC improved from 25 μM down to 2–6 μM in the presence of added Cu (Fig. S1, ESI†).
In sharp contrast to the effects of the metal sequestering agents, both 8HQ (12) and thiomaltol (30, ThM) showed dramatic improvements in efficacy in the presence of supplemental Cu. Whereas neither of these agents inhibited growth at concentrations up to 100 μM on their own, the addition of Cu caused the MIC value to shift down to 3–6 μM for 8HQ and 6–25 μM for ThM, with the lower Cu dose providing the best response (Table 1).
In combination, these assays therefore identified 8HQ, ThM, PyS and DSF as (N,O), (O,S) and (S,S) bidentate chelators with antifungal properties that are improved in the presence of Cu. The identification of these growth inhibitory agents against C. neoformans is consistent with the long history of antimicrobial activity documented for these compounds, which are often characterized as ionophores that enhance cellular metal uptake and accumulation.22–27 In contrast, the O,O counterparts, maltol (14, Mal), pyridinol-n-oxide (24, PyO), and deferiprone (6, Dfp), did not significantly inhibit growth, regardless of the presence of Cu (Table 1, Fig. S1, ESI†).
Competitive Cu chelation reverses growth inhibition
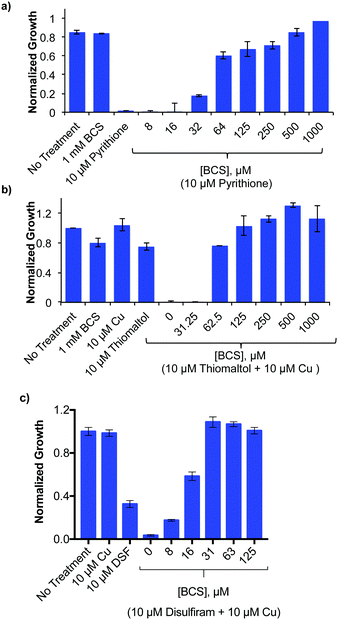
The Cu-enhanced antifungal activity of select agents against C. neoformans, suggests that their ability to bind Cu is important for their growth-inhibitory activity. To test this premise, C. neoformans was incubated with antifungal concentrations of ThM or DSF in combination with Cu, or with PyS without supplemental metal, and co-incubated with the membrane impermeable Cu(I) chelator, BCS (Fig. 3). Consistent with earlier studies, C. neoformans grew well under Cu-limiting conditions created by the presence of a high concentration of this extracellular Cu(I) chelator.14 Co-incubation with BCS showed a dose-dependent restoration of C. neoformans growth in the presence of otherwise inhibitory conditions of PyS, DSF and ThM. These results show that BCS is able to prevent ThM, DSF and PyS from eliciting cytotoxicity, likely by competing with these agents to bind Cu. Similar competitive chelation by BCS blocked cytotoxicity of 8HQ in our previous study.21 Toxic effects of DSF have also been reversed by BCS competition in other cell lines.26,28 While supplemental Cu only slightly promoted the growth inhibitory activity of PyS (Table 1), the fact that BCS reverses its activity provides evidence that PyS not only requires Cu for its activity, but also that trace Cu present during normal growth conditions in SC is sufficient for this effect.Metal specificity of antifungal activity
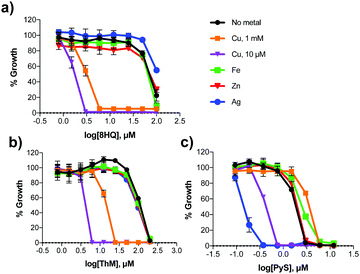
The active agents identified from our growth screen are capable of binding a variety of metal ions. In order to assess the metal specificity of these agents that determines their antifungal activity, C. neoformans was grown with 8HQ, ThM and PyS in the presence of 10 μM supplemental Cu(II), Zn(II), Fe(III) or Ag(I). DSF was not included in these studies, although its Cu specificity has been reported.26 These concentrations of supplemental metal salts did not affect C. neoformans growth at 48 h compared to un-supplemented controls. As shown in Fig. 4, the addition of Fe(III) and Zn(II) did not significantly affect the MIC of 8HQ, ThM or PyS, whereas addition of Cu(II) caused a significant decrease in MIC for all 3 compounds. These data support the conclusion that Cu binding is responsible for the antifungal activity of all three ligands. The addition of Ag(I), which has similar binding preferences to Cu(I), also significantly lowered the MIC of PyS, although it had no effect on either 8HQ or ThM.Fungicidal activity of 8HQ, PyS and ThM in the presence of Cu
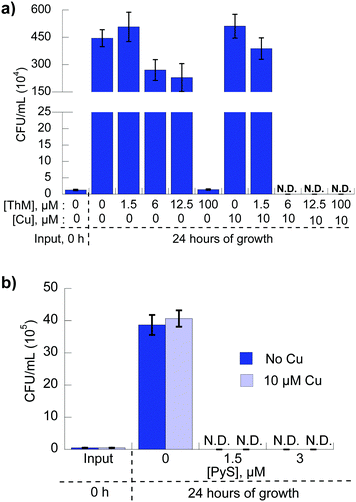
To determine whether the Cu-dependent growth inhibitory activity observed for 8HQ, PyS and ThM is fungicidal or fungistatic, C. neoformans was incubated with each agent alone or in the presence of 10 μM CuSO4 for 24 hours in liquid culture, then colony-forming units (CFU) were quantitated for each condition. Previously, we reported that C. neoformans cells incubated in medium with 8HQ in the presence of 10 μM Cu led to an absence of detectable viable fungi, evidence of fungicidal action.21 As shown in Fig. 5a, fungi grown in medium containing 100 μM ThM without Cu were unable to replicate and CFUs were the same level as input at 0 h, indicating the agent is fungistatic at this concentration. With co-administration of 10 μM supplemental Cu, replication was only observed for concentrations of ThM lower than the MIC value, whereas no viable fungi were detected above 6 μM ThM with 10 μM Cu, indicating fungicidal activity for these combinations. Similarly, C. neoformans grown in medium containing 3 μM PyS with or without Cu were unable to replicate, indicating the agent is fungicidal (Fig. 5b).Select agents provide bioavailable Cu
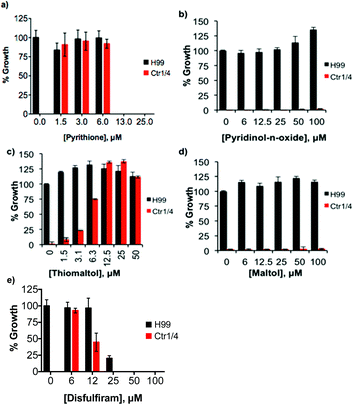
C. neoformans imports Cu through functionally redundant high affinity Cu(I) importers, Ctr1 and Ctr4.14 Without these proteins, a ctr1Δctr4Δ mutant strain of C. neoformans does not have enough Cu to load cytochrome c oxidase to support respiration. As a result, this mutant fails to grow in YPEG medium that is not supplemented with Cu and contains ethanol and glycerol as the sole carbon sources.14 However, growth of this mutant was restored to near wild type levels by addition of micromolar concentrations of ThM, PyS, and DSF (Fig. 6). Similar results were reported previously for 8HQ, which can also recover growth of the ctr1Δctr4Δ mutant under these conditions.21 Higher concentrations of these agents inhibited growth of the ctr1Δctr4Δ mutant (see Fig. 6), consistent with the cytoxic activity observed for wild type cells cultured in SC medium. These results suggest that all four agents that show Cu-enhanced fungicidal activity against wild type C. neoformans also provide bioavailable Cu to a mutant that lacks its normal Cu import machinery.Interestingly, the inactive O,S mixed ligand ThDfp, the O,O donor ligands maltol, Dfp and PyO, and the O,N quinoline derivative CQ were unable to restore growth in the ctr1Δctr4Δ mutant (Fig. 6 and Fig. S2 (ESI†)). These results suggest these ligands either do not facilitate Cu entry into the cell, or are otherwise unable to make it bioavailable to cytochrome c oxidase.
Chemical and physical properties of ligands related to their biological activity
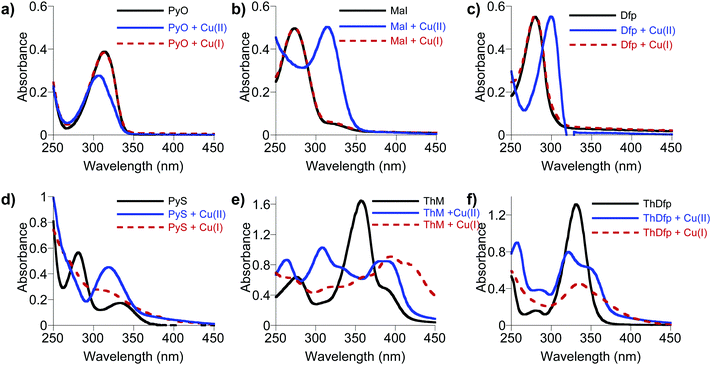
In order to gain further insight into the striking differences in antifungal activity of the structurally related (O,S) vs. (O,O) bidentate chelators listed in Table 1, we investigated their various chemical and physical properties to elucidate potential structure–function relationships. The Cu-dependent antifungal activity of bidentate ligands, PyS, ThM, and 8HQ, suggests that Cu binding ability might be an important parameter influencing their antifungal activity. On the other hand, the structurally similar bidentate ligands (PyO, Maltol, Dfp, ThDfp, and CQ) do not show Cu-dependent antifungal activity. This difference in antifungal activity might be related to differences in thermodynamic binding affinity of these ligands for both oxidation states of Cu(II) and Cu(I). The extracellular environment of a fungal cell growing under normoxic conditions is likely to support Cu(II), while the intracellular reducing environment likely favors Cu(I). The antifungal screening assay does not provide direct evidence as to preferred oxidation state of Cu in the presence of these compounds.Using UV-visible spectroscopy, each ligand was monitored in the presence and absence of Cu(II) and Cu(I) in Britton–Robinson universal buffer, pH 7.4. The Cu(II) binding studies were done under ambient laboratory conditions using CuSO4 as the Cu(II) source, while the Cu(I) studies were conducted in strictly anaerobic conditions in a nitrogen-filled glove box with [Cu(CH3CN)4]PF4 as a Cu(I) source. As shown in Fig. 7a–c, the O,O ligands (Dfp, maltol, and PyO) in pH 7.4 buffered solution give absorption bands at 275, 270, and 312 nm, respectively, that shift to 302, 318, and 308 nm upon addition of half an equivalent of Cu(II). These spectral shifts indicate formation of Cu(II)L2 complexes for all three O,O ligands, as anticipated based on the known metal coordination chemistry of this family of ligands.29 On the other hand, no spectral changes were observed upon addition of Cu(I), suggesting the absence of complex formation.
In contrast to the O,O ligands, the O,S ligands PyS, ThM and ThDfp showed spectral changes that shifted upon addition of both Cu(II) and Cu(I) (Fig. 7d–f). While there are reports of these O,S ligands with various metals,29–32 including Cu(II), little is reported on their Cu(I) coordination chemistry. The stoichiometry of PyS, ThM and ThDfp for Cu(II) and Cu(I) was therefore assessed by Job's method of continuous variation, as shown in Fig. S3 and S4 (ESI†). A series of solutions containing ligand and Cu were prepared with 5% DMSO in universal buffer, pH 7.4 such that the sum of the total metal ion and ligand concentration remained constant as the mole fraction of Cu was varied from 0.1 to 1.0; all Cu(I) samples were prepared and measured anaerobically. Solutions were analyzed by UV-vis spectrophotometry. The stoichiometry was determined by plotting the absorbance at a wavelength characteristic of the Cu-complex with little initial absorbance from the ligand itself against the mole ratio ([Cu]/([Cu] + [ligand])). With Cu(II), all three ligands showed an inflection point at a mole fraction of 0.3, indicative of bis complexes with 2L![[thin space (1/6-em)]](https://www.rsc.org/images/entities/char_2009.gif) :
:![[thin space (1/6-em)]](https://www.rsc.org/images/entities/char_2009.gif) 1Cu(II) stoichiometry. Bis complexes are also formed with Cu(I) for all three ligands, although evidence for 1
1Cu(II) stoichiometry. Bis complexes are also formed with Cu(I) for all three ligands, although evidence for 1![[thin space (1/6-em)]](https://www.rsc.org/images/entities/char_2009.gif) :
:![[thin space (1/6-em)]](https://www.rsc.org/images/entities/char_2009.gif) 1 species with PyS and ThDfp is visible under conditions where the ligand is limiting (Fig. S4, ESI†).
1 species with PyS and ThDfp is visible under conditions where the ligand is limiting (Fig. S4, ESI†).
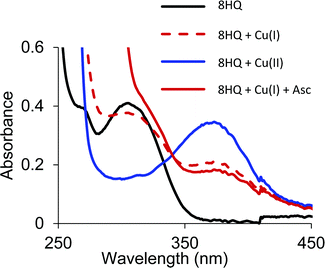
Similar to the O,S and O,O ligands, the O,N ligand (8HQ) in a pH 7.4 buffered solution showed a spectral band at 300 nm that shifted to 375 nm upon addition of half an equivalent Cu(II), indicating formation of the 2![[thin space (1/6-em)]](https://www.rsc.org/images/entities/char_2009.gif) :
:![[thin space (1/6-em)]](https://www.rsc.org/images/entities/char_2009.gif) 1 [Cu(8HQ)2] complex (Fig. 8). The addition of Cu(I) to a solution of 8HQ even in an anaerobic environment also showed a band at 375 nm, but at half the absorption intensity (Fig. 8). Cu(I) is not stable in aqueous solution and readily disproportionates into Cu(II) and Cu(0) if a Cu(I) stabilizing ligand is not present. The spectra in Fig. 8 demonstrate that 8HQ favors the disproportionation reaction by trapping Cu(II). Even the addition of ascorbic acid is not sufficient to reduce Cu(II) coordinated as the [Cu(8HQ)2] complex. Thus, O,S ligands are able to form Cu complexes in both oxidation states while the O,O and O,N ligands are unable to bind Cu(I).
1 [Cu(8HQ)2] complex (Fig. 8). The addition of Cu(I) to a solution of 8HQ even in an anaerobic environment also showed a band at 375 nm, but at half the absorption intensity (Fig. 8). Cu(I) is not stable in aqueous solution and readily disproportionates into Cu(II) and Cu(0) if a Cu(I) stabilizing ligand is not present. The spectra in Fig. 8 demonstrate that 8HQ favors the disproportionation reaction by trapping Cu(II). Even the addition of ascorbic acid is not sufficient to reduce Cu(II) coordinated as the [Cu(8HQ)2] complex. Thus, O,S ligands are able to form Cu complexes in both oxidation states while the O,O and O,N ligands are unable to bind Cu(I).
Binding affinities of select agents for Cu(II) and Cu(I)
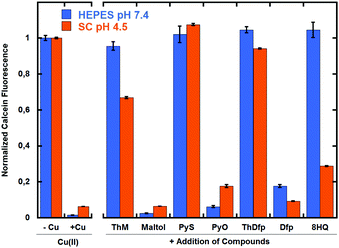
Because the antifungal growth assays against C. neoformans were done in SC medium at pH 4.5, we reasoned that pH-dependent differences in Cu(II) binding affinity could be a factor in differentiating the bioactivity of the ligands. To test this hypothesis, we used calcein as an indicator of relative binding strength to Cu(II) at pH 7.4 and pH 4.5. Addition of Cu(II) quenches calcein fluorescence under both sets of conditions; therefore, withdrawing Cu(II) from calcein by competitive chelation restores fluoresence. As shown in Fig. 9, PyS, ThM, and ThDfp were able to compete effectively for Cu(II) at both pH values. 8HQ, on the other hand, showed the largest pH dependence for Cu exchange with calcein among the ligands tested. Overall, the ability to bind Cu tightly enough seems to be a requirement for Cu-dependent fungicidal activity. Nevertheless, the criteria are not sufficient to predict fungicidal activity, as indicated by the fact that ThDfp shows the capacity to displace Cu(II) from calcein at low and high pH but does not inhibit fungal growth.In order to get a more quantitative assessment of the thermodynamic affinity of these ligands for Cu, conditional binding affinities were determined at pH 7.4 by competitive equilibrium titrations with the colorimetric indicators PAR (4-(2-pyridylazo)resorcinol) for Cu(II)33 and bicinchoninate anion (BCA) for Cu(I).34,35 The conditional Cu(II) binding affinities at pH 7.4 for select agents are shown in Table 2 and representative titrations are shown in Fig. S5 and S6 (ESI†). The data were best fit using a 2![[thin space (1/6-em)]](https://www.rsc.org/images/entities/char_2009.gif) :
:![[thin space (1/6-em)]](https://www.rsc.org/images/entities/char_2009.gif) 1 L
1 L![[thin space (1/6-em)]](https://www.rsc.org/images/entities/char_2009.gif) :
:![[thin space (1/6-em)]](https://www.rsc.org/images/entities/char_2009.gif) Cu(II) stoichiometry in all cases.
Cu(II) stoichiometry in all cases.
| Ligand | Cu(I) log![[thin space (1/6-em)]](https://www.rsc.org/images/entities/char_2009.gif) KML2 KML2 |
Cu(II) log![[thin space (1/6-em)]](https://www.rsc.org/images/entities/char_2009.gif) KML2 KML2 |
pCu(I) | pCu(II) |
|---|---|---|---|---|
| * Not detected.a R. M. Smith, A. E. Martell, and R. J. Motekaitis, 2007.b Lower limit. | ||||
| 8HQ | * | 22.9 ± 0.1a | * | 18.7 |
| PyS | 17.1 ± 0.2 | ≥20b | 12.9 | ≥15 |
| ThDfp | 16.4 ± 0.2 | ≥20b | 12.2 | ≥15 |
| ThM | 16.4 ± 0.1 | ≥20b | 12.2 | ≥15 |
| PyO | * | 13.8 ± 0.1 | * | 9.6 |
| Dfp | * | 15.3 ± 0.3 | * | 11.1 |
| Maltol | * | 12.2 ± 0.3 | * | 8.0 |
The O,S mixed donor ligands (PyS, ThDfp, and ThM) tested in competition with BCA all showed good affinity for Cu(I) with PyS giving the tightest value of log![[thin space (1/6-em)]](https://www.rsc.org/images/entities/char_2009.gif) KL2Cu(I) ∼17, as shown in Table 2. In contrast, the harder O,O, donor ligands (PyO, maltol, Dfp) did not compete for Cu(I) with either BCA or the weaker ferrozine (Fz), which forms a Cu(I) complex with an absorption centered at 470 nm (ε = 4320 M−1 cm−1) and a log
KL2Cu(I) ∼17, as shown in Table 2. In contrast, the harder O,O, donor ligands (PyO, maltol, Dfp) did not compete for Cu(I) with either BCA or the weaker ferrozine (Fz), which forms a Cu(I) complex with an absorption centered at 470 nm (ε = 4320 M−1 cm−1) and a log![[thin space (1/6-em)]](https://www.rsc.org/images/entities/char_2009.gif) KFz2Cu of 15.1.35 The absence of competition for Cu(I) from these indicators by PyO, Dfp and maltol reinforces the absence of any change in spectrum of the free ligands in the presence of Cu(I).
KFz2Cu of 15.1.35 The absence of competition for Cu(I) from these indicators by PyO, Dfp and maltol reinforces the absence of any change in spectrum of the free ligands in the presence of Cu(I).
Competition titrations against PAR showed that the O,S ligands quantitatively extracted Cu(II) away from the indicator, therefore the log![[thin space (1/6-em)]](https://www.rsc.org/images/entities/char_2009.gif) KML2 values ∼20 reported in Table 2 represent lower limits only. In contrast, the O,O ligands have weaker affinity for Cu(II), with apparent log
KML2 values ∼20 reported in Table 2 represent lower limits only. In contrast, the O,O ligands have weaker affinity for Cu(II), with apparent log![[thin space (1/6-em)]](https://www.rsc.org/images/entities/char_2009.gif) KML2 values ranging from 12–15 (Table 2). This difference in affinity for Cu(II) is consistent with the results from the calcein assay (Fig. 9).
KML2 values ranging from 12–15 (Table 2). This difference in affinity for Cu(II) is consistent with the results from the calcein assay (Fig. 9).
In order to compare the relative affinity of these agents for Cu(II) and Cu(I) to those of biologically relevant Cu trafficking proteins it is helpful to compare pCu values (−log[Cu]free) instead of stability constants that span different Cu![[thin space (1/6-em)]](https://www.rsc.org/images/entities/char_2009.gif) :
:![[thin space (1/6-em)]](https://www.rsc.org/images/entities/char_2009.gif) L stoichiometries. A pCu value reports the amount of uncomplexed Cu that would be available at defined conditions of pH 7.4 with total ligand and Cu concentrations of 10 μM and 1 μM, respectively. Values of pCu(II) for O,N donor ligand (8HQ) and O,S donor ligands (PyS, ThM and ThDfp) range from 15–19 (Table 2). In comparison, human serum albumin (HSA), a major Cu(II) carrier protein in the blood, has a pCu(II) of 12–13 depending on buffer conditions,36 which suggests that these ligands may be able to compete with blood proteins for Cu(II) binding.
L stoichiometries. A pCu value reports the amount of uncomplexed Cu that would be available at defined conditions of pH 7.4 with total ligand and Cu concentrations of 10 μM and 1 μM, respectively. Values of pCu(II) for O,N donor ligand (8HQ) and O,S donor ligands (PyS, ThM and ThDfp) range from 15–19 (Table 2). In comparison, human serum albumin (HSA), a major Cu(II) carrier protein in the blood, has a pCu(II) of 12–13 depending on buffer conditions,36 which suggests that these ligands may be able to compete with blood proteins for Cu(II) binding.
For Cu(I), values of pCu for O,S donor ligands (PyS, ThM and ThDfp) range from 16–17, while the O,O donor ligands (PyO, maltol, Dfp) and O,N donor ligand (8HQ) show no measurable affinity for Cu(I). To put these values in context, the extracellular domain of the mammalian Cu transport protein Ctr1 is predicted to have pCu(I) ∼11, whereas intracellular copper chaperones and cuproenzymes have aM–fM affinity, putting their PCu(I) values in the 16–19 range.34,37 These pCu comparisons suggest that while PyS, ThDfp, and ThM could retain Cu as CuL2 complexes of either Cu(II) or Cu(I) extracellularly, they are unlikely to remain complexed inside the reducing environment of the cell where high affinity Cu(I) proteins are likely to compete for binding.
The weaker affinity of O,O ligands for Cu(II) relative to their O,S counterpart suggests a possible reason for their lack of Cu-dependent antifungal activity. Differences in O,S ligands’ antifungal activity cannot be attributed solely to differences in their Cu(I) and Cu(II) binding abilities at pH 7.4, however, as ThDfp's Cu(I) and Cu(II) binding affinities are comparable to those of PyS and ThM, but ThDfp does not show Cu-dependent antifungal activity while PyS and ThM do. These results suggest other properties, in addition to binding affinity, as determinants of antifungal activity.
Lipophilicity of ligands and Cu(II) complexes
The ability of a molecule to penetrate into a biological membrane is related to its lipophilicity. The n-octanol/water partition coefficient (P) is a quantitative indicator of this property. Whereas P describes the partition coefficient of an un-ionized solute, a distribution coefficient (D) takes into account the ionization state of the compound at the given pH and thus is more appropriate here as molecules and complexes may be ionized. Log![[thin space (1/6-em)]](https://www.rsc.org/images/entities/char_2009.gif) D values for the ligands and their CuIIL2 complexes were measured by partitioning these compounds between n-octanol and 0.01 M Hepes buffer, pH 7.4 using a traditional shake flask method with UV-visible spectroscopy to determine compound concentrations in each phase. A positive log
D values for the ligands and their CuIIL2 complexes were measured by partitioning these compounds between n-octanol and 0.01 M Hepes buffer, pH 7.4 using a traditional shake flask method with UV-visible spectroscopy to determine compound concentrations in each phase. A positive log![[thin space (1/6-em)]](https://www.rsc.org/images/entities/char_2009.gif) D value indicates that the compound has a higher concentration in the octanol phase relative to the aqueous phase (hydrophobic). Conversely, a negative log
D value indicates that the compound has a higher concentration in the octanol phase relative to the aqueous phase (hydrophobic). Conversely, a negative log![[thin space (1/6-em)]](https://www.rsc.org/images/entities/char_2009.gif) D indicates hydrophilicity, or preference to partition in the aqueous phase.
D indicates hydrophilicity, or preference to partition in the aqueous phase.
Partition coefficients for several of the ligands shown in Table 3 have been previously determined;38–41 however, inconsistencies in reported values prompted us to reexamine them. For instance, empirically determined values of log![[thin space (1/6-em)]](https://www.rsc.org/images/entities/char_2009.gif) P for ThM at pH 7.4 are reported as both 0.54 and 1.36,40,41 whereas computationally determined log
P for ThM at pH 7.4 are reported as both 0.54 and 1.36,40,41 whereas computationally determined log![[thin space (1/6-em)]](https://www.rsc.org/images/entities/char_2009.gif) P values for ThM vary depending on the software package used. Furthermore, we found that the distribution of the compounds in these phases shifted significantly as a result of metal complexation, but such shifts were poorly predicted by computational approaches, necessitating experimental measurements of each ligand and its Cu(II) complex under identical conditions. This work appears to be the first report of experimentally determined partition coefficient of [CuIIL2] complexes of ThM, PyS, ThDfp, Maltol, PyO, and Dfp.
P values for ThM vary depending on the software package used. Furthermore, we found that the distribution of the compounds in these phases shifted significantly as a result of metal complexation, but such shifts were poorly predicted by computational approaches, necessitating experimental measurements of each ligand and its Cu(II) complex under identical conditions. This work appears to be the first report of experimentally determined partition coefficient of [CuIIL2] complexes of ThM, PyS, ThDfp, Maltol, PyO, and Dfp.
![[thin space (1/6-em)]](https://www.rsc.org/images/entities/char_2009.gif) D) measured at pH 7.4 of ligands L and their bis Cu(II) complexes CuL2. Compounds highlighted in bold were also found to have fungicidal activity (see Table 1). Conditions: aqueous phase: 0.01 M Hepes, pH 7.4; organic phase, n-octanol; for [CuIIL2] calculations: 200 μM ligands and 100 μM CuSO4; for ligand calculations: 200 μM ligand
D) measured at pH 7.4 of ligands L and their bis Cu(II) complexes CuL2. Compounds highlighted in bold were also found to have fungicidal activity (see Table 1). Conditions: aqueous phase: 0.01 M Hepes, pH 7.4; organic phase, n-octanol; for [CuIIL2] calculations: 200 μM ligands and 100 μM CuSO4; for ligand calculations: 200 μM ligand
Log![[thin space (1/6-em)]](https://www.rsc.org/images/entities/char_2009.gif) D D |
||
|---|---|---|
| L | CuL2 | |
| 8HQ | 2.2 | 1.6 |
| PyS | −1.8 | 1.6 |
| ThM | 1.4 | 1 |
| Maltol | 0.2 | −0.1 |
| ThDfp | 0.1 | −0.2 |
| PyO | −1.8 | −0.3 |
| Dfp | −0.8 | −1.2 |
As shown in Table 3, the log![[thin space (1/6-em)]](https://www.rsc.org/images/entities/char_2009.gif) D values across this set of bidentate O,O, O,S, and O,N chelating agents span from hydrophilic for PyS, PyO (both −1.8) and Dfp (−0.8), to hydrophobic for 8HQ (2.2), ThM (1.4), maltol and ThDfp (0.2 and 0.1, respectively). These values can shift significantly in the presence of Cu(II). In some cases, the complexes are less hydrophobic than their free ligands (8HQ, ThM), whereas others become more hydrophobic (PyS), and yet others remain or become hydrophilic (maltol, ThDfp, PyO, Dfp).
D values across this set of bidentate O,O, O,S, and O,N chelating agents span from hydrophilic for PyS, PyO (both −1.8) and Dfp (−0.8), to hydrophobic for 8HQ (2.2), ThM (1.4), maltol and ThDfp (0.2 and 0.1, respectively). These values can shift significantly in the presence of Cu(II). In some cases, the complexes are less hydrophobic than their free ligands (8HQ, ThM), whereas others become more hydrophobic (PyS), and yet others remain or become hydrophilic (maltol, ThDfp, PyO, Dfp).
The most striking feature apparent from a comparison of the data in Table 3 is the correlation between lipophilicity of the CuL2 complexes and their bioactivity to inhibit fungal growth. The ligands that form lipophilic Cu(II) complexes with positive log![[thin space (1/6-em)]](https://www.rsc.org/images/entities/char_2009.gif) D values of 1–1.6 for [CuIIL2] are also the ones that inhibit fungal growth in a Cu-dependent manner and recover growth of the ctr1Δctr4Δ mutant, i.e. 8HQ, PyS, and ThM. In contrast, agents that failed to inhibit fungal growth all have negative log
D values of 1–1.6 for [CuIIL2] are also the ones that inhibit fungal growth in a Cu-dependent manner and recover growth of the ctr1Δctr4Δ mutant, i.e. 8HQ, PyS, and ThM. In contrast, agents that failed to inhibit fungal growth all have negative log![[thin space (1/6-em)]](https://www.rsc.org/images/entities/char_2009.gif) D values indicative of hydrophilic complexes: this set includes the O,O ligands maltol, PyO and Dfp as well as the O,S ligand ThDfp. This same set of agents also failed to recover growth of the ctr1Δctr4Δ mutant. Together, these results suggest that the ligands’ ability to form lipophilic CuIIL2 complexes allows them to penetrate the fungal cell membrane to exert their antifungal activity. Conversely, hydrophilic Cu(II) complexes apparently do not gain access inside the cell. Importantly, the predictor of this bioactivity is not the hydrophobic property of the organic ligand alone, but rather of its complex with Cu(II).
D values indicative of hydrophilic complexes: this set includes the O,O ligands maltol, PyO and Dfp as well as the O,S ligand ThDfp. This same set of agents also failed to recover growth of the ctr1Δctr4Δ mutant. Together, these results suggest that the ligands’ ability to form lipophilic CuIIL2 complexes allows them to penetrate the fungal cell membrane to exert their antifungal activity. Conversely, hydrophilic Cu(II) complexes apparently do not gain access inside the cell. Importantly, the predictor of this bioactivity is not the hydrophobic property of the organic ligand alone, but rather of its complex with Cu(II).
Metal content of fungal cells treated with copper chelators
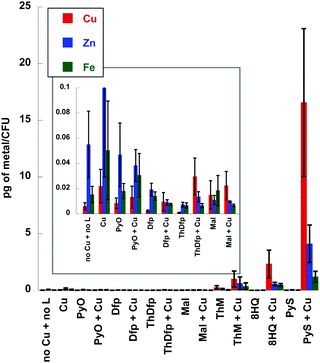
The ctr1Δctr4Δ mutant experiment (Fig. 6) together with the assessment of lipophilicity suggest that the Cu-dependent fungicidal activity depends on delivering, or partitioning, Cu across the membrane. To further probe this hypothesis, we used inductively coupled mass-spectrometry (ICP-MS) to determine cell-associated metal content of C. neoformans cells after 1 h incubation with or without 10 μM of each ligand and with or without 10 μM supplemental CuSO4. Fig. 10 displays the results for total Cu, Fe and Zn measured as a function of treatment condition (control, ligand alone, or ligand plus Cu). The addition of 10 μM Cu to the growth medium resulted in slightly higher levels not just of Cu, but also cell-associated Fe and Zn, compared to the media-only control. This observation is consistent with the notion that metallomes of individual metals are interdependent, such that supplementation with one metal influences the status of others. The most striking feature of the data is the hyper accumulation of Cu, Zn, and Fe observed when Pys, ThM, and 8HQ were co-incubated with Cu. Metal accumulation did not occur when the cells are treated with these agents alone, suggesting that they do not directly transport and hyper-accumulate residual Fe and Zn into the cell. Therefore, we hypothesize that the increased accumulation of Cu, Zn and Fe levels is a consequence of direct Cu influx facilitated exclusively by those chelators that form lipophilic Cu(II) complexes (8HQ, PyS, ThM) with the supplemental Cu added to the growth medium. In other words, these agents serve as ionophores for Cu, with Zn and Fe levels being subsequently affected by cellular Cu status. Interestingly, these are the same agents that elicit Cu-dependent antifungal activity. Agents that did not elicit antifungal activity (PyO, Dfp, ThDfp, maltol) did not dramatically alter cellular metal content in the presence of Cu, although Dfp and ThDfp did show decreased cellular metal content compared to the other conditions, suggesting extracellular metal sequestration. Regardless of the diminished metal content, the effect of Dfp and ThDfp is not sufficient to limit growth, at least not under the conditions and incubation times explored in this study.Together, the metal accumulation studies support the notion that disturbing the metal balance of fungal cells by chelator-induced hyper accumulation of Cu induces fungal toxicity.
Conclusions
In an effort to understand the requirements needed to pharmacologically manipulate metals in C. neoformans to inhibit growth, we screened a panel of metal chelators for antifungal activity against C. neoformans. We found that chelators that sequester Fe or Cu have limited effects on growth in liquid culture, whereas small molecules with ionophoric ability to increase intracellular Cu are fungicidal. These agents (8HQ, ThM, PyS and DSF) also share an ability to overcome the growth defect of a ctr1Δ/ctr4Δ mutant that lacks its native Cu importer proteins, and induce significant increases in the total cellular content of Zn and Fe, in addition to Cu. In terms of chemical properties, the active agents share a high affinity for Cu(II) and form lipophilic Cu(II)L2 complexes. Importantly, it is the lipophilic property of the complexes that predicts bioactivity, not the lipophilicity of the organic ligand itself. While these observations do not yet address the mechanism by which these agents in combination with Cu exert fungal toxicity, they do support the notion that mobilizing Cu with small molecules endowed with appropriate chemical properties can provide a powerful strategy to fight C. neoformans, and likely other, infectious microbes.Experimental
Materials
Chemicals and solvents were obtained from Sigma-Aldrich and used as received unless otherwise noted. Sources for all compounds used in the biological screen are listed in Table S1 (ESI†). All solvents were reagent grade.Strains and media
Two strains of C. neoformans H99 were generously provided by the Thiele lab of Duke University for this study: wild type (WT, H99) and a double copper transporter knockout strain, ctr1Δ ctr4Δ (genotype ctr1::NAT;ctr4::NEO). Strains were streaked onto solid synthetic complete medium (SC, MP Biomedicals) from frozen glycerol stocks stored at −80 °C. For experiments one colony was picked and grown in an overnight culture of SC medium at 30 °C. Overnight cultures were diluted, washed or aliquoted as appropriate for the experimental protocol, as described below.Growth curves and fungicidal assays
A broth micro-dilution method described in Clinical and Laboratory Standards Institute (CLSI)42 was used to determine the susceptibility of C. neoformans to various test compounds, with minor modifications. Briefly, C. neoformans cultures in liquid SC medium were inoculated from a single colony grown on solid SC medium and incubated overnight at 30 °C with shaking at 200 rpm. Cell suspensions were diluted to OD600 0.002 with fresh SC medium and aliquoted into 96-well plates to a final OD600 of 0.001. Test compounds were added from DMSO stock solutions to final concentrations ranging from 0–100 μM, with <1% DMSO. For each test run, a compound-free positive growth control and a cell-free, negative control were included. For experiments using added metal salts, fresh stock solutions of Cu(II), Zn(II), Fe(III), and Ag(I) were prepared in deionized water by using CuSO4, ZnCl2, ferric ammonium citrate, and AgNO3 and added to appropriate wells at final concentrations as indicated in figure legends. 96-well plates were incubated at 30 °C and read every 4–6 h for 48 h. Dose response curves were generated by plotting OD600 readings vs. compound concentration. The Minimal Inhibitory Concentration (MIC) was defined for each tested compound as the lowest concentration of compound at which growth was not detected compared to the positive control. All tests were performed in triplicate for each condition in a single experiment, and two separate experiments were carried out. For a single experiment, each of the three replicate conditions were averaged and the error was calculated as standard deviation (SD).Fungicidal assays were initiated in 96-well plates by following the procedure described above for the growth curve assay for WT C. neoformans in SC medium. Aliquots of cell suspensions were removed after 24 h, diluted and plated on solid SC medium. The number of colonies on each plate for each condition were counted after incubating the plates at 30 °C for 48 h. All tests were performed in triplicate for each condition in a single experiment, and three separate experiments were carried out. Error was calculated by averaging the three separate experiments as standard error of mean (SEM).
Ctr1Δctr4Δ and WT growth curves
Overnight cultures of WT and ctr1Δctr4Δ in SC medium were washed three times with PBS, pH 7.4 and resuspended in YPEG medium (BD, Franklin Lakes, NJ). Cell suspensions were diluted to OD600nm 0.001 with fresh YPEG medium and WT aliquoted in top half of 96 well plate and ctr1Δctr4Δ in the bottom half. Test compounds were added from DMSO stock solutions to final concentrations ranging from 0–100 μM, with <1% DMSO. For each test run, a compound-free positive growth control and a cell-free, negative control were included. For the WT compound-free positive normal growth should occur in this medium while the ctr1Δctr4Δ is unable to grow in YPEG medium. Plates were incubated at 30 °C and OD600 recorded at 24 h and 48 h. The percent growth plots were generated by plotting the OD600 readings at 48 h for each treatment condition normalized against WT compound-free positive growth condition. All tests were performed in triplicate for each condition in a single experiment, and two separate experiments were carried out. For a single experiment, each of the three replicate conditions were averaged and the error was calculated as standard deviation (SD).Determination of Cu(II) and Cu(I) conditional binding constants
Cu(II) stock solutions were prepared either from solid CuSO4·5H2O dissolved in ddH2O or CuCl2 dissolved in acetonitrile to give 100 mM solutions, which were both standardized with 0.0500 M EDTA to a murexide endpoint in ammonia buffer. All ligand stock solutions were prepared in DMSO. Experiments involving Cu(II) were performed aerobically.For Cu(I) binding studies, reaction buffers were prepared in thoroughly deoxygenated Milli-Q water and stored in an anaerobic glove box (O2 <0.5 ppm). The Cu(I) stock solution was prepared by dissolving [Cu(CH3CN)4]PF6 (Sigma) in deoxygenated acetonitrile. The concentration of the Cu(I) stock solution was determined in the glove box by titrating into a solution of excess bicinchoninic acid (BCA) in deoxygenated 0.01 M Hepes buffer, pH 7.4, while monitoring the absorbance of [CuI(BCA)2]3− at 562 nm (ε = 7900 M−1 cm−1).43 The Cu(I) binding studies were done in de-oxygenated Britton–Robinson/universal buffer (0.04 M H3BO4, 0.04 M H3PO4, and 0.04 M CH3CO2H) at pH 7.4 in the glove box. All ligands were prepared and stored anaerobically in the glove box by dissolving each ligand in deoxygenated DMSO to 100 mM.
To determine Cu(II) binding constants, the indicator PAR (4-(2-pyridylazo)resorcinol) was used which forms a colored 1![[thin space (1/6-em)]](https://www.rsc.org/images/entities/char_2009.gif) :
:![[thin space (1/6-em)]](https://www.rsc.org/images/entities/char_2009.gif) 1 complex with Cu(II) (A500nm, ε = 37
1 complex with Cu(II) (A500nm, ε = 37![[thin space (1/6-em)]](https://www.rsc.org/images/entities/char_2009.gif) 000 M−1) with a conditional dissociation constant for Cu(II) at pH 7.4 of 2.6 × 10⁻¹⁵ M.33 A 20 mM stock solution of PAR was prepared in DMSO and portions were diluted into the working buffer with equimolar CuSO4 to make 1 mL solutions of 5–20 μM PAR–Cu complex into which test ligands were titrated. After each aliquot of ligand, the solution was allowed to equilibrate until no further spectral changes were observed. The loss of absorbance of PAR–Cu complex at 500 nm upon ligand addition indicated the exchange equilibrium expressed in eqn (1) and (2). Stability constants were obtained by nonlinear least-squares fitting of the UV-vis traces over the 350–700 nm range using Specfit software according to the model shown in Table 4.44 The calculated binding affinities in Table 2 are the averages and standard deviations from triplicate titrations for each ligand.
000 M−1) with a conditional dissociation constant for Cu(II) at pH 7.4 of 2.6 × 10⁻¹⁵ M.33 A 20 mM stock solution of PAR was prepared in DMSO and portions were diluted into the working buffer with equimolar CuSO4 to make 1 mL solutions of 5–20 μM PAR–Cu complex into which test ligands were titrated. After each aliquot of ligand, the solution was allowed to equilibrate until no further spectral changes were observed. The loss of absorbance of PAR–Cu complex at 500 nm upon ligand addition indicated the exchange equilibrium expressed in eqn (1) and (2). Stability constants were obtained by nonlinear least-squares fitting of the UV-vis traces over the 350–700 nm range using Specfit software according to the model shown in Table 4.44 The calculated binding affinities in Table 2 are the averages and standard deviations from triplicate titrations for each ligand.
 | (1) |
 | (2) |
| Species | Log![[thin space (1/6-em)]](https://www.rsc.org/images/entities/char_2009.gif) K K |
Cu | PAR | L | H | |
|---|---|---|---|---|---|---|
| m | l | l | h | |||
| CuL2 | 1 | 0 | 2 | 0 | Refined | |
| CuPAR | 14.58 | 1 | 1 | 0 | 0 | Constant |
| PAR | — | 0 | 1 | 0 | 0 | Constant |
| L | — | 0 | 0 | 1 | 0 | Constant |
| Cu | — | 1 | 0 | 0 | 0 | Constant |
The conditional Cu(I) binding constants of PyS, ThM, and ThDfp were determined by competition equilibrium titrations with BCA in universal buffer, pH 7.4 with 5% DMSO. Excess ligand was used to ensure only the 1![[thin space (1/6-em)]](https://www.rsc.org/images/entities/char_2009.gif) :
:![[thin space (1/6-em)]](https://www.rsc.org/images/entities/char_2009.gif) 2 Cu
2 Cu![[thin space (1/6-em)]](https://www.rsc.org/images/entities/char_2009.gif) :
:![[thin space (1/6-em)]](https://www.rsc.org/images/entities/char_2009.gif) ligand complex forms. Samples containing 2 mL solutions of 125 μM BCA and 50 μM ([Cu(CH3CN)4]PF6) were titrated under anaerobic conditions with at least 20 equivalents of test ligand. After each aliquot, the solution was allowed to equilibrate until no further spectral changes were observed. The decrease in 562 nm band [CuI(BCA)2]3− after addition of aliquots of ligand indicated an exchange of Cu(I) from BCA to ligand (eqn (3) and (4)). UV-vis spectra collected from 400 nm to 800 nm were fit by nonlinear least-squares fitting in Specfit according to the model shown in Table 5.44 In order to provide wavelength dependent molar absorptivities for light-absorbing species in solution, reference spectra for the ligand alone, bis-Cu(I) complex of the ligand, indicator alone, and bis-Cu(I) indicator complex were acquired. The calculated binding affinities in Table 2 are the averages and standard deviations from triplicate titrations for each ligand.
ligand complex forms. Samples containing 2 mL solutions of 125 μM BCA and 50 μM ([Cu(CH3CN)4]PF6) were titrated under anaerobic conditions with at least 20 equivalents of test ligand. After each aliquot, the solution was allowed to equilibrate until no further spectral changes were observed. The decrease in 562 nm band [CuI(BCA)2]3− after addition of aliquots of ligand indicated an exchange of Cu(I) from BCA to ligand (eqn (3) and (4)). UV-vis spectra collected from 400 nm to 800 nm were fit by nonlinear least-squares fitting in Specfit according to the model shown in Table 5.44 In order to provide wavelength dependent molar absorptivities for light-absorbing species in solution, reference spectra for the ligand alone, bis-Cu(I) complex of the ligand, indicator alone, and bis-Cu(I) indicator complex were acquired. The calculated binding affinities in Table 2 are the averages and standard deviations from triplicate titrations for each ligand.
 | (3) |
 | (4) |
| Species | Log![[thin space (1/6-em)]](https://www.rsc.org/images/entities/char_2009.gif) K K |
Cu | BCA | Ligand | H | |
|---|---|---|---|---|---|---|
| m | l | l | h | |||
| [CuIL2]+ | — | 1 | 0 | 2 | 0 | Refined |
| [CuI(BCA)2]3− | 17.745 | 1 | 2 | 0 | 0 | Constant |
| BCA | — | 0 | 1 | 0 | 0 | Constant |
| L | — | 0 | 0 | 1 | 0 | Constant |
| Cu | 0 | 1 | 0 | 0 | 0 | Constant |
Partition coefficient by shake flask method
At least three shake flask experiments were done for each ligand and each Cu–ligand complex. For the free ligands, 200 μM solutions were prepared in either n-octanol or 0.1 M Hepes, pH 7.4 from 100 mM DMSO stock solutions, depending on solubility. For the complexes, [CuII(Mal)2], [CuII(PyO)2], [CuII(ThDfp)2], and [CuII(Dfp)2] were prepared in 0.01 M Hepes, pH 7.4 from CuSO4 and ligand stock solutions to give final concentrations of 100 and 200 μM, respectively. Solutions of [Cu(8HQ)2], [Cu(PyS)2] and [Cu(ThM)2] were prepared similarly, but in n-octanol. Initial concentrations of the ligand and CuL2 complexes were determined by UV-visible absorption spectroscopy using the extinctions coefficients in Table S2 (ESI†). 4 mL portions of each test solution was mixed in a 15 mL centrifuge tube with 4 mL of the opposing phase, either n-octanol or 0.1 M Hepes, pH 7.4, and the mixtures were shaken for 3 h on a 360° rotation device to prevent emulsion formation. The tubes were then centrifuged for 3 min at 5000 rpm to separate the phases, and 1.5 mL aliquots from each phase were carefully removed by syringe to measure the UV-visible spectra, from which concentration in each phase was calculated. The distribution coefficient was calculated according to eqn (5) and (6): | (5) |
 | (6) |
Calcein assay
The calcein assay was performed in 96-well plates with fluorescence measured at λex = 480 nm (λem = 520 nm) using a Perkin-Elmer Victor 3 plate reader. Error bars represent the standard deviation of triplicate measurements. Fluoresence was normalized to calcein fluorescence in the absence of added Cu(II).Metal content analysis
Overnight cultures of C. neoformans were diluted to OD600 0.2 and incubated at 30 °C shaking at 200 rpm for 3 h. Portions of 5 mL of these cultures were treated with 10 μM ligand (PyS, PyO, Mal, ThM, Dfp, ThDfp or 8HQ) with and without 10 μM CuSO4 and incubated for an additional 1 h at 30 °C while shaking at 200 rpm. The samples were then transferred to pre-weighed acid-washed Teflon tubes and centrifuged to form cell pellets that were washed twice with 1 mM EDTA in ddH2O, then washed once with phosphate buffer saline (PBS), and resuspended in 1 mL of PBS buffer. A 100 μL aliquot was removed, diluted in SC medium, and plated on SC agar plates to determine CFUs. The remaining cell suspension was pelleted, air dried, then digested in neat trace metal grade nitric acid (Fischer Scientific, Pittsburg, PA) overnight and heated for 30 min at 80 °C. The acid solution was cooled and diluted with ultra pure laboratory grade water. Kim Hutchison (Department of Soil Science, North Carolina State University) performed metal content analysis on a Varian 820 ICP-MS. The following isotopes were utilized for data collection: 63Cu (monitored 65Cu), 56Fe, pooled 42,43,44Ca, and pooled 66,67,68Zn. The collected data were normalized to a non-analyte internal standard (89Y) in order to correct for small differences due to instrument drift and sample versus standard matrices. A laboratory check standard of a different stock was prepared and used to verify the calibration standard solution. A continuing laboratory standard was analyzed every 12 samples, and the calibration curve was repeated if the laboratory standard was off by 10% or more. All experiments were performed at least 4 times, and the mean and standard error of mean (S. E. M.) are reported.Acknowledgements
We thank Prof. Daniel Rabinovich (UNC Charlotte, Charlotte, NC) for providing small molecules (17, 18, 23, 25) to test and Prof. Dennis Thiele (Duke University, Durham, NC) for providing two strains of C. neoformans (WT and ctr1Δctr4Δ). We thank the NIH for supporting this work (GM084176) and (T32GM007105). This material is based on work supported by the National Science Foundation Graduate Research Fellowship Program to S. Z. A. R. under Grant no. (DGF 1106401).Notes and references
- E. Sionov, H. Lee, Y. C. Chang and K. J. Kwon-Chung, PLoS Pathog., 2010, 6, e1000848 Search PubMed.
- M. A. Pfaller and D. J. Diekema, Clin. Microbiol. Rev., 2007, 20, 133–163 CrossRef CAS PubMed.
- B. J. Park, K. A. Wannemuehler, B. J. Marston, N. Govender, P. G. Pappas and T. M. Chiller, AIDS, 2009, 23, 525–530 CrossRef PubMed.
- J. W. Kronstad, R. Attarian, B. Cadieux, J. Choi, C. A. D'Souza, E. J. Griffiths, J. M. H. Geddes, G. Hu, W. H. Jung, M. Kretschmer, S. Saikia and J. Wang, Nat. Rev. Microbiol., 2011, 9, 193–203 CrossRef CAS PubMed.
- A. Loyse, F. Dromer, J. Day, O. Lortholary and T. S. Harrison, J. Antimicrob. Chemother., 2013, 68, 2435–2444 CrossRef CAS PubMed.
- T. Roemer and D. J. Krysan, Cold Spring Harbor Perspect. Med., 2014, 4, a019703 CrossRef PubMed.
- C. Ding, R. A. Festa, T.-S. Sun and Z.-Y. Wang, Mol. Microbiol., 2014, 93, 10–23 CrossRef CAS PubMed.
- M. R. Raja, S. R. Waterman, J. Qiu, R. Bleher, P. R. Williamson and T. V. O'Halloran, Metallomics, 2013, 5, 363–371 RSC.
- S. García-Santamarina and D. J. Thiele, J. Biol. Chem., 2015, 290, 18945–18953 CrossRef PubMed.
- W. H. Jung, G. Hu, W. Kuo and J. W. Kronstad, Eukaryotic Cell, 2009, 8, 1511–1520 CrossRef CAS PubMed.
- W. H. Jung, A. Sham, T. Lian, A. Singh, D. J. Kosman and J. W. Kronstad, PLoS Pathog., 2008, 4, e45 Search PubMed.
- W. H. Jung, A. Sham, R. White and J. W. Kronstad, PLoS Biol., 2006, 4, e410 Search PubMed.
- J. Kronstad, S. Saikia, E. D. Nielson, M. Kretschmer, W. Jung, G. Hu, J. M. H. Geddes, E. J. Griffiths, J. Choi, B. Cadieux, M. Caza and R. Attarian, Eukaryotic Cell, 2012, 11, 109–118 CrossRef CAS PubMed.
- C. Ding, J. Yin, E. M. M. Tovar, D. A. Fitzpatrick, D. G. Higgins and D. J. Thiele, Mol. Microbiol., 2011, 81, 1560–1576 CrossRef CAS PubMed.
- M. I. Samanovic, C. Ding, D. J. Thiele and K. H. Darwin, Cell Host Microbe, 2012, 11, 106–115 CAS.
- S. D. Salas, J. E. Bennett, K. J. Kwon-Chung, J. R. Perfect and P. R. Williamson, J. Exp. Med., 1996, 184, 377–386 CrossRef CAS PubMed.
- F. J. Walton, A. Idnurm and J. Heitman, Mol. Microbiol., 2005, 57, 1381–1396 CrossRef CAS PubMed.
- N. Ramanan and Y. Wang, Science, 2000, 288, 1062–1064 CrossRef CAS PubMed.
- C. Ding, R. A. Festa, Y.-L. Chen, A. Espart, S. Palacios, J. Espín, M. Capdevila, S. Atrian, J. Heitman and D. J. Thiele, Cell Host Microbe, 2013, 13, 265–276 CAS.
- T.-S. Sun, X. Ju, H.-L. Gao, T. Wang, D. J. Thiele, J.-Y. Li, Z.-Y. Wang and C. Ding, Nat. Commun., 2014, 5, 5550 CrossRef CAS PubMed.
- R. A. Festa, M. E. Helsel, K. J. Franz and D. J. Thiele, Chem. Biol., 2014, 21, 977–987 CrossRef CAS PubMed.
- N. L. Reeder, J. Kaplan, J. Xu, R. S. Youngquist, J. Wallace, P. Hu, K. D. Juhlin, J. R. Schwartz, R. A. Grant, A. Fieno, S. Nemeth, T. Reichling, J. P. Tiesman, T. Mills, M. Steinke, S. L. Wang and C. W. Saunders, Antimicrob. Agents Chemother., 2011, 55, 5753–5760 CrossRef CAS PubMed.
- S. S. Block, J. Agric. Food Chem., 1955, 3, 229–234 CrossRef CAS.
- R. Musiol, M. Serda, S. Hensel-Bielowka and J. Polanski, Curr. Med. Chem., 2010, 17, 1960–1973 CrossRef CAS PubMed.
- Z. E. Sauna, S. Shukla and S. V. Ambudkar, Mol. BioSyst., 2005, 1, 127–134 RSC.
- D. Cen, D. Brayton, B. Shahandeh, F. L. Meyskens and P. J. Farmer, J. Med. Chem., 2004, 47, 6914–6920 CrossRef CAS PubMed.
- S. M. Monti, A. Maresca, F. Viparelli, F. Carta, G. D. Simone, F. A. Mühlschlegel, A. Scozzafava and C. T. Supuran, Bioorg. Med. Chem. Lett., 2012, 22, 859–862 CrossRef CAS PubMed.
- C. S. I. Nobel, M. Kimland, B. Lind, S. Orrenius and A. F. G. Slater, J. Biol. Chem., 1995, 270, 26202–26208 CrossRef CAS PubMed.
- J. A. Lewis, B. L. Tran, D. T. Puerta, E. M. Rumberger, D. N. Hendrickson and S. M. Cohen, Dalton Trans., 2005, 2588–2596 RSC.
- J. A. Lewis, D. T. Puerta and S. M. Cohen, Inorg. Chem., 2003, 42, 7455–7459 CrossRef CAS PubMed.
- M. Backlund, J. Ziller and P. J. Farmer, Inorg. Chem., 2008, 47, 2864–2870 CrossRef CAS PubMed.
- K. H. Thompson, C. A. Barta and C. Orvig, Chem. Soc. Rev., 2006, 35, 545–556 RSC.
- J. P. Crow, J. B. Sampson, Y. Zhuang, J. A. Thompson and J. S. Beckman, J. Neurochem., 1997, 69, 1936–1944 CrossRef CAS PubMed.
- Z. Xiao, J. Brose, S. Schimo, S. M. Ackland, S. La Fontaine and A. G. Wedd, J. Biol. Chem., 2011, 286, 11047–11055 CrossRef CAS PubMed.
- Z. Xiao, L. Gottschlich, R. van der Meulen, S. R. Udagedara and A. G. Wedd, Metallomics, 2013, 5, 501–513 RSC.
- M. Rózga, M. Sokołowska, A. Protas and W. Bal, JBIC, J. Biol. Inorg. Chem., 2007, 12, 913–918 CrossRef PubMed.
- L. Banci, I. Bertini, S. Ciofi-Baffoni, T. Kozyreva, K. Zovo and P. Palumaa, Nature, 2010, 465, 645–648 CrossRef CAS PubMed.
- S. M. Kaiser and B. I. Escher, Environ. Sci. Technol., 2006, 40, 1784–1791 CrossRef CAS PubMed.
- E. A. Enyedy, D. Hollender and T. Kiss, J. Pharm. Biomed. Anal., 2011, 54, 1073–1081 CrossRef CAS PubMed.
- S. Chaves, R. Jelic, C. Mendonca, M. Carrasco, Y. Yoshikawa, H. Sakurai and M. A. Santos, Metallomics, 2010, 2, 220–227 RSC.
- E. A. Enyedy, O. Domotor, E. Varga, T. Kiss, R. Trondl, C. G. Hartinger and B. K. Keppler, J. Inorg. Biochem., 2012, 117, 189–197 CrossRef CAS PubMed.
- P. A. Adlard, R. A. Cherny, D. I. Finkelstein, E. Gautier, E. Robb, M. Cortes, I. Volitakis, X. Liu, J. P. Smith, K. Perez, K. Laughton, Q.-X. Li, S. A. Charman, J. A. Nicolazzo, S. Wilkins, K. Deleva, T. Lynch, G. Kok, C. W. Ritchie, R. E. Tanzi, R. Cappai, C. L. Masters, K. J. Barnham and A. I. Bush, Neuron, 2008, 59, 43–55 CrossRef CAS PubMed.
- Z. Xiao and A. G. Wedd, Nat. Prod. Rep., 2010, 27, 768–789 RSC.
- SpecFit/32 Version 3.0.35 Global Analysis Fitting Software, Spectrum Software Associates, Marlborough, MA, 2001 Search PubMed.
- P. Bagchi, M. T. Morgan, J. Bacsa and C. J. Fahrni, J. Am. Chem. Soc., 2013, 135, 18549–18559 CrossRef CAS PubMed.
Footnote |
| † Electronic supplementary information (ESI) available. See DOI: 10.1039/c6mt00172f |
| This journal is © The Royal Society of Chemistry 2017 |

