Effect of the magnetic core of (MnFe)2O3@Ta2O5 nanoparticles on photocatalytic hydrogen production
Krishnappa
Manjunath
ab,
Virgínia S.
Souza
b,
Nagaraju
Ganganagappa
c,
Jackson D.
Scholten
b,
Sérgio R.
Teixeira
d,
Jairton
Dupont
*e and
Ramakrishnappa
Thippeswamy
*af
aCentre for Nano and Material Sciences, Jain University, Jain Global Campus, Jakkasandra(p), Kanakapura Road, Bangalore-562112, India. E-mail: swadheshi26@gmail.com
bLaboratory of Molecular Catalysis, Institute of Chemistry, UFRGS, Porto Alegre, Brazil
cDepartment of Chemistry, Siddaganga Institute of Technology (SIT), Tumkur, Karnataka, India
dLaboratory of Thin Films and Nanostructure Fabrication, Institute of Physics, UFRGS, Porto Alegre, Brazil
eSchool of Chemistry, University of Nottingham, UK. E-mail: jairton.dupont@nottingham.ac.uk
fDayananda Sagar Academy of Technology & Management, Udayapura, Kanakapura Road, Bangalore-560 082, India
First published on 9th December 2016
Abstract
The combination of the pre-formed magnetic (Mn0.983Fe0.017)2O3 particles with Ta2O5 prepared from ionic liquids affords (MnFe)2O3@Ta2O5 core–shell composites. The photocatalytic activities of these core–shell materials were evaluated for hydrogen production, for which they appeared to be superior catalysts to the individual (Mn0.983Fe0.017)2O3 and Ta2O5 components.
Introduction
Nanomaterials, having one or more dimensions on the nanometer scale (≤100 nm), exhibit different properties from those of the bulk materials. Initially researchers showed much interest in homogeneous (made up of only one type of material) nanoparticles (NPs) but later in the 1980s, heterogeneous semiconductor composite materials were studied extensively.1 During the early 90s, multi-layered semiconductor nanomaterials (called “core–shells”) were fabricated.2 Moreover, researchers devoted their attention to developing advanced materials and the advancement of technology also greatly supported the synthesis of specific nanomaterials. Amongst them, special interest is given to those containing different shapes, such as: cubes, prisms, rods, tubes, disks, wires, octahedra and hexagons, among others, and also those with different combinations of core–shells including inorganic–inorganic, inorganic–organic, organic–inorganic and organic–organic composite materials.3 Amongst these advanced core–shell materials, semiconductors with wide band gaps play a significant role due to their potential applications in electronics, optics, magnetism and photocatalysis.4–8 Multi-component core–shells have been designed to incorporate many functions into one system.Indeed, magnetic TiO2 core–shells have been in the limelight due to their high efficiency in photocatalysis as well as recovery from treated water.9,10 Nevertheless, UV-light active TiO2 coated core–shell composites are difficult to synthesize without sacrificing their magnetic properties. Some research has been conducted on the use of a magnetic material as the core.11,12 More recently, super magnetic materials have been employed as core materials with the incorporation of transition metals into ferrite (MFe2O4, M = Ni, Co, Sr) and have displayed good results for the photocatalytic degradation of organic pollutants.13–17
As per literature reports, Misra et al.18 have synthesized a NiFe2O4@TiO2 core–shell composite with nickel ferrite as the inner magnetic core and titania as the outer photocatalytic shell via reverse micelle and chemical hydrolysis techniques. H. S. Kim et al.19 have synthesized a NiFe2O4@TiO2 core–shell nanomaterial photocatalyst for the production of hydrogen from an aqueous system using a methanol/water solution. Guo et al. have synthesized various mesoporous metal oxides such as Ta2O5, Nb2O5 and TiO2 which have been used to measure photocatalytic HER and OER.20 Punnoose et al. have prepared single and double coated barrier layers on TiO2 films using MgO and Al2O3, which enhances charge separation and also electron lifetime. In addition, layers of PbS with CdS significantly enhance the photo-current.21 Hamad et al. have synthesized CoFe2O4–SiO2–TiO2 magnetic core–shells in which SiO2 acts as an insulator between the CoFe2O4 core and the TiO2 shell and assists in the separation of the core and shell during photocatalysis. The CoFe2O4–SiO2–TiO2 composite has been tested for degradation of DCPIP dye.22 Li et al. have fabricated a stable ZnO–Ta2O5 photo-electrode for photoelectrochemical water splitting in which an ALD grown Ta2O5 layer protects ZnO NRs for water oxidation over a period of 5 h with no photocurrent decay.23 Misra et al. have prepared Au–Ag–ZnO core–shell nanoparticles to reduce charge recombination and enhance the visible light photocatalytic activity.24 Chang et al. have made Fe3O4@ZnS and NiCoO4@ZnS core–shell photocatalysts. The electronic structure and morphology of the materials affect the photocatalytic hydrogen production and better H2 production was observed.25 Chang et al. have prepared photoactive and magnetically recyclable CoFe2O4@ZnS core–shells by adding various ZnS concentrations and they observed better H2 production for the CoFe2O4@ZnS 0.5 h photocatalyst calcined at 500 °C.26 It was reported that CoFe2O4 or NiCo2O4 based core–shell nanomaterials have enhanced photocatalytic H2 production activity which can be attributed to the formation of a hetero-junction at the interface.
Alternatively, here, we have chosen ionic liquids (ILs) for the synthesis of core–shells because these fluids combine their unique properties (negligible vapor pressure, low melting point, high thermal stability, ionic conductivity, tailorable structures and wide electrochemical window) with the ability to provide suitable media to generate active nanocatalysts for several applications.27–29 The successful use of ILs for the synthesis of photocatalysts has also been previously reported.30–32 In particular, tantalum oxide nanoparticles were prepared from imidazolium hexachlorotantalate ILs and showed high activity for hydrogen production from water/ethanol solutions.32 In this case, it was suggested that the remaining IL at the surface of the Ta2O5 NPs plays a fundamental role in affording hydrophilic regions, which facilitate the approach of polar molecules.
Herein, we report the synthesis of a novel, advanced and useful bi-layered (MnFe)2O3@Ta2O5–IL core–shell material (IL: BMICl = 1-n-butyl-3-methylimidazolium chloride; DMICl = 1-n-decyl-3-methylimidazolium chloride). In order to cover the pre-formed (Mn0.983Fe0.017)2O3 core with Ta2O5 (shell) a similar method to that reported for the synthesis of Ta2O5 NPs has been employed.25 These core–shell materials were demonstrated to be efficient photocatalysts for hydrogen production in aqueous systems. Here, ILs containing different alkyl side chains were used in order to test the stabilizing effect of the groups on the synthesis of the core–shell materials as well as to observe the performance in hydrogen production reactions.
Results and discussion
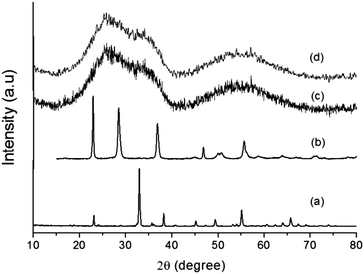
The addition of a magnetic core (Mn0.983Fe0.017)2O3 (MF) to the Ta2O5 shell assists in charge separation, which results in better H2 production. The (MnFe)2O3@Ta2O5 core–shell has been prepared using ILs and studies have been performed. Powder XRD patterns of the individual bare compounds and core–shells are shown in Fig. 1. In Fig. 1a, all the diffraction peaks are indexed to the cubic phase of manganese iron oxide (Mn0.983Fe0.017)2O3 (MF) (JCPDS No. 24-507, a = 9.4146 Å), with the space group la![[3 with combining macron]](https://www.rsc.org/images/entities/char_0033_0304.gif) d (no. 206). All of the diffraction peaks in Fig. 1b can be indexed to the orthorhombic phase of tantalum oxide (JCPDS No. 25-922, a = 6.198 Å, b = 40.29 Å, c = 3.888 Å) with the space group P21212 (no. 18). In the XRD patterns in Fig. 1c and d, we have observed broad diffraction peaks of the core–shells due to the presence of the ionic liquid. However, a few broad and weak diffraction peaks appeared that resembled the tetragonal phase of manganotapiolite (MnFe)2O3–Ta2O5 with JCPDS No. 49-1870, lattice parameters of a = 4.7660 Å and c = 9.2772 Å and the space group P42/mnm. This clearly explains the weak diffraction patterns of tantalum oxide and manganese iron oxide as they are bound by the outer tantalum oxide layer. The broad peaks that appear in the XRD patterns (Fig. 1c and d) suggest that the size of the core–shell is in the nanometer range.18
d (no. 206). All of the diffraction peaks in Fig. 1b can be indexed to the orthorhombic phase of tantalum oxide (JCPDS No. 25-922, a = 6.198 Å, b = 40.29 Å, c = 3.888 Å) with the space group P21212 (no. 18). In the XRD patterns in Fig. 1c and d, we have observed broad diffraction peaks of the core–shells due to the presence of the ionic liquid. However, a few broad and weak diffraction peaks appeared that resembled the tetragonal phase of manganotapiolite (MnFe)2O3–Ta2O5 with JCPDS No. 49-1870, lattice parameters of a = 4.7660 Å and c = 9.2772 Å and the space group P42/mnm. This clearly explains the weak diffraction patterns of tantalum oxide and manganese iron oxide as they are bound by the outer tantalum oxide layer. The broad peaks that appear in the XRD patterns (Fig. 1c and d) suggest that the size of the core–shell is in the nanometer range.18
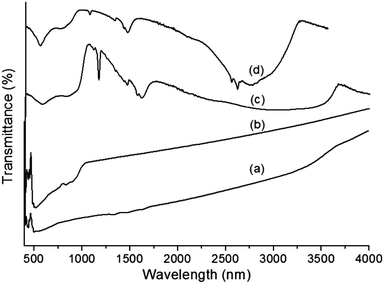
The FTIR spectra of core–shells prepared using two different ionic liquids are illustrated in Fig. 2a and b. It is possible to observe the different bands corresponding to metal oxides and organic moieties. The strong and broad bands between 3200 and 2900 cm−1 indicate the presence of water molecules. C–H stretching and in-plane vibrations of the imidazolium ring were observed in the range of 1600–1500 cm−1.33,34 The band at 1170 cm−1 is assigned to aliphatic in-plane vibrations. All of these bands confirm the existence of the ionic liquid even after repeated washing. The absorption bands of Ta–O (∼640–650 nm) were slightly shifted to higher frequencies due to the presence of more ‘Ta’ forming a strong and broad absorption band at ∼820 nm, which is attributed to the Ta–O–Ta stretching mode.35 The sharp band between 565 and 575 nm is due to the Fe–O bond vibration from MF, which is also observed in Fig. 2a.36 The strong band at 500 cm−1 is due to the presence of pure Ta2O5.37
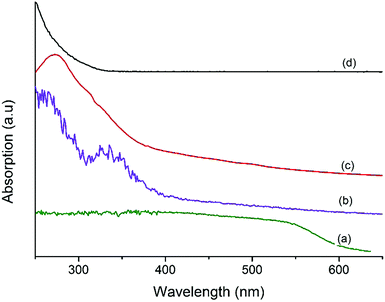
Fig. 3 shows the UV-vis spectra of MF, Ta2O5, and MFT–BMICl/DMICl core–shells. Fig. 3a clearly shows a continuous absorption band in the range of 200–600 nm, which concurs with its brick red color. The band gap is around 2.06 eV. Fig. 3b displays a strong absorption band in the UV region, 230–330 nm. The main characteristics of this absorption are due to Ta2O5 with a crystalline structure. The band gap is estimated to be 3.75 eV.38,39Fig. 3c and d of MFT–BMICl/DMICl clearly indicates that the edge of the absorption peak of Ta2O5 was red-shifted compared to the standard bare MF40 due to the narrowing of the band gap of Ta2O5 (outer shell), and thereby proving that it absorbs in the UV as well as in the visible region. We suggest that MF has changed the band gap of Ta2O5.
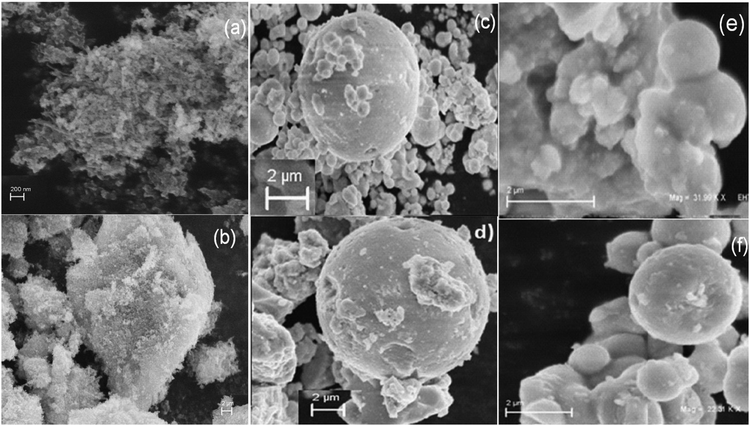
The SEM micrographs of MF (Fig. 4a) display a large number of particles that have aggregated to form a cluster. In Fig. 4b, the SEM image shows that bare Ta2O5 looks like a cluster of particles. SEM images of the core–shells clearly show that the sample contains pockmarked, spherical-shaped globules. A large number of controllable, crystalline monolith beads are clearly formed in the presence of BMICl (Fig. 4c and e) and are less controllable in the case of DMICl (Fig. 4d and f).
Fig. 5a shows a TEM image of MF that consists of roughly spherical particles with average diameters in the range of 10–40 nm. Fig. 5b depicts a TEM image of bare Ta2O5 and it clearly shows that the particles are slightly agglomerated with average diameters of 15–50 nm. Fig. 5c and e displays a high magnification view of the double-layered core–shells prepared using different ionic liquids, MFT–BMICl and MFT–DMICl, respectively. Although the different layers are indistinguishable in Fig. 5c, two distinct core and shell layers are clearly visible in Fig. 5e. As per the experimental procedure, the primary inner MF core was bound by the secondary Ta2O5 shell, which was confirmed using TEM images. The average diameter of the primary core is about 15–20 nm and the thickness of the secondary shell is 5–10 nm in the case of MFT–BMICl. A diameter of 15–25 nm of the primary core and a thickness of ∼5 nm of the shell were observed for MFT–DMICl. Fig. 5d and f shows HRTEM images of MFT–BMICl/DMICl in which the plane spacing of 3.37 Å corresponds to the d-spacing of MF(222) and 2.59 Å corresponds to the Ta2O5(1 11 0) plane, respectively. The TEM images clearly confirm the presence of double-layered core–shell nanomaterials.
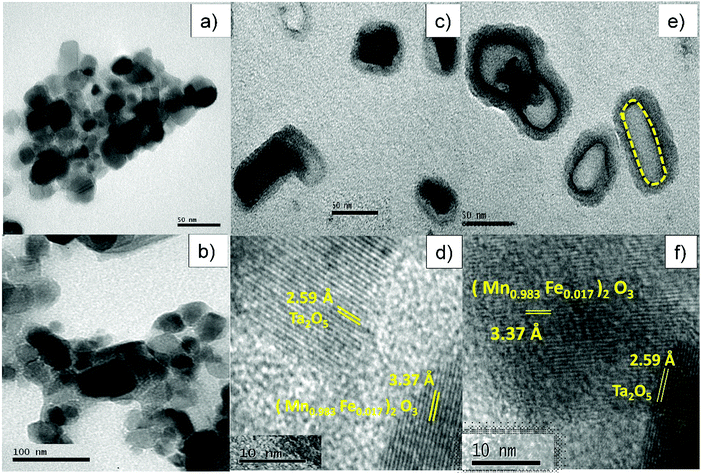 | ||
| Fig. 5 TEM images of (a) MF and (b) bare Ta2O5; TEM and HRTEM images of (c and d) MFT–BMICl and (e and f) MFT–DMICl. | ||
Generally, the photochemical hydrogen evolution process involves three important steps: (i) suitable light absorption by the photocatalyst, (ii) photo-generated charge formation, as well as charge separation and (iii) redox reactions on the surface of the photocatalyst or co-catalyst.41 Here, Ta2O5 is used for light absorption and as a redox site while the magnetic core MF is used to enhance charge separation. The detailed photochemical mechanism is predicted in Scheme 1, and is supported by earlier studies.19 The position of the conduction band (CB) of MF is at a lower energy than that of Ta2O5, and hence, the core acts as a storage site for photo-generated electrons. It is suggested that when light illuminates the photocatalyst, photo-generated electrons are transferred from the valence band (VB) to the CB of Ta2O5 and then they move into the CB of MF. Holes in the VB of Ta2O5 would assist in the production of OH˙, which is involved in the photocatalytic process.19 Progressively with the increase of the number of electrons in the CB of MF, they move into the VB of MF and then into the VB of the shell, which causes slow recombination. This kind of special redox cycle occurs in magnetic core–shell structures and helps with charge separation, resulting in a remarkable enhancement in H2 production. As we all know, in MFT–BMICl/DMICl core–shells the Fe ions exist in a +3 oxidation state (electronic configuration 3d6 = t2g6 eg0). Hence, during photochemical reactions Fe3+ ions can accept electrons from the Ta2O5 shell and become saturated to a stable oxidation state of Fe2+ and this conversion process reduces the recombination rate. On the other hand, the formation of photogenerated holes in the valence band of Ta2O5 converts OH− ions to OH radicals, which then oxidize water/ethanol to H2, O2 and CO2. The conversion of Fe3+ to Fe2+ and the formation of holes assist in the enhancement of photocatalytic hydrogen evolution. This process of the core–shell mechanism is strongly supported in the reported literature.19
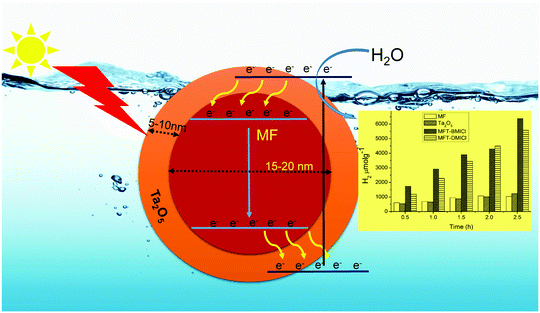 | ||
| Scheme 1 Proposed mechanism for photochemical hydrogen production, promoted by the core–shell particles. | ||
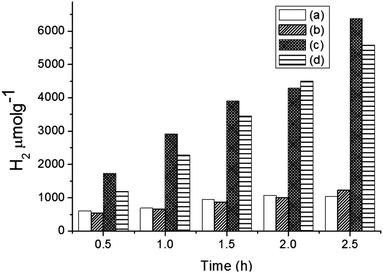
Hydrogen production was performed using the following photocatalysts: MF, bare Ta2O5 and MFT–BMICl/DMICl in the presence of different sacrificial agents such as ethanol, methanol and acetic acid. The variation of the amounts of the catalyst and pH was also studied. Initially, hydrogen production was studied using various photocatalysts such as MF, bare Ta2O5 and MFT–BMICl/DMICl and the results are shown in Fig. 6. In this reaction, the catalyst concentration was 1 mg mL−1 (8 mg of catalyst and 8 mL of solution mixture). Fig. 6 shows that MFT–BMICl has the highest H2 production activity (6373 μmol g−1), followed by MFT–DMICl (5582 μmol g−1), bare Ta2O5 (1224 μmol g−1) and MF (1037.56 μmol g−1) after 2.5 h of photocatalysis. The two materials synthesized using ILs, MFT–BMICl and DMICl, showed different H2 production rates. The rate of H2 production of MFT–BMICl is 2549.2 μmol g−1 h−1, while for MFT–DMICl it is 2232 μmol g−1 h−1. The activities of bare Ta2O5 and MF are 489.6 μmol g−1 h−1 and 415 μmol g−1 h−1, respectively.
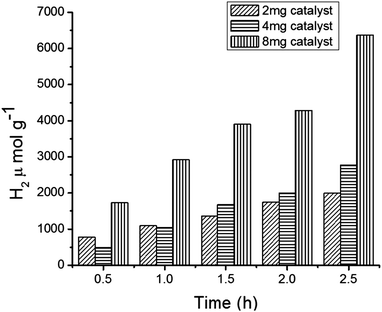
We continued the experiments to observe H2 production in the photocatalytic reaction system by varying the amount of the catalyst (MFT–BMICl) and the results are depicted in Fig. 7. This clearly indicates that increasing the amount of the photocatalyst increases the H2 production. Moreover, the system containing 8 mg of the catalyst showed better results with respect to H2 production and stability, when compared to 2 mg and 4 mg of the catalyst.
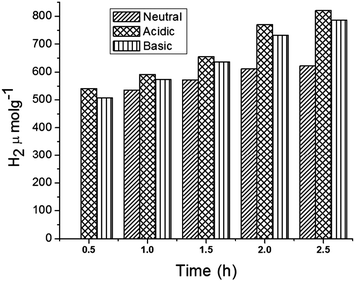
In addition, the role of pH in H2 production under the optimized conditions was investigated (Fig. 8). The results indicate that the production of H2 is higher under acidic conditions when compared to basic and neutral conditions. In fact, under acidic pH conditions more H+ ions could be adsorbed onto the surface of the photocatalyst, increasing the rate of H+ reduction to H2 molecules.46
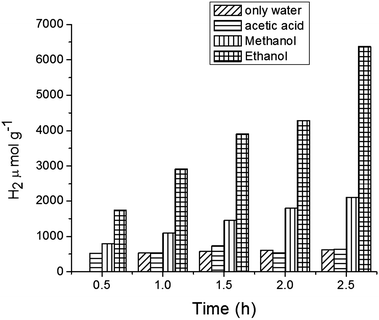
Fig. 9 illustrates the effect on H2 production of varying the sacrificial agents using the catalyst MFT–BMICl. As seen in Fig. 9, ethanol proved to be the best sacrificial agent (6373 μmol of H2), followed by methanol (2098 μmol of H2) and acetic acid (642 μmol of H2). In the presence of electron donors (ethanol and methanol) these are oxidized by the positive valence band (VB) holes, avoiding the electron/hole recombination process. Then, the excited electrons in the conduction band (CB) can reduce the protons (from water) to hydrogen molecules. In the case of acetic acid, it undergoes oxidation during the photocatalytic reaction, producing H2 and CO2 as by-products. Details of the photocatalytic reaction mechanism can be found below.42–45
| H2O−2e → O + 2H+ | (1) |
| C2H5OH−2e → CH3CHO + 2H+ | (2) |
| CH3OH−2e → HCHO + 2H+ | (3) |
| 2H+ + 2e → H2 | (4) |
| CH3COOH(aq) + O2 → 2CO2 + 2H2. | (5) |
| Catalyst | Sacrificial agent | pH | Amount of catalyst (mg) | ||||||
|---|---|---|---|---|---|---|---|---|---|
| Ethanolb | Methanolb | Acetic acidb | Neutral (only water)b | Acidicb | Basicb | 2c | 4c | 8c | |
| a In parentheses is shown the rate of H2 production (μmol g−1 h−1); in all cases 8 mL of solution was used. b 8 mg of the catalyst was used. c Ethanol was used as the sacrificial agent. | |||||||||
| MF–Ta2O5–BMICl | 6373.22 (2549.28)a | 2098.84 (839.53)a | 729.91 (256.92)a | 621.77 (248.7)a | 820.27 (328.1)a | 785.6 (314.2)a | 1999 (799.74)a | 2774.36 (1109.8)a | 6373.22 (2549.28)a |
| MF–Ta2O5–DMICl | 5582.5 (2232)a | — | — | — | — | — | — | — | — |
| Bare MF | 1037.56 (415)a | — | — | — | — | — | — | — | — |
| Bare Ta2O5 | 1224 (489.6)a | — | — | — | — | — | — | — | — |
Conclusions
In conclusion, (MnFe)2O3@Ta2O5–IL core–shell materials prepared using two different ILs showed better photocatalytic results compared to their individual core and shell. Core–shells with clear boundaries have been formed without agglomeration. The H2 production values recorded for MFT–BMICl, MFT–DMICl, MF (core) and Ta2O5 (shell) were 2549.28, 2232, 415 and 489.6 μmol g−1 h−1, respectively. Core–shell MFT–BMICl recorded the highest hydrogen production compared to the core and shell in the presence of ethanol as sacrificial agent. From these studies we found that the inner magnetic core successfully helps in charge separation and gives better hydrogen production. The material also can be recycled by separating the magnetic core from the shell using a bar magnet. Hence the material is reusable.Experimental section
Materials
TaCl5 was obtained from Alfa Aesar (99.99% purity). Manganese(II) acetylacetonate (95% pure) and FeCl3 (98% pure) were purchased from Strem Chemicals and used without further purification.Synthesis
![[thin space (1/6-em)]](https://www.rsc.org/images/entities/char_2009.gif) :
:![[thin space (1/6-em)]](https://www.rsc.org/images/entities/char_2009.gif) 1.1 molar ratio) were mixed directly and stirred at 60 °C for 2 days. The heating was continued until a homogeneous solution was formed. Then, 100 mL of acetone and 1–2 mL of methanol were added under warm conditions. After this, a pinch of previously formed BMICl was added as a seeding agent and the reaction mixture was kept aside for the crystals to be formed in the freezer. The solution was separated and kept again in the freezer for about 24 h to form crystals. The crystals were washed with ethyl acetate and dried under vacuum (Fig. 10).
1.1 molar ratio) were mixed directly and stirred at 60 °C for 2 days. The heating was continued until a homogeneous solution was formed. Then, 100 mL of acetone and 1–2 mL of methanol were added under warm conditions. After this, a pinch of previously formed BMICl was added as a seeding agent and the reaction mixture was kept aside for the crystals to be formed in the freezer. The solution was separated and kept again in the freezer for about 24 h to form crystals. The crystals were washed with ethyl acetate and dried under vacuum (Fig. 10).
Characterization
The morphology of the prepared materials was characterized using scanning electron microscopy (SEM) and transmission electron microscopy (TEM) using a JEOL 6060 and a JEOL JEM1200 EXII operating at 15 kV and 80 kV, respectively. For TEM analysis, the samples were prepared by dispersing a few milligrams of freestanding NTs in acetone at room temperature followed by ultrasonication. One or two drops were further deposited on a 400 mesh carbon-coated Cu grid. Chemical analyses using line scans and mapping were performed using an electron probe energy-dispersive X-ray spectrometer (EDX) in an SEM microscope. X-ray powder diffraction (XRD) experiments were conducted using a D/max-3B diffractometer with Cu Kα radiation. The scans were made in the 2θ range 10–80° with a scan rate of 0.5° min−1 (low angle diffraction). Fourier transform infrared spectra of the samples were collected using a Bruker Alpha-P spectrometer. The absorption spectra of the samples were measured using a Perkin-Elmer Lambda-750 UV-VIS spectrometer. For the photocatalytic experiments, a Xe lamp (300 W, Cermax) operating at 240 W was used.Photocatalytic experiments
The photocatalytic reactions were carried out in a 20 mL quartz glass reactor with a closed gas-circulating system. 8 mg of the core–shell sample and 6 mL of water were placed in the reactor and sonicated for 20 min. After sonication, 2 mL of a sacrificial agent was added (25% volume of an organic compound was used). Before irradiation, the system was de-aerated by bubbling argon for about 10–15 min to remove the oxygen content. During the entire experiment, the reaction temperature was kept at 25 °C by eliminating the IR radiation with the circulation of water in the outer jacket of the reactor. Analyses were conducted using an Agilent 6820 GC chromatograph equipped with a thermal conductivity detector (TCD) and 5 Å molecular sieves packing the column, with argon as the carrier gas. The amount of hydrogen produced was measured using a gas-tight syringe with a maximum volume of 50 μL at 0.5 h intervals. H2 experiments were repeated by varying the sacrificial agents, catalytic load and pH.Separation of the magnetic core
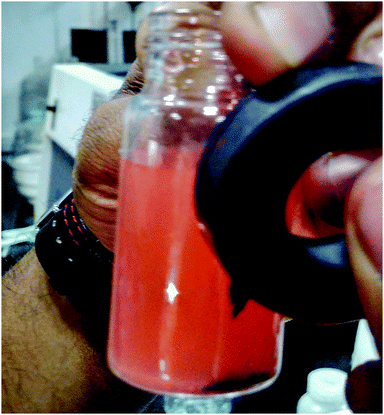
After photocatalysis, separation of the magnetic core (Mn0.983Fe0.017)2O3 particles from the (MnFe)2O3@Ta2O5 core–shell composite is possible, as shown in Fig. 11. Here, we have dispersed a certain quantity of (MnFe)2O3@Ta2O5 into aqueous solution in a glass container and sonicated it for a few minutes. Then a magnetic bar was moved along the glass container, and most of the larger magnetic core particles started being attracted to the magnetic bar, which extracted them.Acknowledgements
The authors thank CNPq-TWAS (K. Manjunath) and CAPES for research support.Notes and references
- A. Henglein, Chem. Rev., 1989, 89, 1861 CrossRef CAS
.
- C. F. Hoener, K. A. Allan, A. J. Bard, A. Campion, M. A. Fox, T. E. Malluok, S. E. Webber and J. M. White, J. Phys. Chem., 1992, 96, 3812 CrossRef CAS
.
- G. C. Rajib and P. Santanu, Chem. Rev., 2012, 112, 2373 CrossRef PubMed
.
- I. C. Chiang, Y. T. Chen and D. H. Chen, J. Alloys Compd., 2009, 468, 237 CrossRef CAS
.
- J. Kim, M. Junkin, D. H. Kim, S. Kwon, Y. S. Shin, P. K. Wong and B. K. Gale, Microfluid. Nanofluid., 2009, 7, 149–167 CrossRef CAS
.
- M. Faraji, Y. Yamini and M. Rezaee, J. Iran. Chem. Soc., 2010, 7, 1 CrossRef CAS
.
- M. Arruebo, W. Y. Ho, K. F. Lam, X. Chen, J. Arbiol, J. Santamaria and K. L. Yeung, Chem. Mater., 2008, 20, 486 CrossRef CAS
.
- X. Chen, M. Arruebo and K. L. Yeung, Catal. Today, 2013, 204, 140 CrossRef CAS
.
- C. J. Li, J. N. Wang, B. Wang, J. R. Gong and Z. A. Lin, Mater. Res. Bull., 2012, 47, 333 CrossRef CAS
.
- T. L. Su, C. S. Chiou and H. W. Chen, Int. J. Photoenergy, 2012, 909678, 1 CrossRef
.
- Y. Ding, J. R. Morber, R. L. Snyder and Z. L. Wang, Adv. Funct. Mater., 2007, 17, 1172 CrossRef CAS
.
- Y. Tan, Z. Zhuang, Q. Peng and Y. Li, Chem. Mater., 2008, 20, 5029 CrossRef CAS
.
- R. Krahnea, G. Morello, A. Figuerola, C. George, S. Deka and L. Manna, Phys. Rep., 2011, 501, 75 CrossRef
.
- S. Mohapatra, S. R. Routa and A. B. Panda, Colloids Surf., A, 2011, 384, 453 CrossRef CAS
.
- L. Wang, J. Li, Y. Wang, L. Zhao and Q. Jiang, Chem. Eng. J., 2012, 181–182, 72 CrossRef CAS
.
- S. Q. Liu, L. R. Feng, N. Xu, Z. G. Chen and X. M. Wang, Chem. Eng. J., 2012, 203, 432 CrossRef CAS
.
- Y. S. Chung, S. B. Park and D. W. Kang, Mater. Chem. Phys., 2004, 86, 375 CrossRef CAS
.
- S. Rana, R. S. Srivastava, M. M. Sorensson and R. D. K. Misra, Mater. Sci. Eng., B, 2005, 119, 144 CrossRef
.
- H. S. Kim, D. Kim, B. S. Kwak, G. B. Han, M. H. Um and M. Kang, Chem. Eng. J., 2014, 243, 272 CrossRef CAS
.
- L. Guo, S. Ida, T. Daio, H. Hagiwara and T. Ishihara, New J. Chem., 2014, 38, 5846–5855 RSC
.
- D. Punnoose, C. H. S. S. Pavan Kumar, H. W. Seo, M. Shiratani, A. E. Reddy, S. Srinivasa Rao, C. V. Thulasi-Varma, S. K. Kim, S. H. Chung and H. J. Kim, New J. Chem., 2016, 40, 3423 RSC
.
- H. Hamad, M. A. El-Latif, A. El-Hady Kashyout, W. Sadik and M. Feteha, New J. Chem., 2016, 39, 3116–3128 RSC
.
- C. Li, T. Wang, Z. Luo, D. Zhang and J. Gong, Chem. Commun., 2015, 51, 7290–7293 RSC
.
- M. Misra, P. Kapur, M. K. Nayak and M. Singla, New J. Chem., 2014, 38, 4197–4203 RSC
.
- C. Chang, Z. Lee, M. D. Wei, C. Chang and K. Chu, Int. J. Hydrogen Energy, 2015, 40, 11436 CrossRef CAS
.
- C. Chang, Z. Lee, K. Chu and Y. Wei, J. Taiwan Inst. Chem. Eng., 2016, 66, 386 CrossRef CAS
.
-
(a) J. Dupont, R. F. deSouza and P. A. Z. Suarez, Chem. Rev., 2002, 102, 3667 CrossRef CAS PubMed
; (b) J. Dupont and J. D. Scholten, Chem. Soc. Rev., 2010, 39, 1780 RSC
; (c) J. D. Scholten, B. C. Leal and J. Dupont, ACS Catal., 2012, 2, 184 CrossRef CAS
; (d) J. D. Scholten, Curr. Org. Chem., 2013, 17, 348 CrossRef CAS
.
- H. Zhang, X. Li and G. Chen, J. Mater. Chem., 2009, 19, 8223 RSC
.
- H. Hu, H. Yang, P. Huang, D. Cui, Y. Peng, J. Zhang, F. Lu, J. Lian and D. Shi, Chem. Commun., 2010, 46, 3866 RSC
.
- L. Wang, L. Chang, B. Zhao, Z. Yuan, G. Shao and W. Zheng, Inorg. Chem., 2008, 47, 1443 CrossRef CAS PubMed
.
- H. Li, J. Qu, Q. Cui, H. Xu, H. Luo, M. Chi, R. A. Meisner, W. Wang and S. Dai, J. Mater. Chem., 2011, 21, 9487 RSC
.
- V. S. Souza, J. D. Scholten, D. E. Weibel, D. Eberhardt, D. L. Baptista, S. R. Teixeira and J. Dupont, J. Mater. Chem. A, 2016, 4, 7469 CAS
.
- J. Kiefer, J. Fries and A. Leipertz, Appl. Spectrosc., 2007, 61, 1306 CrossRef CAS PubMed
.
- G. Nagaraju, K. Manjunath, T. N. Ravishankar, B. S. Ravikumar, H. Nagabhushan, G. Ebeling and J. Dupont, J. Mater. Sci., 2013, 48, 8420 CrossRef CAS
.
- J. Masse, H. Szymanowski, O. Zabeida, A. Amassian, J. E. Klemberg-Sapieha and L. Martinu, Thin Solid Films, 2006, 515, 1674 CrossRef CAS
.
- H. F. Liang and Z. C. Wang, Mater. Chem. Phys., 2010, 124(2–3), 964–969 CrossRef CAS
.
- L. Xu, Y. Wang, X. Yang, X. Yu, Y. Guo and H. James, Green Chem., 2008, 10, 746 RSC
.
- K. Sayama and H. Arakawa, J. Photochem. Photobiol., A, 1994, 77, 243 CrossRef CAS
.
- M. Stodolny and M. Laniecki, Catal. Today, 2009, 142, 314 CrossRef CAS
.
- A. Subia, N. D. Pandey, P. Meyer and A. Pandey, Beilstein J. Nanotechnol., 2014, 5, 1082 CrossRef PubMed
.
- S. R. Lingampalli, A. Roy, M. Ikram and C. N. R. Rao, Chem. Phys. Lett., 2014, 610–611, 316 CrossRef CAS
.
- H. Harada, T. Sakata and T. Ueda, J. Am. Chem. Soc., 1985, 107, 1773 CrossRef CAS
.
- T. Kawai and T. Sakata, J. Chem. Soc., Chem. Commun., 1980, 694 RSC
.
- T. Sakata and Y. Kawai, Chem. Phys. Lett., 1981, 80, 341 CrossRef CAS
.
-
(a) K. Tomoji, Nature, 1979, 282, 5736 Search PubMed
; (b) K. Tomoji, J. Chem. Soc., Chem. Commun., 1979, 23, 1047 Search PubMed
.
- A. A. Nada, M. H. Barakat, H. A. Hamed, N. R. Mohamed and T. N. Veziroglu, Int. J. Hydrogen Energy, 2005, 30, 687 CrossRef CAS
.
| This journal is © The Royal Society of Chemistry and the Centre National de la Recherche Scientifique 2017 |

