Fabrication and supercapacitor behavior of phosphomolybdic acid/polyaniline/titanium nitride core–shell nanowire array
Lu
Lu
and
Yibing
Xie
*
School of Chemistry and Chemical Engineering, Southeast University, 211189, Nanjing, China. E-mail: ybxie@seu.edu.cn
First published on 23rd November 2016
Abstract
Phosphomolybdic acid (PMo12) with reversible electron shuttling is a potential electrode material. Possessing good solubility limits its applications in energy storage. A novel and efficient phosphomolybdic acid/polyaniline/titanium nitride core–shell nanowire array (PMo12/PANI/TiN NWA) was synthesized as a supercapacitor electrode. FT-IR and Raman spectra showed that PMo12 was well incorporated into PANI and the structures of PANI and PMo12 were completely retained. PMo12/PANI/TiN NWA displayed core–shell nanowire array morphology with narrow diameters and oriented perpendicular to the substrate, benefiting ion diffusion and electron transportation. The PMo12/PANI/TiN NWA electrode exhibited a higher specific capacitance of 469 F g−1 at 1 A g−1 compared with PANI/TiN NWA electrode. PMo12/PANI/TiN supercapacitor could achieve a specific capacitance of 69 F g−1 and an energy density of 21.6 W h kg−1 at a current density of 0.5 A g−1 and an output voltage of 1.5 V. The effects of PMo12 incorporated in PANI and the immobilization mechanism of PMo12 are proposed and discussed.
1. Introduction
In recent years, the design and fabrication of supercapacitors have become an important research area due to their high power density, relatively high energy density and long cycle life in power source applications.1 Electrode materials are the most important and decisive components of supercapacitors. General electrode materials mainly involve carbon materials, transition metal oxides and conductive polymer materials.2 Among these, carbon materials generally possess double-layer capacitance for a high specific surface area.3 However, relatively low energy density of carbon materials often limits their large-scale application.4 Consequently, transition metal oxides and conductive polymer materials have attracted much more attention and have been extensively employed as electrode materials owing to their redox pseudo-capacitance.Polyaniline (PANI) is a conductive polymer with several advantages, such as high energy-storage capacity, low cost, tunable physicochemical properties and good environmental stability. Therefore, it has wide applications particularly in the field of supercapacitors.5–7 PANI used as electrode material can provide a high specific capacitance due to unique proton doping/dedoping. However, the major shortcomings of PANI are low electrical conductivity and poor stability. Recently, graphene, carbon dots and titanium nitride with very high conductivity have been widely investigated for various electrochemical applications.8–10 PANI combined with conductive materials is effective to overcome the abovementioned problems.11,12
Over the past decade, heteropoly acids (HPAs) have captured a great deal of attention owing to their potential applications in catalysis, electrochemistry, photochemistry and biomedicine. HPAs possess a well-defined structure and reversible electron shuttling, which make HPAs a potential electrode material. Nevertheless, their good solubility derived from their molecular nature, has caused them to be ignored as active compounds for electrodes or for any type of materials. In order to avoid the dissolution of HPAs, such as phosphomolybdic acid (PMo12), some researchers have utilized the adsorption of PMo12 on carbon surfaces or combined PMo12 with conductive polymers to form hybrid materials.13–15 P. Gómez-Romero et al. reported a hybrid organic–inorganic nanocomposite material PMo12/PANI. Under current densities of 0.125 mA cm−2, the average capacity determined in repeating cycles was 195 mF cm−2, which corresponded to an energy density of 24.4 mJ cm−2. The Keggin type heteropolymolybdate provides mixed-valence redox centers between which fast electron hopping is feasible.16 J. Suarez-Guevara et al. synthesized the hybrid material, HT–RGO–PMo12, in a single step by a hydrothermal treatment; this material exhibited a specific capacitance of 276 F g−1, and a small decrease in specific capacitance of just 4% after 10![[thin space (1/6-em)]](https://www.rsc.org/images/entities/char_2009.gif) 000 cycles, indicating excellent stability of this hybrid material.13 K. Kume et al. reported PMo12/RGO, in which individual PMo12 molecules were adsorbed on the RGO surfaces. The supercapacitor, using PMo12/RGO as an electrode material, exhibited a capacitance of 140 A h kg−1.14 T. F. Otero et al. designed PPy/POM films using the Keggin, Anderson-Evans, Lindqvist, and Dawson-Wells type heteropolyacids, such as PPy/PW12, PPy/PMo12, PPy/P2W18, which exhibited a higher specific charge of 82, 78 and 47 mA h g−1.15 However, based on previous reports, the adsorption of PMo12 on carbon materials is limited by the specific surface area, and the electrical conductivity of HPAs/conductive polymer needs to be improved further. Therefore, developing methods to fully utilize HPAs as active electrodes is still a great challenge.
000 cycles, indicating excellent stability of this hybrid material.13 K. Kume et al. reported PMo12/RGO, in which individual PMo12 molecules were adsorbed on the RGO surfaces. The supercapacitor, using PMo12/RGO as an electrode material, exhibited a capacitance of 140 A h kg−1.14 T. F. Otero et al. designed PPy/POM films using the Keggin, Anderson-Evans, Lindqvist, and Dawson-Wells type heteropolyacids, such as PPy/PW12, PPy/PMo12, PPy/P2W18, which exhibited a higher specific charge of 82, 78 and 47 mA h g−1.15 However, based on previous reports, the adsorption of PMo12 on carbon materials is limited by the specific surface area, and the electrical conductivity of HPAs/conductive polymer needs to be improved further. Therefore, developing methods to fully utilize HPAs as active electrodes is still a great challenge.
The morphology of electrode materials is related to the electrochemical capability. It is an effective way to build an array and network structure, which can effectively reduce the mass transfer resistance and enhance electron transfer efficiency in a reversible redox process. In addition, it is also a useful method to grow the active materials directly on a self-standing current collector. A conductive current collector directly attached to the active materials could provide fast electron transport and further improve the rate capability. A binder-free electrode material would reduce the negative influence of auxiliary components, and enhance specific energy density and even specific power density significantly. Comparatively, a large portion of active surface area is blocked by binders used in common slurry-coating technology.
In this study, PMo12 and PANI thin layer (PMo12/PANI) were formed on TiN NWA to fabricate PMo12/PANI/TiN NWA through a one-step electrochemical co-polymerization process. PMo12/PANI/TiN NWA was designed to solve the problem of the solubility of PMo12 during the electrochemical process. The electrochemical properties of the obtained PMo12/PANI/TiN NWA were investigated by cyclic voltammetry, galvanostatic charge/discharge measurements and electrochemical impedance spectroscopy in a 1 M aqueous H2SO4 electrolyte. All-solid-state supercapacitors were also investigated using PMo12/PANI/TiN NWA electrodes and PMo12–H3PO4–PVA gel electrolyte.
2. Experimental
2.1. Materials
Carbon fibers (CF) were purchased from Good fellow Cambridge Ltd. The aniline monomer (chemically pure, purity >98%), phosphomolybdic acid (analytically pure, purity >99%), and ammonia (NH3, purity >99%) were purchased from Sinopharm Chemical Reagent Co., Ltd. The other chemicals were of analytical grade and used without any further purification. Doubly distilled water was used in all aqueous solutions.2.2. Synthesis of TiN NWA
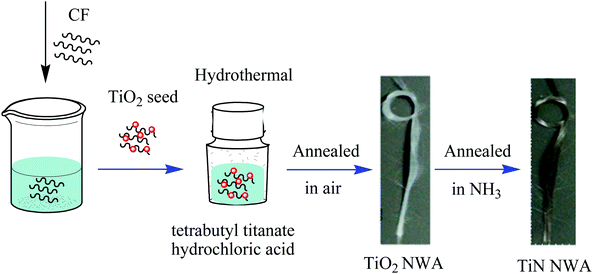
Fig. 1 shows the preparation process of TiN NWA. Briefly, the CF, cleaned with concentrated nitric acid, ethanol and distilled water, was immersed in 0.2 M tetrabutyl titanate ethanol solution for 10 min and further heated in air at 350 °C for 10 min to form TiO2 seed on the surface of CF. 4.5 mM tetrabutyl titanate and 12 M hydrochloric acid were dispersed in deionized water with vigorous stirring. The as-obtained solution and CF with TiO2 seeds were transferred together into a Teflon-lined stainless steel autoclave and heated to 150 °C for 5 h. A white TiO2 NWA was formed. Subsequently, the product was heated to 550 °C for 1 h under nitrogen atmosphere and annealed at 900 °C for 1 h in ammonia atmosphere with a flow rate of 40 mL min−1 in a tubular furnace to form TiN NWA. The loading amount of TiN NWA on CF was about 2.0–3.0 mg.2.3. Synthesis of PMo12/PANI/TiN NWA
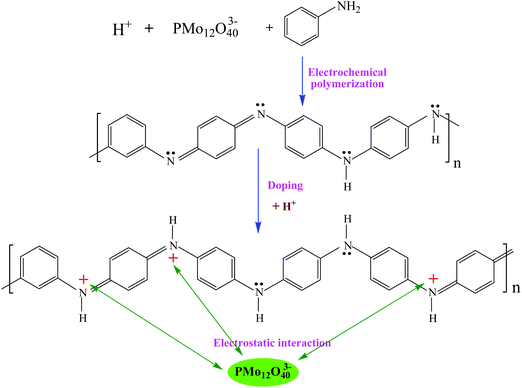
Fig. 2 shows the process of electrochemical co-polymerization of PMo12/PANI on the surface of TiN NWA supported on CF. Electrochemical co-polymerization was carried out through a cyclic voltammetry method in a standard three-electrode system that included TiN NWA supported on CF as the working electrode, Pt plate as the counter electrode and saturated calomel electrode (SCE) as the reference electrode. An aqueous solution containing 0.1 M aniline monomer, 1.65 mM PMo12 and 1 M sulfuric acid was used as an electrolyte solution. The co-polymerization of PMo12 and PANI was performed for 20 cycles over the potential range of −0.2–0.9 V at a sweep rate of 25 mV s−1 to form PMo12/PANI/TiN NWA. The obtained sample was washed with distilled water and ethanol. For comparison, PANI/TiN NWA was prepared by the same procedure without the addition of PMo12. PANI was also prepared on the CF by the same electrochemical polymerization procedure except for adding PMo12. PMo12 was synthesized by only adsorbing PMo12 aqueous solution on CF. The loading of PANI or PMo12/PANI film was both about 1.2 mg. The amount of active material included the total weight of TiN NWA, PANI and PMo12 in the electrochemical measurement.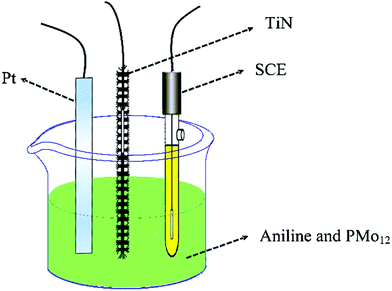 | ||
| Fig. 2 Schematic of the one-step electrochemical polymerization processes of PMo12 and PANI on the surface of TiN NWA supported on CF. | ||
2.4. Preparation of the all-solid-state supercapacitor
First, the phosphomolybdic acid-phosphate-polyvinyl alcohol (PMo12–H3PO4–PVA) gel electrolyte was obtained by the following method. PMo12, H3PO4 and PVA with a mass ratio of 6![[thin space (1/6-em)]](https://www.rsc.org/images/entities/char_2009.gif) :
:![[thin space (1/6-em)]](https://www.rsc.org/images/entities/char_2009.gif) 20
20![[thin space (1/6-em)]](https://www.rsc.org/images/entities/char_2009.gif) :
:![[thin space (1/6-em)]](https://www.rsc.org/images/entities/char_2009.gif) 5 were dissolved in deionized water and stirred at 80 °C for 2 h. The mixed solution was stirred continuously until a homogeneous liquid was formed. The phosphomolybdic acid-phosphate-polyvinyl alcohol solution was placed in a vacuum oven at 60 °C to evaporate excess water. Subsequently, PMo12–H3PO4–PVA gel was coated uniformly on the surface of the PMo12/PANI/TiN NWA electrodes and packaged by ultra-thin plastic film. The as-prepared supercapacitor was denoted as PMo12/PANI/TiN supercapacitor. The amount of electroactive materials on the PMo12/PANI/TiN supercapacitor was about 9.2 mg, including the total weight of the active materials of the two electrodes. The thickness of this supercapacitor was about 0.85 mm, which included the two electrodes, gel electrolyte and the wrapping film. The corresponding volume was about 0.36 cm3.
5 were dissolved in deionized water and stirred at 80 °C for 2 h. The mixed solution was stirred continuously until a homogeneous liquid was formed. The phosphomolybdic acid-phosphate-polyvinyl alcohol solution was placed in a vacuum oven at 60 °C to evaporate excess water. Subsequently, PMo12–H3PO4–PVA gel was coated uniformly on the surface of the PMo12/PANI/TiN NWA electrodes and packaged by ultra-thin plastic film. The as-prepared supercapacitor was denoted as PMo12/PANI/TiN supercapacitor. The amount of electroactive materials on the PMo12/PANI/TiN supercapacitor was about 9.2 mg, including the total weight of the active materials of the two electrodes. The thickness of this supercapacitor was about 0.85 mm, which included the two electrodes, gel electrolyte and the wrapping film. The corresponding volume was about 0.36 cm3.
2.5. Characterization
Fourier transform infrared (FT-IR) was collected from a Nicolet 5700 (USA) IR spectrometer in the range of 400–4000 cm−1. Raman spectroscopy was recorded on a Raman spectrometer (Renishaw microRaman spectroscopy) using a He–Ne laser that emitted 785 nm excitation with a wavenumber between 300 and 2000 cm−1. Scanning electron microscopy (SEM, Zeiss Ultra Plus) was performed to investigate the surface morphology and microstructure of PMo12/PANI/TiN NWA.2.6. Electrochemical measurement
A three-electrode system was employed in the electrochemical measurement, where the Pt plate and saturated calomel electrode (SCE) were used as the counter electrode and reference electrode, respectively. The aqueous electrolyte used was a 1 M H2SO4 solution. Cyclic voltammetry (CV) and galvanostatic charge/discharge (GCD) measurements of the electrode materials were recorded on a CHI760C electrochemical workstation. Electrochemical impedance spectroscopy (EIS) was investigated by an electrochemical workstation (EIS, ZAHNERim6ex, Germany) from 0.01–100 Hz with an electrode potential of 0 V vs. SCE and a potential amplitude of 5 mV. In addition, the specific capacitance (C), power density (P) and energy density (E) are calculated by the following equations (1–3):| C = It/mΔV | (1) |
| P = IΔV/2m | (2) |
| E = IΔVΔt/2m = CΔV2/2 | (3) |
3. Results and discussion
3.1. Preparation process and optical images of PMo12/PANI/TiN NWA
The preparation process of the PMo12/PANI/TiN NWA is illustrated in Fig. 3A, which mainly involved two steps. The first step is the formation of TiN NWA. Ordered TiO2 NWA was prepared on the surface of CF by a seed-assisted hydrothermal method. After that, TiO2 NWA was converted to TiN NWA by annealing in ammonia atmosphere. The second step is the formation of PMo12/PANI on the surface of TiN NWA via one-step electrochemical co-polymerization.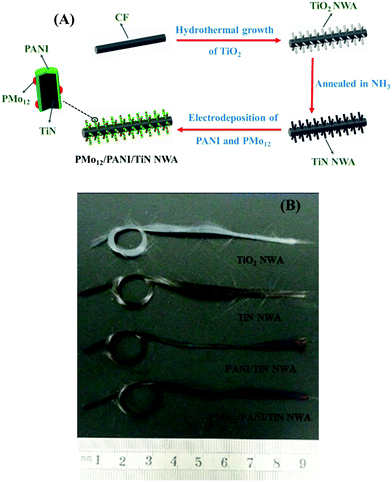 | ||
| Fig. 3 (A) Schematic of the growth processes of PMo12/PANI/TiN NWA supported on CF. (B) Optical images of TiO2 NWA, TiN NWA, PANI/TiN NWA and PMo12/PANI/TiN NWA supported on CF. | ||
Accordingly, optical images of TiO2 NWA, TiN NWA, PANI/TiN NWA and PMo12/PANI/TiN NWA grown on CF are shown in Fig. 3B. A distinct color change could be observed; white TiO2 NWA turned black, which was attributed to the formation of TiN NWA via an annealing treatment of TiO2 NWA at 900 °C for 1 h in an ammonia atmosphere. The green color of PANI/TiN NWA was attributed to the existence of polyemeraldine salt. PMo12/PANI/TiN NWA presents light purple color, implying that PMo12 was well incorporated into PANI.17
3.2. Immobilization mechanism of PMo12
As illustrated in the following eqn (4), the CF was adopted as a substrate of PMo12/PANI/TiN NWA. CF was initially oxidized with a strong acid to form surface functional groups (–COOH), which could serve as the binding sites for PMo12 modification. The strong chemisorption between –COOH of CF and PMo12 occurs through electron transfer and PMo12 reduction at the hydroxyl portion of the group.18 | (4) |
Fig. 4 shows the formation mechanism of PMo12/PANI. In the electrochemical co-polymerization process, PANI can be protonated by H+, which is produced by H2SO4 and PMo12. Electrostatic adsorption could occur between the heteropolyanion PMo12O403− and proton-doped PANI. As a result of the formation of PMo12/PANI, PMo12 would be distributed uniformly in PANI at the molecular level. Consequently, the design of PMo12/PANI/TiN NWA not only fully plays the role of redox pseudo-capacitance of PMo12/PANI, but also effectively inhibits the dissolution of PMo12.19
3.3. Structure analysis
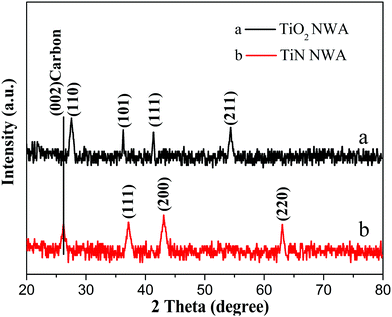
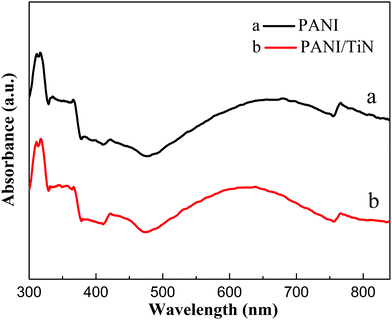
Fig. 5 shows the XRD patterns of the as-prepared TiO2 NWA and TiN NWA. Curve a indicates that the characteristic diffraction peaks at 36.2°, 41.4°, and 54.5° could be indexed as the (101), (111), and (211) crystal planes of TiO2, respectively. Curve b indicates that the characteristic diffraction peaks at 36.9°, 43.1°, and 62.8° could match well with the (111), (200), and (220) crystal planes of cubic TiN.20 In addition, the absence of characteristic TiO2 peaks at 25.4°, 41.4°, and 54.5° in TiN prove that TiO2 was converted into cubic TiN.In Fig. 6, similar absorption peaks can be observed in the UV-Vis/DRS spectra of PANI and PANI/TiN NWA. The absorption peak around 320 nm corresponds to π–π* transition. The absorption peak around 414 nm corresponds to polaron–π* transition. The other peak around 770 nm corresponds to the π–polaron transition.21,22 Moreover, the broad peak with a maximum at around 630 nm in the PANI absorption spectrum refers to electron excitation (transition) from the highest occupied molecular orbital (HOMO) of the benzenoid rings to the lowest unoccupied molecular orbital (LUMO) of the quinonoid rings. It represents the characteristic of half-oxidized PANI, i.e. emeraldine base.23,24
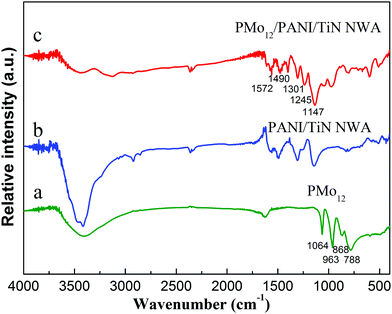
The FT-IR spectra of PMo12, PANI/TiN NWA and PMo12/PANI/TiN NWA are shown in Fig. 7. Considering PANI/TiN NWA (curve b), the absorption peaks at 1572 cm−1 and 1490 cm−1 were assigned to the deformation mode of benzene rings and C![[double bond, length as m-dash]](https://www.rsc.org/images/entities/char_e001.gif) C ring stretching vibration of the benzenoid diamine. C–N bond stretching vibration of quinone ring can be observed at 1301 cm−1. The characteristic peaks at 1245 cm−1 and 1147 cm−1 are due to the C–N bond stretching vibration peak and the stretching vibration of quinone ring.25 The FT-IR spectrum of PANI/TiN NWA demonstrates that PANI is deposited on the surface of TiN. Considering PMo12 (curve a) and PMo12/PANI/TiN NWA (curve c), four absorption peaks at 1064 cm−1, 963 cm−1, 868 cm−1 and 788 cm−1 are ascribed to the stretching vibrations of the P–O bond, Mo
C ring stretching vibration of the benzenoid diamine. C–N bond stretching vibration of quinone ring can be observed at 1301 cm−1. The characteristic peaks at 1245 cm−1 and 1147 cm−1 are due to the C–N bond stretching vibration peak and the stretching vibration of quinone ring.25 The FT-IR spectrum of PANI/TiN NWA demonstrates that PANI is deposited on the surface of TiN. Considering PMo12 (curve a) and PMo12/PANI/TiN NWA (curve c), four absorption peaks at 1064 cm−1, 963 cm−1, 868 cm−1 and 788 cm−1 are ascribed to the stretching vibrations of the P–O bond, Mo![[double bond, length as m-dash]](https://www.rsc.org/images/entities/char_e001.gif) O terminal bond, vertex Mo–O–Mo bond and edge Mo–O–Mo bond, respectively. It confirms the existence of PMo12 in PMo12/PANI/TiN NWA.19 Compared with the FT-IR spectrum of PMo12, the bands of PMo12 in PMo12/PANI/TiN NWA exhibited a slight shift, which may be due to the interaction between PANI and PMo12.
O terminal bond, vertex Mo–O–Mo bond and edge Mo–O–Mo bond, respectively. It confirms the existence of PMo12 in PMo12/PANI/TiN NWA.19 Compared with the FT-IR spectrum of PMo12, the bands of PMo12 in PMo12/PANI/TiN NWA exhibited a slight shift, which may be due to the interaction between PANI and PMo12.
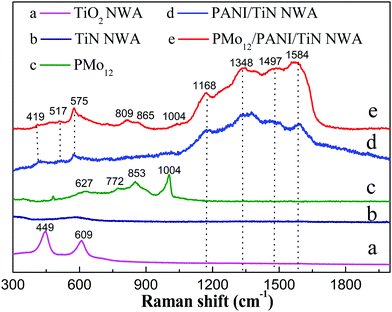
Fig. 8 shows the Raman spectra of TiO2 NWA, TiN NWA, PMo12, PANI/TiN NWA and PMo12/PANI/TiN NWA. The Raman spectrum of TiO2 NWA shows characteristic Raman bands at 449 and 609 cm−1 (curve a). However, the Raman spectrum of TiN NWA does not show the any characteristic Raman bands in the range of 300–2000 cm−1 (curve b), indicating that TiO2 NWA has been converted to cubic phase TiN NWA after annealing in NH3, which is consistent with the result of the XRD patterns.26 Curve c shows that the Raman spectrum of PMo12 exhibits a weak peak at 1004 cm−1 corresponding to the stretching vibration of νs (Mo![[double bond, length as m-dash]](https://www.rsc.org/images/entities/char_e001.gif) O), and the characteristic peaks at 870–620 cm−1 are attributed to the stretching vibration of νas (Mo
O), and the characteristic peaks at 870–620 cm−1 are attributed to the stretching vibration of νas (Mo![[double bond, length as m-dash]](https://www.rsc.org/images/entities/char_e001.gif) O), νs (Mo–Ob–Mo) and νs (Mo–Oc–Mo). This proves that PMo12 is a Keggin structure.27,28 Curve d shows that the characteristic peaks of PANI/TiN NWA at 1168 cm−1, 1497 cm−1 and 1584 cm−1 correspond to C–H bending, C–C stretching and C
O), νs (Mo–Ob–Mo) and νs (Mo–Oc–Mo). This proves that PMo12 is a Keggin structure.27,28 Curve d shows that the characteristic peaks of PANI/TiN NWA at 1168 cm−1, 1497 cm−1 and 1584 cm−1 correspond to C–H bending, C–C stretching and C![[double bond, length as m-dash]](https://www.rsc.org/images/entities/char_e001.gif) C stretching of the benzenoid ring and the quinoid ring. Furthermore, the peak at 1344 cm−1 corresponding to the C–N+ stretching is inherently associated with the protonation process, which results from polysemiquinone radical formation, proving that PANI is kept in its conducting state, which is consistent with the result of UV-vis/DRS spectra.26,29 In addition, the peaks at 419 cm−1, 517 cm−1 and 575 cm−1 are assigned to amine deformation and ring deformation (curve d and e). Comparatively, PMo12/PANI/TiN NWA exhibits PMo12 and PANI characteristic Raman peaks, suggesting that the PMo12/PANI is attached to the surface of TiN NWA (curve e). The peaks of PMo12 also show a slight shift, which is consistent with the IR spectrum.
C stretching of the benzenoid ring and the quinoid ring. Furthermore, the peak at 1344 cm−1 corresponding to the C–N+ stretching is inherently associated with the protonation process, which results from polysemiquinone radical formation, proving that PANI is kept in its conducting state, which is consistent with the result of UV-vis/DRS spectra.26,29 In addition, the peaks at 419 cm−1, 517 cm−1 and 575 cm−1 are assigned to amine deformation and ring deformation (curve d and e). Comparatively, PMo12/PANI/TiN NWA exhibits PMo12 and PANI characteristic Raman peaks, suggesting that the PMo12/PANI is attached to the surface of TiN NWA (curve e). The peaks of PMo12 also show a slight shift, which is consistent with the IR spectrum.
3.4. Morphological characterization
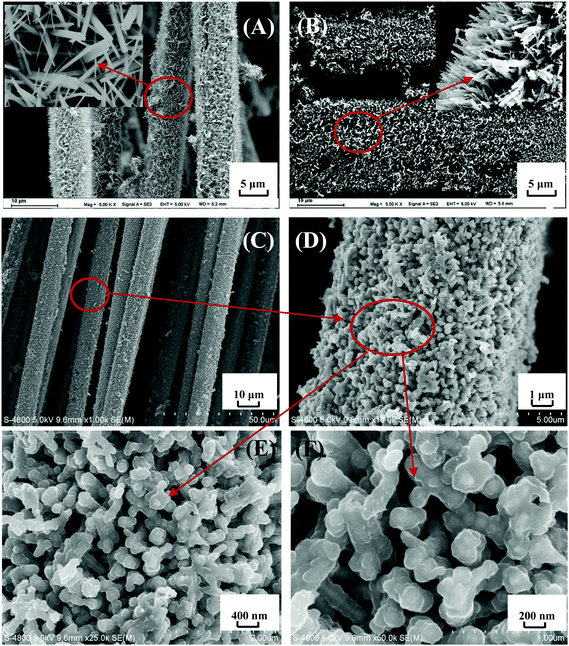
Fig. 9 shows SEM images of TiO2 NWA, TiN NWA and PMo12/PANI/TiN NWA. As shown in Fig. 9A, TiO2 NWA is grown uniformly on the surface of CF to form a nanowire array structure. The inset of Fig. 9A, clearly shows the aligned TiO2 NWA, which is about 1 μm in length and ∼50–80 nm in diameter. As shown in Fig. 9B, the ammonia nitridation treatment does not destroy the overall shape and sizes of TiN NWA, but becomes slightly bent and shows relatively rough surfaces compared to TiO2 NWA.30Fig. 9C–F show SEM images of PMo12/PANI/TiN NWA. The active materials are grown uniformly on the surface of CF, as shown in Fig. 9C and D. Fig. 9E and F show that the as-prepared PMo12/PANI/TiN NWA exhibits highly ordered coaxial core–shell structure and keeps perpendicular to the CF substrate. TiN NWA is covered by a thin layer of PANI and PMo12. PMo12/PANI/TiN NWA has a length of about 1–2 μm and a diameter of ∼100–160 nm. Compared with TiN NWA, the thickness of PMo12/PANI film is approximately 50–80 nm. Moreover, the open and free interspaces provided by the well separated PMo12/PANI/TiN NWA will let the electrolyte ions access the surface of the active materials more easily, and enhance the efficiency of the electrochemical reaction.3.5. Electrochemical measurement
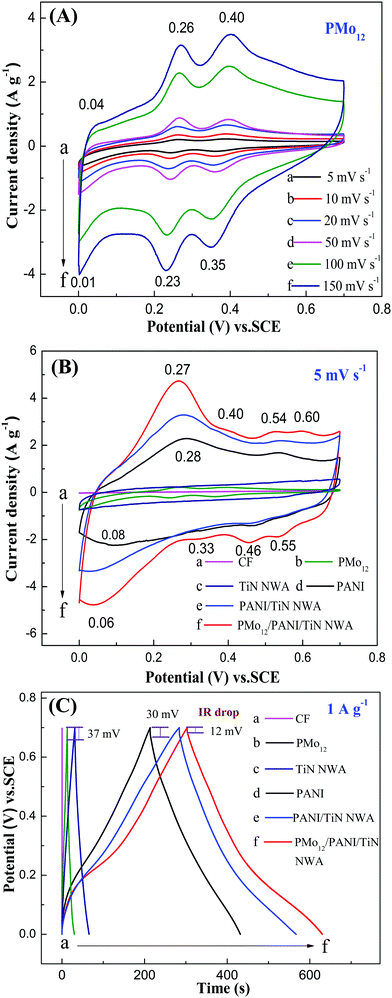
The electrochemical behaviors of the obtained samples were investigated by cyclic voltammetry (CV) and galvanostatic charge–discharge (GCD), and the results are presented in Fig. 10. The CV curve of PMo12 shows three pairs of redox peaks at 0.04/0.01 V, 0.26/0.23 V and 0.40/0.35 V (see Fig. 8A). The electrochemical behavior of PMo12 can be concluded in the following equations (5–7).31| PMo12O403− + 2e− + 2H+ → H2PMoV2MoVI10O403− | (5) |
| H2PMoV2MoVI10O403− + 2e− + 2H+ → H4PMoV4MoVI8O403− | (6) |
| H2PMoV4MoVI8O403− + 2e− + 2H+ → H6PMoV6MoVI6O403− | (7) |
Fig. 10B shows the CV curves of CF, PMo12, TiN NWA, PANI, PANI/TiN NWA and PMo12/PANI/TiN NWA in the 1 M H2SO4 aqueous electrolyte at a scan rate of 5 mV s−1. The current density of CF is very low (curve a). Considering TiN NWA (curve c), the CV curve exhibits a quasi-rectangular shape, which indicates ideal electrical double-layer capacitance. Furthermore, according to the previous literature, the electrochemical behavior of PANI can be concluded by three pairs of redox peaks at 0.28/0.08, 0.54/0.46 and 0.60/0.55 V. The first pair of redox peaks is derived from the redox process of leucoemeraldine base/emeraldine base. The second one corresponds to the byproducts and intermediates of hydroquinone/benzoquinone. The third one corresponds to the redox process of emeraldine base/pernigraniline base.32 PMo12/PANI/TiN NWA (curve f) involves the four pairs of redox peaks. A pair of peaks around 0.27/0.06 V corresponds to the redox reaction of both PMo12 (0.26/0.23 V) and PANI (0.28/0.08 V). A pair of peaks at 0.40/0.35 V is attributed to redox peaks of PMo12. Two pairs of peaks at 0.54/0.46 V and 0.60/0.55 V are corresponding to PANI. These results indicate that PMo12 is incorporated in PANI, which is in accordance with the result of the IR and Raman measurements. The current density and size of integral area of PMo12/PANI/TiN NWA are higher than that of any other samples, indicating the superior capacitance performance of PMo12/PANI/TiN NWA.
Fig. 10C shows the GCD curves of CF, PMo12, TiN NWA, PANI, PANI/TiN NWA and PMo12/PANI/TiN NWA in 1 M H2SO4 aqueous electrolyte at a current density of 1 A g−1. The IR drop is evidently decreased from 30 mV of PANI and 37 mV of PMo12 to only about 12 mV of PMo12/PANI/TiN NWA. The incorporation of TiN NWA enhances the conductivity of PMo12/PANI/TiN NWA and facilitates fast electron transportation. The Cm of the obtained samples is listed in Table 1. The highest capacitance is 469 F g−1 for PMo12/PANI/TiN NWA at 1 A g−1 in a 1 M H2SO4 aqueous electrolyte. The reasons why the Cm of PMo12/PANI/TiN NWA could be improved are as follows.
| Sample | CF | PMo12 | TiN NWA | PANI | PANI/TiN NWA | PMo12/PANI/TiN NWA |
|---|---|---|---|---|---|---|
| Mass of active material (mg) | 9 | 0.4 | 2.5 | 1.2 | 3.8 | 3.0 |
| C m (F g−1) | 0.2 | 25 | 48 | 304 | 403 | 469 |
(i) The Cm of PMo12/PANI/TiN NWA is higher than that of PANI/TiN NWA, deriving from the reversible redox reaction of PMo12. In addition, PMo12 is a proton-rich compound; it can promote the doping–dedoping of PANI.19
(ii) TiN NWA can provide high conductivity, serving as electron “superhighway” for charge storage and delivery, which overcomes the limited electrical conductivity of PANI itself.
(iii) The structure of core–shell nanowire arrays for PMo12/PANI/TiN NWA can supply a larger specific surface area as active sites, which adsorbs electrolyte ions and shortens the diffusion path of reactive ions and effective electron transfer paths, resulting in a fast and reversible redox reaction.
PMo12/PANI/TiN NWA exhibits excellent electrochemical properties among the as-prepared samples.
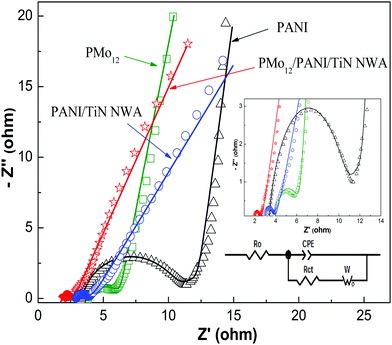
The charge transfer resistance and ion diffusion resistance of active electrode materials were evaluated by EIS measurements. Fig. 11 shows Nyquist plots of PMo12, PANI, PANI/TiN NWA and PMo12/PANI/TiN NWA in 1 M H2SO4 aqueous electrolyte. All Nyquist plots of the as-prepared samples exhibited a single semicircle in the high frequency range and a sloping line in the low frequency range. The real lines are the fitting result of using the Randle's equivalent circuit depicted in the inset of Fig. 11. The main elements include the ohmic resistance (Ro), charge transfer resistance (Rct), constant phase element (CPE), and Warburg element (W) in the equivalent circuit. The fitting values of the equivalent circuit elements are listed in Table 2. Ro is related to the ionic resistance of the electrolyte solution and intrinsic resistance of active materials. Rct is related to the charge transfer process of active materials/electrolyte solution interface. The PMo12 and PANI exhibit a higher resistance value (Ro and Rct). However, the values of Ro and Rct of PANI/TiN NWA and PMo12/PANI/TiN NWA are relatively low, suggesting that TiN NWA provides extreme electrical conductivity to promote charge-transfer. In particular, the Ro and Rct values of PMo12/PANI/TiN NWA are only 1.911 and 0.653 Ω. CPE-P is related to the surface roughness of electrode materials. A continuous increase of CPE-P is obtained when the surface of the electrode is much smoother. As can be observed from the data in Table 2, PMo12/PANI/TiN NWA has more dopant species, leading to a lower CPE-P. The Warburg diffusion impedance between the electrodes and electrolyte is described by the Warburg element. The lowest W–R value of PMo12 was obtained due to the easy dissolution of PMo12 in an aqueous solution. Therefore, except for PMo12, the W–R value of PMo12/PANI/TiN NWA is the minimum, proving that electrolyte ions can move more easily to the surface of the electrodes to participate in the electrochemical reaction. All the analysis mentioned above shows that PMo12/PANI/TiN NWA is a promising electrode material of supercapacitors.
| Electrodes | R o (Ω) | R ct (Ω) | CPE | W | |||
|---|---|---|---|---|---|---|---|
| CPE-T (×10−4) | CPE-P | W–R | W–T | W–P | |||
| PMo12 | 3.860 | 2.075 | 1.366 | 0.829 | 0.061 | 0.00011 | 0.451 |
| PANI | 3.329 | 7.965 | 1.926 | 0.816 | 5.893 | 0.247 | 0.469 |
| PANI/TiN NWA | 2.905 | 0.936 | 2.929 | 0.782 | 6.012 | 0.699 | 0.334 |
| PMo12/PANI/TiN NWA | 1.911 | 0.653 | 7.672 | 0.759 | 4.292 | 0.447 | 0.379 |
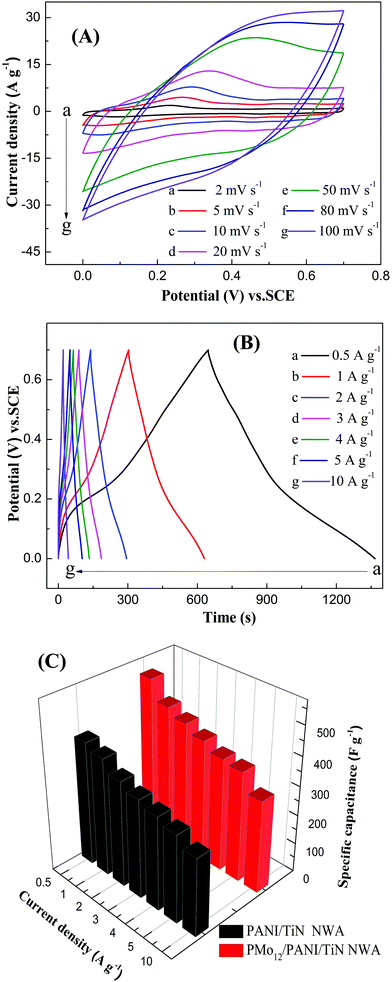
Fig. 12A shows the CV curves of PMo12/PANI/TiN NWA at different scan rates in the 1 M H2SO4 aqueous electrolyte. All the CV curves demonstrate a roughly mirror shape with respect to the zero-current line over the potential window of 0–0.7 V vs. SCE, which indicates a high Coulombic efficiency, owing to the highly reversible redox reactions and ideal electrochemical capacitive performance of the PMo12/PANI/TiN NWA electrode. At a lower sweep rate from 2 to 20 mV s−1, the redox peaks were observed in the CV curves, indicating the Faraday capacitance behavior of PANI. At a higher sweep rate of more than 50 mV s−1, the redox peaks gradually disappeared and the area of CV curve and the stable current presented slight improvement when the scan rate was increased, which shows that the Faraday capacitance decreases and the double-layer capacitance remains accordingly.26 The GCD curves of PMo12/PANI/TiN NWA at different current densities in the 1 M H2SO4 aqueous electrolyte are shown in Fig. 12B. All the GCD curves were close to a symmetrical triangle shape, illustrating that a good reversible charge/discharge process occurred in the electrochemical reaction of the electrode/electrolyte. The IR drop of PMo12/PANI/TiN NWA at 0.5 A g−1 was hardly observed, but with increasing current density, the IR drop increased gradually. The corresponding specific capacitances of PANI/TiN NWA and PMo12/PANI/TiN NWA at different current densities are displayed in Fig. 10C. The Cm of PMo12/PANI/TiN NWA was 535, 469, 443, 416, 388, 378 and 317 F g−1 at different current densities of 0.5, 1, 2, 3, 4, 5 and 10 A g−1, which is higher than that of PANI/TiN NWA. This may be due to the pseudo-capacitance originated from PMo12. The corresponding Cm of PMo12/PANI/TiN NWA remains about 71% from 0.5 to 5 A g−1, indicating a high rate capability.
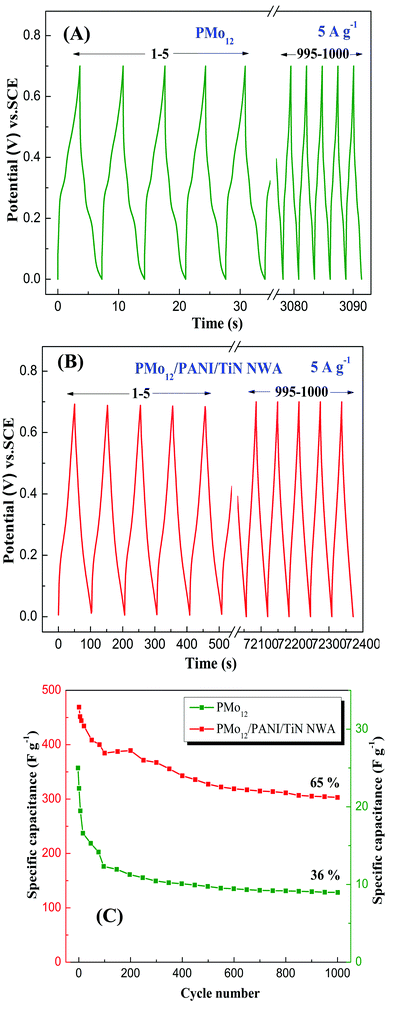
Fig. 13 shows the long-term cycling GCD measurements of PMo12 and PMo12/PANI/TiN NWA over 1000 cycles at 5 A g−1. In Fig. 13A, PMo12 exhibits a low specific capacitance of only 5.14 F g−1. This value rapidly decreases and only 36% of the initial capacitance remains after 1000 cycles. The decrease can be ascribed to the good solubility of PMo12 in an aqueous electrolyte. Hence, conductive polymer PANI is used to avoid the dissolution of PMo12. Fig. 13B shows that PMo12/PANI/TiN NWA has an initial high specific capacitance. The capacitance retention is 65% of its initial capacitance value after 1000 cycles. As shown in Fig. 13C, the capacitance of both PMo12/PANI/TiN and PMo12 quickly decayed in the first 200 cycles, and then remained nearly stable. Nevertheless, compared to PMo12, the long-term cycling performance of PMo12/PANI/TiN NWA was also enhanced. The strong chemisorption occurs between –COOH of CF and PMo12. PMo12 would be incorporated uniformly into PANI at the molecular level and PANI should give rise to a strong synergetic effect between PMo12 and PANI. After the incorporation of PMo12, PMo12/PANI film is in the conductive state (emeraldine salt). During the galvanostatic charge/discharge process, PANI would contribute to the pseudo-capacitance via reversible doping/dedoping reaction. Leucoemeraldine, emeraldine base, and emeraldine salt transform into each other. PMo12O403− clusters were trapped in the emeraldine salt of PANI. This can explain why PMo12/PANI/TiN NWA can improve the stability of PMo12 in aqueous electrolyte and show better long-term cycling performance.
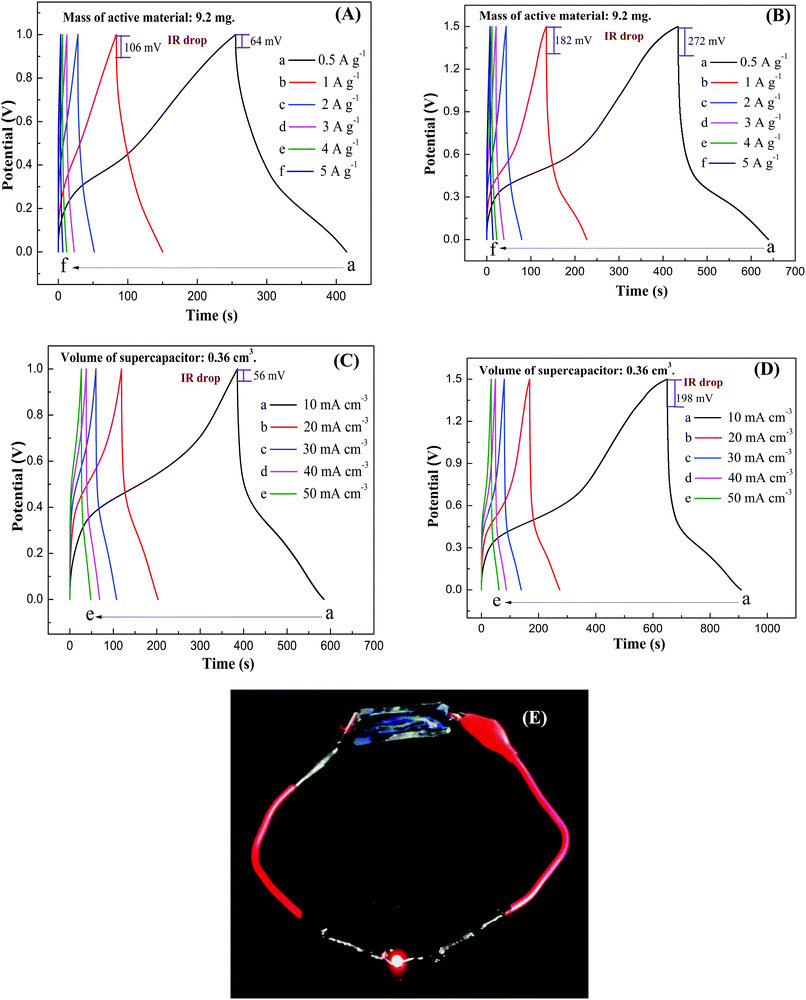
Fig. 14A–D show GCD curves of PMo12/PANI/TiN supercapacitor in an increased output voltage of 1.0 and 1.5 V at different current densities. The corresponding specific capacitance, power density and energy density are listed in Table 3. Under the higher output voltage of 1.5 V, the special capacitance of 69 F g−1 (or 1.72 F cm−3) at 1 A g−1 (or 10 mA cm−3) was achieved. In addition, compared to only 12 mV of the PMo12/PANI/TiN NWA electrode, the IR drop of all the GCD curves for PMo12/PANI/TiN supercapacitor was increased from 106 mV at an output voltage of 1.0 V to 182 mV at an output voltage of 1.5 V and a current density of 1 A g−1. This is mainly due to the higher resistance of the gel electrolyte rather than aqueous electrolyte. A maximum energy density obtained for our as-fabricated device was 21.6 W h kg−1 with a power density of 375 W kg−1. The PMo12/PANI/TiN supercapacitor showed superior capacitance performance compared to currently available HPAs-based supercapacitors, including phosphotungstate/AC//phosphotungstate/AC (4.96 W h kg−1 at 115 kW kg−1),33 PMo12/CNTs//PMo12/CNTs (1.3 W h kg−1 at 500 W kg−1),34 12-molybdosilicic acid/PPy//12-molybdosilicic acid/PPy (2.12 W h kg−1 at 35.7 W kg−1)35 and SWCNT-tetra-n-butyl ammonium–PV2Mo10 symmetric supercapacitor (15.7 W h kg−1 at 15.4 kW kg−1).36 In addition, the maximum volumetric energy density obtained for our as-fabricated device was 0.54 mW h cm−3 at a volumetric power density of 7.5 mW cm−3. Fig. 14E shows a light emitting diode (LED) lighted by a PMo12/PANI/TiN supercapacitor, suggesting the PMo12/PANI/TiN supercapacitor has potential application in the energy storage field.
| 0–1.0 V | Current densities (A g−1) | 0.5 | 1.0 | 2.0 | 3.0 | 4.0 | 5.0 |
| Specific capacitance (F g−1) | 79.8 | 67.0 | 50.6 | 33.2 | 24.1 | 17.8 | |
| Power density (W kg−1) | 250 | 500 | 1000 | 1500 | 2000 | 2500 | |
| Energy density (W h kg−1) | 11.1 | 9.3 | 8.4 | 4.6 | 3.3 | 2.5 | |
| 0–1.5 V | Current densities (A g−1) | 0.5 | 1.0 | 2.0 | 3.0 | 4.0 | 5.0 |
| Specific capacitance (F g−1) | 69.0 | 61.6 | 47.5 | 37.0 | 30.2 | 23.4 | |
| Power density (W kg−1) | 375 | 750 | 1500 | 2250 | 3000 | 3750 | |
| Energy density (W h kg−1) | 21.6 | 19.3 | 14.9 | 11.6 | 9.4 | 7.3 | |
| 0–1.0 V | Current densities (mA cm−3) | 10 | 20 | 30 | 40 | 50 | |
| Specific capacitance (F cm−3) | 2.01 | 1.68 | 1.42 | 1.31 | 1.09 | ||
| Power density (mW cm−3) | 5 | 10 | 15 | 20 | 25 | ||
| Energy density (W h cm−3) | 0.28 | 0.24 | 0.20 | 0.18 | 0.15 | ||
| 0–1.5 V | Current densities (mA cm−3) | 10 | 20 | 30 | 40 | 50 | |
| Specific capacitance (F cm−3) | 1.72 | 1.44 | 1.29 | 1.11 | 1.03 | ||
| Power density (mW cm−3) | 7.5 | 15 | 22.5 | 30 | 37.5 | ||
| Energy density (W h cm−3) | 0.54 | 0.45 | 0.40 | 0.35 | 0.32 | ||
4. Conclusion
Phosphomolybdic acid/polyaniline/titanium nitride core–shell nanowire array (PMo12/PANI/TiN NWA) was prepared via a series of hydrothermal, nitridation treatment and electrochemical co-polymerization method. PMo12 was incorporated into PANI, avoiding the solubility of PMo12 in aqueous solution. TiN NWA acted as a current collector and provided an array support to form PMo12/PANI/TiN NWA, which could promote charge transfer and provide the ion diffusion channel in a reversible redox reaction. The PMo12/PANI/TiN NWA electrode material exhibited a high specific capacitance, good rate capability and low resistance. PMo12/PANI/TiN NWA showed relatively better long-term cycling performance than PMo12. The PMo12/PANI/TiN supercapacitor retained the specific capacitance of 69 F g−1 (or 1.72 F cm−3) and energy density of 21.6 W h kg−1 (or 0.54 mW h cm−3) at a charge–discharge current of 0.5 A g−1 (or 10 mA cm−3) and an output voltage of 1.5 V. Hence, the PMo12/PANI/TiN NWA offered a desired microstructure and synthetic protocol for promising supercapacitor applications.Acknowledgements
This study was supported by the National Natural Science Foundation of China (No. 21373047), Graduate Innovation Program of Jiangsu Province (KYLX15_0126) and Project Funded by the Priority Academic Program Development of Jiangsu Higher Education Institutions.Notes and references
- X. Feng, N. Chen, J. Zhou, Y. Li, Z. Huang, L. Zhang, Y. Ma, L. Wang and X. Yan, New J. Chem., 2015, 39, 2261–2268 RSC.
- Y. Xie and F. Song, Ceram. Int., 2016, 42, 9717–9727 CrossRef CAS.
- Y. Xie and J. Ji, J. Mater. Res., 2016, 31, 1423–1432 CrossRef CAS.
- P. R. Choi, E. Lee, S. H. Kwon, J. C. Jung and M.-S. Kim, J. Phys. Chem. Solids, 2015, 87, 72–79 CrossRef CAS.
- E. Frackowiak, V. Khomenko, K. Jurewicz, K. Lota and F. Béguin, J. Power Sources, 2006, 153, 413–418 CrossRef CAS.
- Y. Xie, D. Wang and J. Ji, Energy Technol., 2016, 4, 714–721 CrossRef CAS.
- Y. Xie and D. Wang, J. Alloys Compd., 2016, 665, 323–332 CrossRef CAS.
- Y. Xie, Y. Meng and M. Wu, Surf. Interface Anal., 2016, 48, 334–340 CrossRef CAS.
- Y. Xie, Thin Solid Films, 2016, 598, 115–125 CrossRef CAS.
- Z. Zhao and Y. Xie, J. Power Sources, 2017, 337, 54–64 CrossRef CAS.
- Y.-G. Lim, M.-S. Park, K. J. Kim, K.-S. Jung, J. H. Kim, M. Shahabuddin, D. Byun and J.-S. Yu, J. Power Sources, 2015, 299, 49–56 CrossRef CAS.
- S. Wang, L. Ma, M. Gan, S. Fu, W. Dai, T. Zhou, X. Sun, H. Wang and H. Wang, J. Power Sources, 2015, 299, 347–355 CrossRef CAS.
- J. Suarez-Guevara, V. Ruiz and P. Gomez-Romero, Phys. Chem. Chem. Phys., 2014, 16, 20411–20414 RSC.
- K. Kume, N. Kawasaki, H. Wang, T. Yamada, H. Yoshikawa and K. Awaga, J. Mater. Chem. A, 2014, 2, 3801 CAS.
- T. F. Otero, S. A. Cheng, E. Coronado, E. M. Ferrero and C. J. Gomez-Garcia, Chemphyschem, 2002, 3, 808–811 CrossRef CAS PubMed.
- P. Gómez-Romero, M. Chojak, K. Cuentas-Gallegos, J. A. Asensio, P. J. Kulesza, N. Casañ-Pastor and M. Lira-Cantú, Electrochem. Commun., 2003, 5, 149–153 CrossRef.
- C. Xia, Y. Xie, H. Du and W. Wang, J. Nanopart. Res., 2015, 17, 30 CrossRef.
- M. Genovese and K. Lian, Curr. Opin. Solid State Mater. Sci., 2015, 19, 126–137 CrossRef CAS.
- Z. M. Cui, C. X. Guo, W. Y. Yuan and C. M. Li, Phys. Chem. Chem. Phys., 2012, 14, 12823–12828 RSC.
- C. Xia, Y. Xie, W. Wang and H. Du, Synth. Met., 2014, 192, 93–100 CrossRef CAS.
- P. Ranka, V. Sethi and A. Q. Contractor, Thin Solid Films, 2016, 615, 44–55 CrossRef CAS.
- G. Niaura, R. Mazeikiene and A. Malinauskas, Synth. Met., 2004, 145, 105–112 CrossRef CAS.
- T. S. Radoman, J. V. Dzunuzovic, B. N. Grgur, M. M. Gvozdenovic, B. Z. Jugovic, D. S. Milicevic and E. S. Dzunuzovic, Prog. Org. Coat., 2016, 99, 346–355 CrossRef CAS.
- J. E. Albuquerque, L. H. C. Mattoso, D. T. Balogh, R. M. Faria, J. G. Masters and A. G. MacDiarmid, Synth. Met., 2000, 113, 19–22 CrossRef CAS.
- K. He, M. Li and L. Guo, Int. J. Hydrogen Energy, 2012, 37, 755–759 CrossRef CAS.
- C. Xia, Y. Xie, W. Wang and H. Du, Synth. Met., 2014, 192, 93–100 CrossRef CAS.
- J. G. Hernández-Cortez, E. López-Salinas, M. Manríquez, J. A. Toledo and M. A. Cortes-Jacome, Fuel, 2012, 100, 144–151 CrossRef.
- M. Baibarac, I. Baltog, I. Smaranda, M. Scocioreanu and S. Lefrant, J. Mol. Struct., 2011, 985, 211–218 CrossRef CAS.
- C. Xia, Y. Xie, Y. Wang, W. Wang, H. Du and F. Tian, J. Appl. Electrochem., 2013, 43, 1225–1233 CrossRef CAS.
- Y. B. Xie and W. Wang, J. Chem. Technol. Biotechnol., 2016, 91, 1403–1412 CrossRef CAS.
- X. Xia, D. Fan, B. An, Y. Cai and Q. Wei, J. Mol. Liq., 2015, 206, 335–337 CrossRef CAS.
- K. Mohanraju, V. Sreejith, R. Ananth and L. Cindrella, J. Power Sources, 2015, 284, 383–391 CrossRef CAS.
- J. Suárez-Guevara, V. Ruiz and P. Gomez-Romero, J. Mater. Chem. A, 2014, 2, 1014–1021 Search PubMed.
- M. Ammam and J. Fransaer, J. Electrochem. Soc., 2011, 158, A14–A21 CrossRef CAS.
- A. M. White and R. C. T. Slade, Synth. Met., 2003, 139, 123–131 CrossRef CAS.
- H. Y. Chen, R. Al-Oweini, J. Friedl, C. Y. Lee, L. Li, U. Kortz, U. Stimming and M. Srinivasan, Nanoscale, 2015, 7, 7934–7941 RSC.
| This journal is © The Royal Society of Chemistry and the Centre National de la Recherche Scientifique 2017 |

