Engineering carrier scattering at the interfaces in polyaniline based nanocomposites for high thermoelectric performances†
Liming
Wang
abc,
Qin
Yao
*ab,
Wei
Shi
abc,
Sanyin
Qu
ab and
Lidong
Chen
*abd
aState Key Laboratory of High Performance Ceramics and Superfine Microstructure, Shanghai Institute of Ceramics, Chinese Academy of Sciences, Shanghai 200050, China. E-mail: yaoqin@mail.sic.ac.cn; cld@mail.sic.ac.cn
bCAS Key Laboratory of Materials for Energy Conversion, Shanghai Institute of Ceramics, Chinese Academy of Sciences, Shanghai 200050, China
cUniversity of Chinese Academy of Sciences, Beijing 100049, China
dShanghai Institute of Materials Genome, Shanghai 200050, China
First published on 1st November 2016
Abstract
We have developed a novel strategy to in situ synthesize water-soluble ternary PANI/SWNT/Te nanocomposites with uniform structures and high thermoelectric (TE) properties. An abnormally high Seebeck coefficient was obtained for the ternary PANI/SWNT/Te nanocomposite films due to the energy filtering effect at the interfaces of PANI/SWNTs and PANI/Te, while the electrical conductivity still remained relatively high. As a result, the TE power factor of the ternary composite films was up to 101 μW m−1 K−2, which was much higher than that of the individual components (PANI, SWNTs and Te nanorods). Moreover, a TE module made up of the ternary PANI/SWNT/Te nanocomposite films was fabricated, which was able to generate a high power density of 62.4 μW cm−2. Our results reveal a successful approach through designing the nanostructures and energy barriers of ternary nanocomposites to improve the TE properties of PANI.
Introduction
The direct conversion between thermal energy and electrical energy based on thermoelectric (TE) effects without any moving parts is attractive because of their large potential to both power generation and electronic cooling devices.1,2 The efficiency of TE energy conversion can be evaluated via the dimensionless figure of merit, ZT = S2σT/κ, where S is the Seebeck coefficient, σ is the electrical conductivity, κ is the thermal conductivity and T is the absolute temperature, respectively. The most widely used TE materials are conventional inorganic semiconductors and metal alloys such as Bi2Te3, PbTe and SiGe due to their high TE power factor (S2σ).3,4 However, both the relatively high cost and the difficulty of processing these flexible materials limit the wide range of applications of conventional inorganic TE materials.5–7In recent years, conducting polymers such as polyaniline (PANI), poly(3-hexylthiophene) (P3HT) and poly(3,4-ethylenedioxythiophene) (PEDOT) have been of increasing interest as a new type of TE materials due to their low cost, light weight, flexibility, easy synthesis and intrinsic low thermal conductivity.8–22 The TE properties and the corresponding methods to enhance the TE properties of the conducting polymers have been widely studied, such as enhancing the molecular chain ordering,23 controlling the doping level,13,24 or compounding conducting polymers with organic or inorganic fillers to prepare binary nanocomposites.3,8,25,26 Among them, the last has emerged as a promising strategy to gain factorial enhancement in ZT, owing to the reduction in κ arising from enhanced phonon scattering at interfaces, and the increase in S2σ resulting from the combination of unique properties of the individuals.27–33 More importantly, the Seebeck coefficient of the nanocomposites can be largely enhanced due to the energy filtering effect, in which only carriers with high energy are preferentially allowed to cross the energy barrier at the interfaces.8,26,32–34
Most recently, rational preparation of multiphase nanocomposites has started to attract attention for the successful engineering of carrier scattering within the system. By modulating the energy barrier and designing the nanostructure in multiphase nanocomposites, large gains in the Seebeck coefficient can be realized while only a modest decrease in electrical conductivity occurs.35 For example, up to 22% enhancement of the power factor was reported in PEDOT:PSS/Te-Cu1.75Te nanocomposites resulting from the preferential scattering of low energy carriers.35 Likewise, Kim et al.36 obtained a high power factor of 143 μW m−1 K−2 at 300 K in ternary PEDOT/graphene/Te hybrids based on double carrier filtering processes at the interfaces. However, successful examples of multiphase polymer based nanocomposites with a high TE performance are very few in number and typically involve PEDOT. More successful cases are expected to demonstrate its universality, especially in other promising candidates for organic TE materials such as PANI.
In this work, we report ternary PANI based nanocomposites with high TE properties based on the effective energy filtering effect for the first time, by using poly(styrenesulfonic acid) (PSSA) doped PANI as the polymer matrix while using single-walled carbon nanotubes (SWNTs) and Te nanorods as the fillers. The Seebeck coefficient of the ternary nanocomposite films was significantly higher than the calculated values according to the mixture rule, while the electrical conductivity of the ternary nanocomposite films was normal. Under the optimal conditions, the ternary nanocomposite films displayed an excellent power factor of 101 μW m−1 K−2, which was much higher than that of the individual components (PANI films, SWNT films, and Te nanorod films).
Experimental
Reagents
SWNTs were purchased from Chengdu Organic Chemicals Co. Ltd, Chinese Academy of Sciences (purity >95 wt%, outer diameter = 1–2 nm). PSSA solution was purchased from Sigma-Aldrich, Mw = ∼75![[thin space (1/6-em)]](https://www.rsc.org/images/entities/char_2009.gif) 000, 18 wt% in H2O. The monomer of aniline and ammonium persulfate ((NH4)2S2O8) was purchased from Sinopharm Chemical Reagent Co. Ltd. Sodium tellurite (Na2TeO3, 99.5%) and ascorbic acid (C6H8O6, 99+%) were obtained from Alfa Aesar.
000, 18 wt% in H2O. The monomer of aniline and ammonium persulfate ((NH4)2S2O8) was purchased from Sinopharm Chemical Reagent Co. Ltd. Sodium tellurite (Na2TeO3, 99.5%) and ascorbic acid (C6H8O6, 99+%) were obtained from Alfa Aesar.
Synthesis of PANI/SWNT nanocomposites
PANI/SWNT nanocomposites were synthesized via in situ polymerization of aniline with (NH4)2S2O8 as the oxidant in the presence of SWNTs. Specifically, a solution of PSSA containing 0.5 g SWNTs was sonicated at room temperature for 2 h. Then 0.5 mL aniline was added to form the aniline/SWNT/PSSA suspension by stirring for 0.5 h. After that, 1 g of APS in 4 mL of the PSSA solution was slowly added in a dropwise manner to the well-stirred suspension within 20 min. The polymerization reaction was carried out at 0 °C by stirring for 12 h in an ice bath. Finally, the products were centrifuged and dried in a vacuum desiccator at 60 °C for 24 h. PSSA doped PANI was synthesized using the same process as described above, without using SWNTs during polymerization. The SWNT content was calculated to be 52 wt%, based on the initial weight of SWNTs and the final weight of the obtained PANI/SWNT nanocomposites.Synthesis of PANI/SWNT/Te nanocomposites
5.6 mmol C6H8O6, 0.3 mmol Na2TeO3 and different masses of the as-prepared PANI/SWNT nanocomposites were dissolved in 40 mL of deionized water forming a milky-white bluish solution.31,33 Then the solution was stirred at 90 °C for 15 h. After cooling, the PANI/SWNT/Te nanocomposite solution was obtained. The PANI/Te nanocomposite solution was synthesized using PSSA doped PANI instead of PANI/SWNTs using the same process as described above. Te nanorods were synthesized without using PANI or PANI/SWNTs using the same process as described above. The Te contents were estimated according to the initial weight of PANI/SWNTs and the stoichiometric ratio of Te in the reactant.Preparation of PANI, SWNTs, Te nanorods, PANI/Te and PANI/SWNT/Te nanocomposite films
SWNT films and Te nanorods films were prepared via filtration of their suspensions. The PANI films, PANI/Te and PANI/SWNT/Te nanocomposite films were prepared by directly dropping the as-prepared PANI, PANI/Te and PANI/SWNT/Te solutions on glass substrates and drying at 35 °C in the air, respectively. The glass substrates were pre-cleaned via sequential sonication in deionized water and ethanol each for several minutes.Characterization
The morphology of the synthesized samples was characterized using scanning electron microscopy (Zeiss Supra 55) and transmission electron microscopy (JEM-2100F). The X-ray diffraction (XRD) patterns of the films were examined using an X-ray diffractometer (Bruker D8 Advance). FT-IR spectra were collected on an IN10 spectrometer (Thermo Scientific). Raman spectra were obtained using a Raman spectrometer (JY LabRam-1B, λexc = 632.8 nm). Electrical conductivity and the Seebeck coefficient were tested in the in-plane direction using a method previously reported.37 Carrier concentration and carrier mobility were measured using a four-point probe method in van der Pauw configuration with an Accent HL5500 Hall System at room temperature. Thermal conductivity of the synthesized ternary nanocomposite films was measured along the out-of-plane direction using a laser flash technique.38 The thickness of all films was confirmed using a Dektak profilometer.Results and discussion
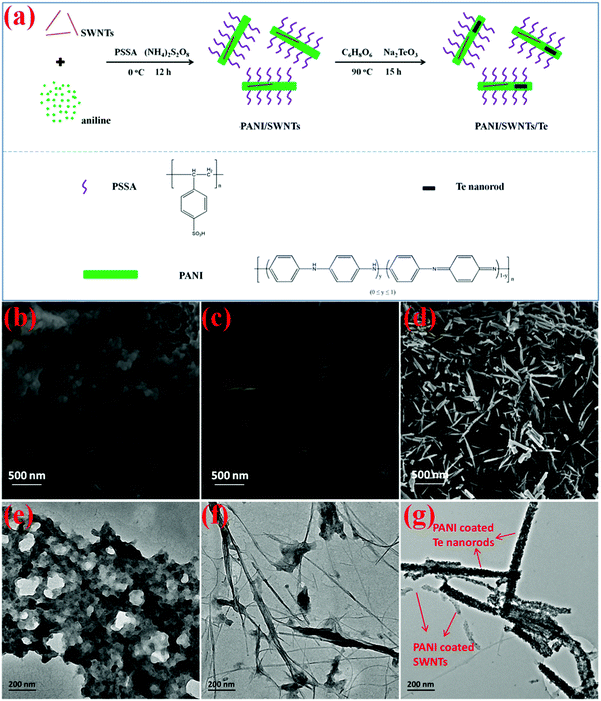
In order to construct different energy barriers in PANI based nanocomposites, both SWNTs and Te nanorods with quasi-one-dimensional nanostructures were used as fillers. Moreover, their respective high electrical conductivity and high Seebeck coefficient provided the potential for improving both the electrical conductivity and the Seebeck coefficient of the nanocomposites. We developed a facile preparation procedure of the ternary PANI/SWNT/Te nanocomposites with homogeneous structures in aqueous solution as illustrated in Fig. 1a. Briefly, SWNTs and aniline were firstly mixed into the PSSA solution under sonication and stirring. PSS− in the solution acted as an ionic surfactant to modify the SWNTs, thereby improving the dispersion of the SWNTs. Aniline monomers would be absorbed on the surfaces of the SWNTs due to strong π–π interactions. After polymerization, PSSA doped PANI enwrapped SWNTs and PSS− groups made the synthesized PANI/SWNT nanocomposites water-soluble. Then, Te nanorods were in situ synthesized in the PANI/SWNT nanocomposite solution, by using Na2TeO3 as a precursor and C6H8O6 as a reductant, respectively. As a result, a core–shell structure was constructed with water-soluble PANI as shells, and SWNTs and Te nanorods as cores. All the synthesized samples were not only soluble but also formed a stable suspension in liquid over one week, as shown in Fig. S1 (ESI†). Ternary PANI/SWNT/Te nanocomposite films can be fabricated through a drop-casting method by directly using the as-prepared nanocomposite solutions. The resulting PANI/SWNT/Te nanocomposite films were smooth and of a high quality (Fig. S2, ESI†).The microstructural morphology of the prepared PANI, PANI/SWNT nanocomposites and PANI/SWNT/Te nanocomposites was characterized using SEM and TEM. Observed from the SEM image (Fig. 1b) and the TEM image (Fig. 1e), the prepared PANI exhibited a granular structure dozens of nanometers in diameter. Meanwhile, there were some small pores on the surface of the PANI film. When polymerized with SWNTs, the SWNTs were well dispersed and formed a 3D network in the PANI matrix, as shown in Fig. 1c and f. For the ternary PANI/SWNT/Te nanocomposites, SWNTs and Te nanorods can be seen in the PANI matrix from the SEM image of the nanocomposite film (Fig. 1d). The Te nanorods showed a uniform structure 25–50 nm in diameter and 0.5–1 μm in length (Fig. 1d and Fig. S3, ESI†). Both the SWNTs and Te nanorods were coated with PANI, forming core–shell structures with a large quantity of PANI/SWNTs and PANI/Te interfaces in the ternary nanocomposites, as shown in Fig. 1g. The microstructural morphology results suggest that the water-soluble and uniform ternary PANI/SWNT/Te nanocomposites were successfully fabricated with water-soluble PANI molecules growing and enwrapping on the surfaces of SWNTs and Te nanorods.
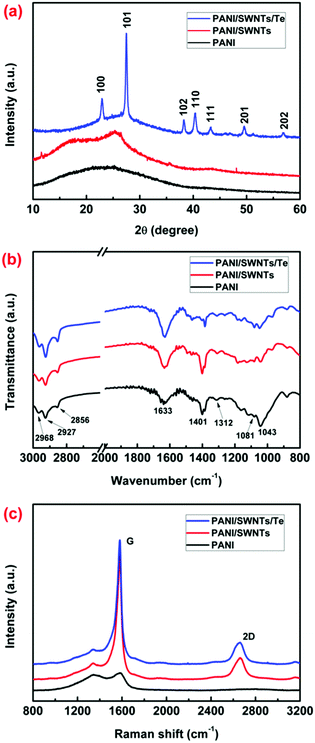
Furthermore, XRD patterns, FT-IR spectra, and Raman spectra were collected to demonstrate the components of the synthesized samples. Fig. 2a presents the XRD patterns of the PANI film, the PANI/SWNT nanocomposite film, and the PANI/SWNT/Te nanocomposite film. The XRD pattern of the PANI film did not have obvious peaks due to the amorphous structure. The XRD pattern of the PANI/SWNT nanocomposite film exhibited a broad diffraction peak at 2θ = 25.6°, which is derived from the (002) graphite plane of the SWNTs. In the case of the PANI/SWNT/Te samples (see Fig. 2a and Fig. S4, ESI†), several obvious peaks were observed, which were hexagonal tellurium diffraction peaks with all peaks matching those in the reference JCPDS card (No. 36-1452).39,40 The PANI molecular structure in all samples were characterized via FT-IR measurements. As shown in Fig. 2b, no obvious difference was observed in the FT-IR spectra of the PANI film, the PANI/SWNT nanocomposite film, and the PANI/SWNT/Te nanocomposite film. The peaks at 1633 cm−1 and 1312 cm−1 correspond to the C![[double bond, length as m-dash]](https://www.rsc.org/images/entities/char_e001.gif) C stretching of the quinoid rings and the C–N stretching in the PANI molecular chains. The three peaks of C–H stretching vibration at 2968 cm−1, 2927 cm−1 and 2856 cm−1, as well as the peak of C–H bending vibration at 1401 cm−1 proved the presence of PSS− in the composites. In addition, the presence of PSS− in the composites was also confirmed by the peaks of asymmetric and symmetric S
C stretching of the quinoid rings and the C–N stretching in the PANI molecular chains. The three peaks of C–H stretching vibration at 2968 cm−1, 2927 cm−1 and 2856 cm−1, as well as the peak of C–H bending vibration at 1401 cm−1 proved the presence of PSS− in the composites. In addition, the presence of PSS− in the composites was also confirmed by the peaks of asymmetric and symmetric S![[double bond, length as m-dash]](https://www.rsc.org/images/entities/char_e001.gif) O stretching at 1081 cm−1 and 1043 cm−1, respectively.41Fig. 2c shows the Raman spectra of the synthesized samples. Compared with the PANI film, the G band and 2D band of the SWNTs were observed in the PANI/SWNT nanocomposite film and the PANI/SWNT/Te nanocomposite film. All these results demonstrate that the ternary PANI/SWNT/Te nanocomposite films were successfully prepared.
O stretching at 1081 cm−1 and 1043 cm−1, respectively.41Fig. 2c shows the Raman spectra of the synthesized samples. Compared with the PANI film, the G band and 2D band of the SWNTs were observed in the PANI/SWNT nanocomposite film and the PANI/SWNT/Te nanocomposite film. All these results demonstrate that the ternary PANI/SWNT/Te nanocomposite films were successfully prepared.
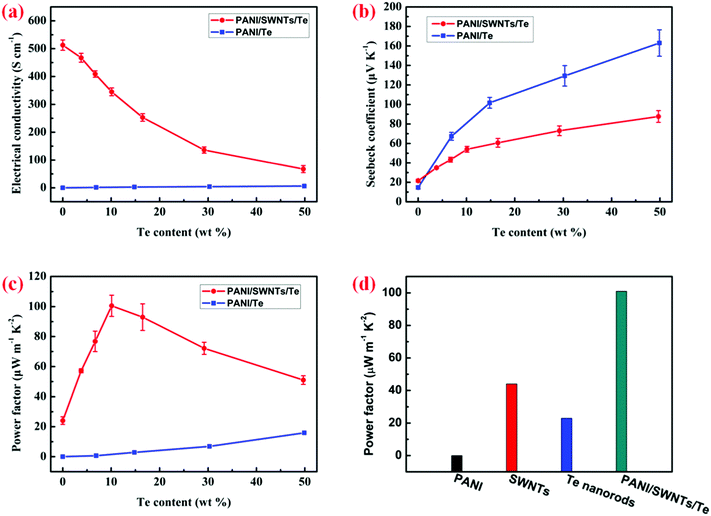
The in-plane electrical conductivity, the Seebeck coefficient and the power factor of the PANI/SWNT/Te nanocomposite films as a function of Te content are shown in Fig. 3. As a comparison, PANI/Te nanocomposite films were also prepared and their TE properties are shown in Fig. 3. The electrical conductivity and the Seebeck coefficient of the PANI/Te nanocomposite films simultaneously increased with the increase in Te content. The optimal power factor of the PANI/Te nanocomposite films reached 16 μW m−1 K−2 with 50 wt% Te content, which may be ascribed to the higher electrical conductivity and the Seebeck coefficient of the Te nanorods (∼2 S cm−1 and ∼340 μV K−1) compared with the PANI film. For the PANI/SWNT/Te nanocomposite films, the electrical conductivity and the Seebeck coefficient showed an inverse variation trend with the content of Te nanorods. The electrical conductivity of the PANI/SWNT/Te nanocomposite films decreased with the increase in Te content. This was mainly because of the low carrier concentration and carrier mobility of the Te nanorods, as both the carrier concentration and carrier mobility of the ternary PANI/SWNT/Te composite films decreased with increasing Te content (Fig. S5, ESI†). Meanwhile, the Seebeck coefficient increased with the increase in Te content due to the high Seebeck coefficient of the Te nanorods. Consequently, the power factor firstly increased with increasing Te content, then decreased when the Te content was above 10%. At the optimal Te content of 10 wt%, the ternary composite film had a relatively high electrical conductivity of 345 S cm−1 and a relatively high Seebeck coefficient of 54 μV K−1, leading to a maximum power factor up to 101 μW m−1 K−2, which was much higher than that of the individual components (PANI, SWNTs and Te nanorods), as shown in Fig. 3d.
The electrical conductivity and the Seebeck coefficient of a binary composite system can be estimated based on either the parallel or series connected mixture model, and the measured values were generally between the values based on a parallel connected mixture model and the values based on a series connected mixture model.42 The PANI/SWNT/Te hybrids can be regarded as the PANI/SWNT matrix compounding with the Te nanorods. So the electrical conductivity and the Seebeck coefficient of the PANI/SWNT/Te hybrid films can be calculated using the following expressions:
| σ(parallel) = σTexTe + σP/C(1 − xTe) | (1) |
 | (2) |
 | (3) |
 | (4) |
 | (5) |
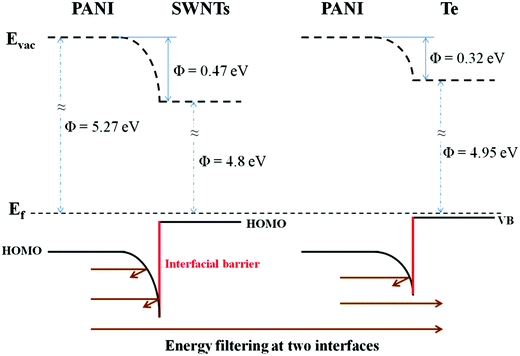
The calculated electrical conductivity and the Seebeck coefficient of the PANI/SWNT/Te nanocomposite films are listed in Tables 1 and 2, respectively. The experimental electrical conductivity of the PANI/SWNT/Te nanocomposite films was between the calculated values (see Table 1); while the experimental Seebeck coefficient of the ternary nanocomposite films was significantly larger than both S(parallel) and S(series), as given in Table 2. For instance, the Seebeck coefficient of the PANI/SWNT/Te composite film with a 10 wt% Te content was measured to be 54 μV K−1, which is about two times of the calculated value (22–27 μV K−1). Previous studies have indicated that the energy filtering effect existed in organic/inorganic nanocomposites, and that carriers with a high energy were preferentially allowed to cross the energy barrier at the interface, thereby leading to an enhancement in the Seebeck efficient.8,33 This effect was more effective when the additives possessed one-dimensional morphology.32 In the present ternary nanocomposites, both the SWNTs and Te nanorods had a one-dimensional morphology, and two different interfaces (PANI/SWNTs and PANI/Te) occurred. The obvious enhancement in the Seebeck coefficient of the PANI/SWNT/Te nanocomposite films may be attributed to the synergetic energy filtering effect at the two interfaces of PANI/SWNTs and PANI/Te. The PANI/SWNT and PANI/Te interfacial band diagram is illustrated in Fig. 4. The band gap of bulk Te was 0.33 eV and the Fermi level (Ef) was close to the valence band (VB).43 The work function of the Te nanorods was assumed to be 4.95 eV, the same as that of bulk Te.36 The work functions of PSSA doped PANI and SWNTs were assumed to be 5.27 eV and 4.8 eV according to previous reports.44,45 Qualitatively, two different interfacial energy barriers at the PANI/SWNT and PANI/Te interfaces effectively scattered carriers with a low energy, and high-energy carriers were selectively allowed to cross. As a result, the Seebeck coefficient as well as the power factor of the PANI/SWNT/Te nanocomposite films was greatly enhanced. It is noteworthy that further precise and direct experimental results are needed to better illustrate the energy filtering effect.
| Te weight fraction (wt%) | σ(experimental) (S cm−1) | σ(parallel) (S cm−1) | σ(series) (S cm−1) |
|---|---|---|---|
| 4 | 492 | 502 | 77 |
| 10 | 345 | 484 | 34 |
| 16 | 253 | 466 | 21 |
| 30 | 136 | 418 | 11 |
| Te weight fraction (wt%) | S(experimental) (μV K−1) | S(parallel) (μV K−1) | S(series) (μV K−1) |
|---|---|---|---|
| 4 | 35 | 22 | 24 |
| 10 | 54 | 22 | 27 |
| 16 | 61 | 22 | 30 |
| 30 | 73 | 22 | 39 |
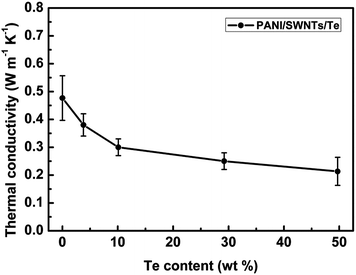
The in-plane thermal conductivity of the thin films is difficult to accurately measure based on our experimental equipment. The thermal conductivity of all the films is measured in the out-of-plane direction at room temperature and the corresponding results are given in Fig. 5. All the ternary PANI/SWNT/Te composite films displayed very low thermal conductivity in the range of 0.2−0.4 W m−1 K−1. The low thermal conductivity can be attributed to the fact that there were SWNTs and Te nanorods of variable nanometric diameters embedded in the PANI matrix. They would act as effective scattering centers for phonons and then decrease the thermal conductivity (as illustrated in Fig. S6, ESI†). Table 3 lists a comparison of the room-temperature TE properties of some typical conducting polymer based hybrid materials with the water-soluble ternary PANI/SWNT/Te hybrids in this work. Obviously, the TE properties of the PANI/SWNT/Te composite films were at a high level and their good water-solubility made them more competitive.
| Materials | Electrical conductivity (S cm−1) | Seebeck coefficient (μV K−1) | Thermal conductivity (W m−1 K−1) | Power factor (μW m−1 K−2) | Solvent | Ref. |
|---|---|---|---|---|---|---|
| PANI/SWNTs | 31.53 | 45.4 | 6.50 | Water | 46 | |
| PANI/SWNTs | 769 | 65 | 0.43 | 176 | m-Cresol | 28 |
| PANI/Te | 102 | 102 | 0.21 | 105 | m-Cresol | 29 |
| PEDOT:PSS/SWNTs | 400 | 25 | ∼0.4 | 25 | Water | 7 |
| PEDOT:PSS/Te | 19.3 | 163 | 0.22–0.3 | 70.9 | Water | 33 |
| PANI/SWNT/Te | 345 | 54 | 0.3 | 101 | Water | This work |
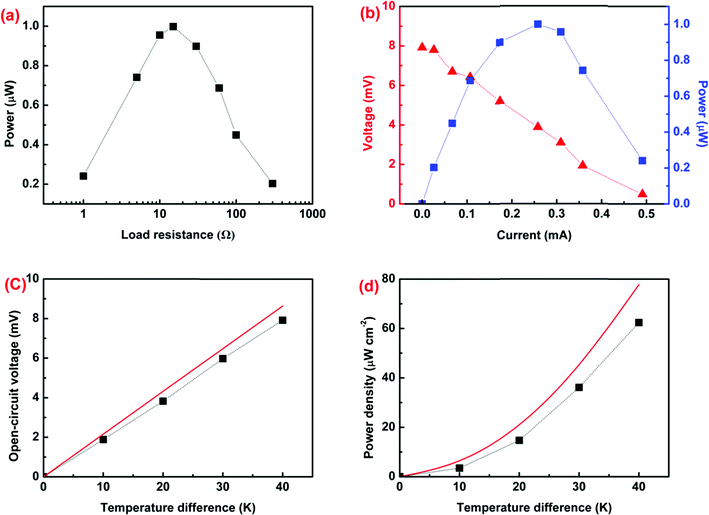
Subsequently, a TE module composed of a series connected 4 p-type legs was fabricated using the ternary PANI/SWNT/Te nanocomposite films with a 10 wt% Te content, as shown in Fig. S7 (ESI†). No n-type leg was used. The 4 p-type legs were connected using silver adhesive. Each leg was ∼50 mm long, ∼20 mm wide, and ∼20 μm thick. The module resistance was measured to be ∼15 Ω. To measure the output power, a variable load resistance was in series with the prepared module. The maximum output power reached 1 μW at ΔT = 40 K when the load resistance matched the resistance of the module (Fig. 6a). The output voltage increased almost proportionally to ΔT while the output power was in a parabolic curve relationship with current (Fig. 6b). Fig. 6c and d show the open-circuit voltage and power density of the thermoelectric module as a function of temperature difference for the measured results and the ideal model. The measured open-circuit voltage and power density of the TE module were only slightly lower than the ideal values due to inevitable contact resistance. Finally, the module was capable of attaining a power density of 62.4 μW cm−2 at ΔT = 40 K.
Conclusions
In summary, we present the rational design of ternary PANI/SWNT/Te hybrid films. Both SWNTs and Te nanorods were coated with PANI to form two heterojunctions at PANI/SWNTs and PANI/Te. The two interfaces with controlled interfacial energy barriers can act as energy filters to scatter low-energy carriers. As a result, the ternary nanocomposite films showed a significantly increased Seebeck coefficient without a large loss of electrical conductivity. The maximum power factor of the ternary nanocomposite films was up to 101 μW m−1 K−2, which was much higher than that of the individual components (P-PANI, SWNTs and Te nanorods). Many other fillers with high electrical conductivity such as graphene, and fillers with a high Seebeck coefficient such as Bi2Te3, could also be used to design ternary organic-inorganic composite TE materials with excellent properties following this general synthesis route.Acknowledgements
This work was supported by the National Key Technologies R&D Program of China (2016YFA0201103), the National Basic Research Program of China (973 Program) (2013CB632500), the Key Research Program of Chinese Academy of Sciences (Grant no. KGZD-EW-T06) and a research grant from the Shanghai government (No.15JC1400301).References
- G. J. Snyder and E. S. Toberer, Nat. Mater., 2008, 7, 105 CrossRef CAS PubMed.
- C. Gao and G. Chen, Compos. Sci. Technol., 2016, 124, 52 CrossRef CAS.
- K. Xu, G. Chen and D. Qiu, J. Mater. Chem. A, 2013, 1, 12395 CAS.
- L. Wang, Q. Yao, H. Bi, F. Huang, Q. Wang and L. Chen, J. Mater. Chem. A, 2014, 2, 11107 CAS.
- C. Yu, Y. S. Kim, D. Kim and J. C. Grunlan, Nano Lett., 2008, 8, 4428 CrossRef CAS PubMed.
- C. Wan, X. Gu, F. Dang, T. Itoh, Y. Wang, H. Sasaki, M. Kondo, K. Koga, K. Yabuki, G. J. Snyder, R. Yang and K. Koumoto, Nat. Mater., 2015, 14, 622 CrossRef CAS PubMed.
- D. Kim, Y. Kim, K. Choi, J. C. Grunlan and C. H. Yu, ACS Nano, 2010, 4, 513 CrossRef CAS PubMed.
- C. Z. Meng, C. H. Liu and S. S. Fan, Adv. Mater., 2010, 22, 535 CrossRef CAS PubMed.
- Q. Yao, L. D. Chen, W. Q. Zhang, S. C. Liufu and X. H. Chen, ACS Nano, 2010, 4, 2445 CrossRef CAS PubMed.
- Q. Zhang, W. Wang, J. Li, J. Zhu, L. Wang, M. Zhu and W. Jiang, J. Mater. Chem. A, 2013, 1, 12109 CAS.
- C. Cho, B. Stevens, J.-H. Hsu, R. Bureau, D. A. Hagen, O. Regev, C. Yu and J. C. Grunlan, Adv. Mater., 2015, 27, 2996 CrossRef CAS PubMed.
- L. Wang, Q. Yao, H. Bi, F. Huang, Q. Wang and L. Chen, J. Mater. Chem. A, 2015, 3, 7086 CAS.
- O. Bubnova, Z. U. Khan, A. Malti, S. Braun, M. Fahlman, M. Berggren and X. Crispin, Nat. Mater., 2011, 10, 429 CrossRef CAS PubMed.
- G. H. Kim, L. Shao, K. Zhang and K. P. Pipe, Nat. Mater., 2013, 12, 719 CrossRef CAS PubMed.
- C.-K. Mai, R. A. Schlitz, G. M. Su, D. Spitzer, X. Wang, S. L. Fronk, D. G. Cahill, M. L. Chabinyc and G. C. Bazan, J. Am. Chem. Soc., 2014, 136, 13478 CrossRef CAS PubMed.
- B. Russ, M. J. Robb, F. G. Brunetti, P. L. Miller, E. E. Perry, S. N. Patel, V. Ho, W. B. Chang, J. J. Urban, M. L. Chabinyc, C. J. Hawker and R. A. Segalman, Adv. Mater., 2014, 26, 3473 CrossRef CAS PubMed.
- N. Toshima, K. Oshima, H. Anno, T. Nishinaka, S. Ichikawa, A. Iwata and Y. Shiraishi, Adv. Mater., 2015, 27, 2246 CrossRef CAS PubMed.
- G. H. Kim, D. H. Hwang and S. I. Woo, Phys. Chem. Chem. Phys., 2012, 14, 3530 RSC.
- L. Liang, G. Chen and C.-Y. Guo, Mater. Chem. Front, 2017 10.1039/c6qm00061d.
- W. J. Wang, Q. H. Zhang, J. L. Li, X. Liu, L. J. Wang, J. J. Zhu, W. Luo and W. Jiang, RSC Adv., 2015, 5, 8988 RSC.
- W. J. Wang, S. P. Sun, S. J. Gu, H. W. Shen, Q. H. Zhang, J. J. Zhu, L. J. Wang and W. Jiang, RSC Adv., 2014, 4, 26810 RSC.
- B. Abad, I. Alda, P. Diaz-Chao, H. Kawakami, A. Almarza, D. Amantia, D. Gutierrez, L. Aubouy and M. Martin-Gonzalez, J. Mater. Chem. A, 2013, 1, 10450 CAS.
- Q. Yao, Q. Wang, L. Wang, Y. Wang, J. Sun, H. Zeng, Z. Jin, X. Huang and L. Chen, J. Mater. Chem. A, 2014, 2, 2634 CAS.
- O. Bubnova, M. Berggren and X. Crispin, J. Am. Chem. Soc., 2012, 134, 16456 CrossRef CAS PubMed.
- C. Bounioux, P. Diaz-Chao, M. Campoy-Quiles, M. S. Martin-Gonzalez, A. R. Goni, R. Yerushalmi-Rozen and C. Muller, Energy Environ. Sci., 2013, 6, 918 CAS.
- K. Zhang, J. Qiu and S. Wang, Nanoscale, 2016, 8, 8033 RSC.
- Y. Du, S. Z. Shen, K. F. Cai and P. S. Casey, Prog. Polym. Sci., 2012, 37, 820 CrossRef CAS.
- Q. Yao, Q. Wang, L. Wang and L. Chen, Energy Environ. Sci., 2014, 7, 3801 CAS.
- Y. Wang, S. M. Zhang and Y. Deng, J. Mater. Chem. A, 2016, 4, 3554 CAS.
- L. Liang, G. Chen and C.-Y. Guo, Compos. Sci. Technol., 2016, 129, 130 CrossRef CAS.
- S. K. Yee, N. E. Coates, A. Majumdar, J. J. Urban and R. A. Segalman, Phys. Chem. Chem. Phys., 2013, 15, 4024 RSC.
- M. He, J. Ge, Z. Lin, X. Feng, X. Wang, H. Lu, Y. Yang and F. Qiu, Energy Environ. Sci., 2012, 5, 8351 CAS.
- K. C. See, J. P. Feser, C. E. Chen, A. Majumdar, J. J. Urban and R. A. Segalman, Nano Lett., 2010, 10, 4664 CrossRef CAS PubMed.
- K. Zhang, S. Wang, J. Qiu, J. L. Blackburn, X. Zhang, A. J. Ferguson, E. M. Millers and B. L. Weeks, Nano Energy, 2016, 19, 128 CrossRef CAS.
- E. W. Zaia, A. Sahu, P. Zhou, M. P. Gordon, J. D. Forster, S. Aloni, Y. S. Liu, J. H. Guo and J. J. Urban, Nano Lett., 2016, 16, 3352 CrossRef CAS PubMed.
- J. Choi, J. Y. Lee, S.-S. Lee, C. R. Park and H. Kim, Adv. Energy Mater., 2016, 6, 1502181 CrossRef.
- Q. Yao, L. D. Chen, X. C. Xu and C. F. Wang, Chem. Lett., 2005, 34, 522 CrossRef CAS.
- A. Cai, L.-p. Yang, J.-p. Chen, T.-g. Xi, S.-g. Xin and W. Wu, J. Chem. Eng. Data, 2010, 55, 4840 CrossRef CAS.
- U. K. Gautam and C. N. R. Rao, J. Mater. Chem., 2004, 14, 2530 RSC.
- J. Choi, K. Lee, C. R. Park and H. Kim, Carbon, 2015, 94, 577 CrossRef CAS.
- T. Dai and Y. Jia, Polymer, 2011, 52, 2550 CrossRef CAS.
- Y. Gelbstein, J. Appl. Phys., 2009, 105, 023713 CrossRef.
- H. Peng, N. Kioussis and G. J. Snyder, Phys. Rev. B: Condens. Matter Mater. Phys., 2014, 89, 195206 CrossRef.
- S. Suzuki, C. Bower, Y. Watanabe and O. Zhou, Appl. Phys. Lett., 2000, 76, 4007 CrossRef CAS.
- J. Jang, J. Ha and K. Kim, Thin Solid Films, 2008, 516, 3152 CrossRef CAS.
- J. L. Liu, J. Sun and L. Gao, Nanoscale, 2011, 3, 3616 RSC.
Footnote |
| † Electronic supplementary information (ESI) available. See DOI: 10.1039/c6qm00188b |
| This journal is © the Partner Organisations 2017 |

