Dual-encapsulation of octadecanol in thermal/electric conductor for enhanced thermoconductivity and efficient energy storage†
Wenhao
Wu
a,
Ruimin
Yao
a,
Xinyu
Huang
a,
Renjie
Chen
a,
Kai
Li
b,
Song
Gao
a and
Ruqiang
Zou
 *a
*a
aBeijing Key Lab of Theory and Technology for Advanced Battery Materials, Department of Materials Science and Engineering, College of Engineering, Peking University, Beijing, China. E-mail: rzou@pku.edu.cn
bResearch Institute of Chemical Defence, Beijing, China
First published on 24th February 2017
Abstract
Owing to the high energy density of phase change materials, latent heat storage systems have been an effective strategy for the improvement of energy efficiency. The severe limitations of their extensive application are the potential leakage and low thermal conductivity. Herein, we developed a facile dual-encapsulation method to solve the abovementioned problems in the phase change composite composed of octadecanol, a high thermal/electrical conductive macroporous graphite foam and a thin waterborne polyurethane (WPU) film. After dual-encapsulation, the thermal conductivity of the composite was 20 times higher than that of pure phase change material (PCM) octadecanol. As a result, the composite exhibited a reduced supercooling degree and rapid thermal energy charging behaviors, as well as electro-to-heat conversion ability. This study gives a new perspective for the synergistic enhancement of both the thermal and electric conductivity of functional PCMs for thermal energy storage and conversion.
Introduction
As a result of concerns about global warming, energy is one of the most discussed topics in recent decades. Much effort is being put into the exploitation of renewable and sustainable energy resource and the improvement of energy efficiency.1–13 Energy storage is one of the key ways to improve energy efficiency and produce clean energy.14–16 Thermal energy storage, as a traditional means of energy storage in human society, is recognized as one of the efficient means to solve the energy challenge. This is because it can utilize versatile heat sources (e.g. solar irradiation, industrial waste heat or terrestrial heat), and can then be retrieved for direct usage or be incorporated in an electricity generation system.17–24As one of the most promising thermal energy storage means, latent heat storage receives wide attention for its high energy density, wide application ranges and the ability to maintain a constant temperature during operation.25–28 The carrier materials in a latent heat storage system are called phase change materials (PCMs). A classification adapted by A. Abhat in 1983 divides PCMs into two categories: organic and inorganic.29 The advantage of inorganic PCMs is high latent heat and low price, but they suffer from undercooling and phase separation. In addition, organic PCMs have good thermal stability and moderate corrosion.30–32 However, the main problem hindering the application of the latent heat storage system is the low thermal transfer.33,34 To address this problem, various methods including the introduction of additives or encapsulations have been applied.35–37 Different additives such as metal wires, matrices and carbon derivatives have been introduced into PCMs to improve the thermal conductivity.38–41 Xie et al. modified CNT with hydroxide radical functional groups to disperse CNTs homogeneously in palmitic acid. The treated CNTs could improve the composite thermal conductivity in both the solid and liquid state.42 Yang et al. introduced expanded graphite and carbon fiber into paraffin/EVA composite and studied its thermal conductivity in vertical and axial orientation. The carbon additives showed a synergistic enhancement to the thermal conductivity.43 Carbon foam and graphite foam (GF) were employed for constructing a homogeneous energy transport channel for PCMs.44,45 The advantage of graphite foam is the high thermal conductivity and abundant sources. PCMs can be well incorporated in highly porous mesophase pitch-based graphite foam according to previous reports.46–48 However, the pore size of graphite foam is too large to encapsulate all PCMs inside the skeleton.
Herein, we introduce a method that combined macro-porous and high thermal conductive GF with waterborne polyurethane coating to produce shape stabilized phase change composite. Waterborne polyurethane (WPU) was selected to cover the outer surface without affecting its thermal characters. WPU is stable before 100 °C where phase change is not observed, and thus it can be used to prevent PCMs leakage from loading materials. The resulting product showed enhanced thermal conductivity, supercooling suppression, stable thermal storage ability and good electro-to-heat conversion. We expected our experiments to reveal the practical potential of utilizing GF as an encapsulation framework for thermal energy storage.
Materials and methods
Materials
Mesophase pitch and sponge were provided by Huaqiao University. Analytical pure octadecanol was purchased from Sinopharm Chemical Reagent Beijing Co., Ltd. WPU was technical pure.Preparation of the graphite foam
The synthesis process of GF started with a commercial sponge, which was cut into the desired shape and washed to remove the dirt on it. The clean foam was used as a template and was immersed into a molten pitch and sealed in an autoclave. N2 was injected into the autoclave to provide a 5 MPa pressure and protective atmosphere. The autoclave was heated at 500 °C for 5 h to obtain a raw foam, which, after being taken out of the autoclave, was carbonized at 1000 °C with N2 protection in a furnace. The carbon foam was further graphitized at a temperature, as high as 3000 °C, resulting in the final product.Preparation of the phase change composite
The vacuum fusion method was used for the preparation. The size of carbon foam was 50 mm × 16 mm × 5 mm. GF was first clipped into long bars, a few centimeters in length, and covered with a certain amount of octadecanol in a Petri dish. Then, the dish was placed in a vacuum oven and heated to 75 °C. After the GF sank into the molten octadecanol, the pressure was decreased to less than 100 Pa to extract air bubbles in the pores. Later, the pressure was recovered to 1.0 atm. After several cycles between the vacuum and atmosphere, the OCT@GF composite was prepared. At last, the composite was immersed in dilute WPU solution at room temperature and taken out after a few minutes. This process was repeated 3–5 times. The samples with different dipping time and process are shown in Fig. S1 (ESI†).The selected WPU was of room temperature curing type so that it could easily form a film at room temperature. Because WPU was stable and reluctant to organics, it enabled the facile preparation of a shape-stabilized phase change composite. When the OCT@GF was placed in a 100 °C oven for 24 h, it turned out that the appearance of the sample stayed intact and had no mass change. In other words, the WPU coating was good enough to block octadecanol from leakage.
Characterizations
The micro-morphology of OCT@GF was observed by scanning electron microscope (SEM) with Quanta 200FEG, FEI company. The observation was carried out under low vacuum mode (0.1–1.5 Torr) because the electric conductivity of the sample was low, with an emission current of 164 μA and a high voltage of 15 kV. X-ray diffraction (XRD) employed X-Pert3 Powder from PANalytical B.V., in the range of 5°–80°. Fourier transform infrared (FT-IR) absorption spectra were obtained from KBr pellets using Thermo-Fisher Nicolet in the region from 4000 to 300 cm−1. Thermogravimetric analysis (TGA) was performed on SDT-Q600 from TA Instruments to record the mass variation during a temperature elevation rate at 10 °C min−1, while a 100 mL min−1 N2 flow was used. Differential scanning calorimetry (DSC) was conducted under Ar atmosphere at 5 °C min−1. For thermal conductivity, two different methods were used. Octadecanol and OCT@GF were measured by the hot wire method with a thermal conductance meter Xiatech TC3010. However, the hot wire method required tight contact between samples and the detector, and GF was not suitable for the measurement due to its porous surface. Therefore, the thermal conductivity of GF was measured with Discovery Xenon Flash DXF 900 from TA Instruments.The electro-to-heat conversion experiment was performed using a Zennium workstation. The samples were pasted on a copper foil with silver glue, and the electrodes from the electrochemical workstation were clamped to the foil. We recorded the temperature history during the voltage loading via a handle thermal detector DP700 B, RKC company. Recording interval was set as 5 s.
Results and discussion
Morphologies
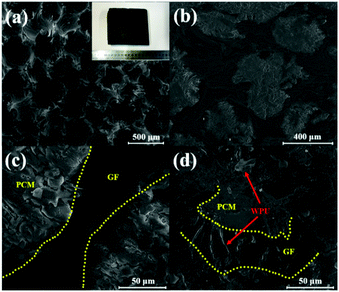
Fig. 1a illustrates the porous feature of GF. The image shows the structure of as-synthesised graphite foam containing secondary carbon domains well-connected to each other. The surface of OCT@GF was black, while some WPU aggregates on it appeared grey, as shown in the inset of Fig. 1a. When OCT@GF was cut in half, white particles of octadecanol could be observed from the cross section of the composite. It can be seen that the scale of GF walls and octadecanol filling is similar, about several hundred micrometers. Octadecanol was well impregnated in GF, as shown in Fig. 1b. Octadecanol and GF can be easily distinguished by the difference of brightness between them, which was depicted with yellow lines in Fig. 1c. It can be concluded from the microstructure that octadecanol filled the channels of GF and had good connection with the foam walls. The close contact and interconnected channel would benefit the heat flow to go through the bulk, resulting in an enhanced heat transfer property. The WPU coating is shown in Fig. 1d, revealing a distinct character from GF or octadecanol. The uniform coating of WPU could cover the open channels of GF and prevented the leakage above octadecanol's phase change temperature.Structure analysis
Fig. 2a revealed the XRD patterns of octadecanol, GF and OCT@GF. The blue pattern belonged to GF, displaying a sharp peak at 27°, which indicated the high crystalline state of graphite. The OCT@GF (red pattern), was a combination of the patterns of GF and octadecanol and showed no appearance of new peaks. The results indicated that there was no other new compound produced during the encapsulation process. Because of the minor dosage, WPU peaks were not even shown in XRD patterns of OCT@GF.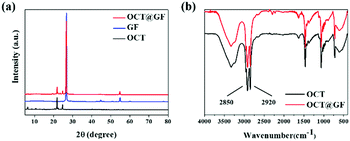 | ||
| Fig. 2 Views of (a) XRD patterns of octadecanol, GF and the composite and (b) FT-IR curves of octadecanol and the composite. | ||
The FT-IR patterns in Fig. 2b showed that the characterizing peak of hydroxyl (2850 and 2920 cm−1) existed in the encapsulated composite, as well as the characterizing peak of octadecanol from 500–1500 cm−1. Since GF did not reveal prominent FT-IR peaks (Fig. S2, ESI†), it can be concluded that no new functional groups appeared. The peak of 2220 cm−1 and 2280 cm−1 that appeared in OCT@GF accounted for the WPU coating.
Thermal properties
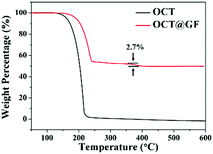
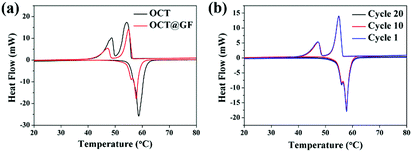
Mass percentage change along with the temperature elevation can exhibit the decomposition temperature and PCM content in composites. As shown in Fig. 3, octadecanol started to lose weight around 120 °C and totally decomposed at 218 °C. OCT@GF lost 47.5% of weight when the temperature reached 270 °C, which represented the content of octadecanol in it. It then continued to lose 2.7% weight because WPU decomposed at a higher temperature. The detailed decomposition character of WPU coating is exhibited in Fig. S3 (ESI†). Although the ratio of WPU was relatively small, it maintained the octadecanol in the GF effectively.The DSC results between octadecanol and OCT@GF are shown in Fig. 4a. Details are listed in Table 1. As observed from the DSC results, the ratio of octadecanol was 55.1% weight in the composite. It was slightly higher than that of the ratio obtained from TGA results (47.5% weight). In this case, the distinction between DSC and TGA cannot be neglected, and hence we used the TGA results to calculate the weight percentage of octadecanol.49 Because the dosage for these tests is on the magnitude of milligrams, certain errors exist for sampling modes. Nevertheless, it can still be concluded that GF did not affect the thermal storage capacity of octadecanol. The GF insertion can reduce the supercooling of octadecanol, from about 1 °C to almost zero, which can be summarized from the onset point difference in Table 1. The reason could be the reduction of the crystallization barrier that came from the rough surface and the high thermal conductivity of GF. This is because the rough surface offered nucleation sites, while the high thermal conductivity could swiftly respond to the environmental temperature change and promote crystallization. It can also be observed from the DSC pattern that the solid–solid endothermal peak of OCT@GF is more significant than that of the pure PCM. The phenomenon is attributed to the high thermal conductivity. To evaluate the thermal stability of OCT@GF, a DSC test was carried out in 20 cycles. The cyclic DSC results in Fig. 4b indicate that the composite had an outstanding stability.
| Sample | Latent heat (J g−1) | Onset point (°C) | Offset point (°C) |
|---|---|---|---|
| Octadecanol (endo) | 235 | 54.7 | 60.7 |
| Octadecanol (exo) | 237 | 55.9 | 51.5 |
| OCT@GF (endo) | 130 | 56.1 | 58.9 |
| OCT@GF (exo) | 130 | 56.3 | 52.8 |
The high crystalline state of GF indicated high thermal conductivity, which was measured as 46.86 W m−1 K−1. The average thermal conductivity of OCT@GF was 5.55 W m−1 K−1, while the thermal conductivity of octadecanol was 0.26 W m−1 K−1. The improvement of thermal conductivity for octadecanol was more than 20 times that of pure octadecanol, and the vast distinction is illustrated in Fig. 5a. We compared our results with other reported values that used carbon foam (CF),44 ultrathin graphite foam (UGF)50 or GF51 to encapsulate organic PCMs, as illustrated in Fig. 5b. It turned out that our OCT@GF showed the largest enhancement of thermal conductivity.
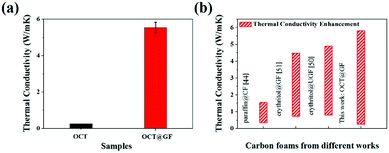 | ||
| Fig. 5 (a) Thermal conductivity comparison of octadecanol and OCT@GF. (b) Comparison of thermal conductivity enhancement of OCT@GF with other studies. | ||
Electro-to-heat conversion of OCT@GF
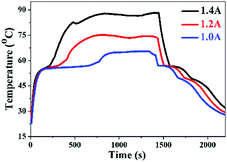
The GF skeleton shows high electron conductivity, and therefore the OCT@GF composite could be applied as new functionality of electro-to-heat energy conversion.45 It should be noted that the insulated WPU coverage shell greatly affects the electro conductivity of the samples as shown in Table S1 (ESI†). To avoid the low electro conductivity of WPU on the shell of GF, we put the electric wires in the two ends into the shell and got direct contact with the GF skeleton for the electro-to-heat conversion test. Different currents (1.0, 1.2 and 1.4 A) for the electro-to-heat conversion test are employed to investigate energy conversion efficiency. Fig. 6 represents the temperature variation versus time. An evident heating platform can be observed in the starting segment of the blue curve, where the phase change took place and stored electrical energy as heat at a constant temperature under a low current, for example, 1.0 A. The temperature continued to climb until the energy input equalled heat dissipation to the environment. After stopping the current loading, the sample started to release heat to the surroundings. The temperature reduction was slowed down when the phase change course of octadecanol began. Two cooling platforms presented in the curve, one represented the time when the liquid state of octadecanol started freezing, and the other represented the frozen octadecanol molecule undergoing a solid–solid transition. The charging process was accelerated by increasing the input current, and immensely shortened the time to reach thermal equilibrium. The electro-to-heat conversion efficiencies were also improved from 32.9% at 1.0 A to 58.5% at 1.2 A, and 61.4% at 1.4 A. Moreover, there was no leakage during the entire process of the electro-to-heat conversion tests, which also proved the good sealing property of WPU.Conclusions
A well-sealed OCT@GF phase change composite was fabricated by dual-encapsulating octadecanol in thermal/electric conductive graphite foam with a small amount of waterborne polyurethane coating. A facile seal method using WPU coating was introduced to solve the leakage problem of solid–liquid phase change materials. The composite presented a massive thermal conductivity enhancement from 0.26 to 5.55 W m−1 K−1 and reduced the supercooling degree. Moreover, the good electro-to-heat conversion behaviours make the composite an ideal candidate for efficient energy conversion and storage.Acknowledgements
The authors thank the Beijing Municipal Science & Technology Commission Program Z151100000915074, the National Natural Science Foundation of China 51322205 and 21371014, the class General Financial Grant from the China Postdoctoral Science Foundation 2016M600863.Notes and references
- D. Y. C. Leung and Y. Yang, Renewable Sustainable Energy Rev., 2012, 16, 1031–1039 CrossRef.
- I. B. Bankovic-Ilie, I. J. Stojkovic, O. S. Stamenkovic, V. B. Veljkovic and Y. T. Hung, Renewable Sustainable Energy Rev., 2014, 32, 238–254 CrossRef.
- L. Dai, C. X. Cao, Y. F. Gao and H. J. Luo, Sol. Energy Mater. Sol. Cells, 2011, 95, 712–715 CrossRef CAS.
- T. Wei, B. C. Zheng, J. Liu, Y. F. Gao and W. H. Guo, Energy Build., 2014, 68, 587–592 CrossRef.
- T. M. I. Mahlia, T. J. Saktisandan, A. Jannifar, M. H. Hasan and H. S. C. Matseelar, Renewable Sustainable Energy Rev., 2014, 33, 532–545 CrossRef.
- J. Du, Y. F. Gao, H. J. Luo, L. T. Kang, Z. T. Zhang, Z. Chen and C. X. Cao, Sol. Energy Mater. Sol. Cells, 2011, 95, 469–475 CrossRef CAS.
- D. C. Hyun, N. S. Levinson, U. Y. Jeong and Y. N. Xia, Angew. Chem., Int. Ed., 2014, 53, 3780–3795 CrossRef CAS PubMed.
- L. Pan, Q. H. Tao, S. D. Zhang, S. S. Wang, J. Zhang, S. Wang, Z. Y. Wang and Z. P. Zhang, Sol. Energy Mater. Sol. Cells, 2012, 98, 66–70 CrossRef CAS.
- P. Fairley, Nature, 2015, 526, S102–S104 CrossRef CAS PubMed.
- L. T. Kang, Y. F. Gao, Z. Chen, J. Du, Z. T. Zhang and H. J. Luo, Sol. Energy Mater. Sol. Cells, 2010, 94, 2078–2084 CrossRef CAS.
- H. Ibrahim, A. Ilinca and J. Perron, Renewable Sustainable Energy Rev., 2008, 12, 1221–1250 CrossRef CAS.
- L. S. Long, H. Ye, Y. F. Gao and R. Q. Zou, Appl. Energy, 2014, 136, 89–97 CrossRef CAS.
- R. C. Armstrong, C. Wolfram, K. P. de Jong, R. Gross, N. S. Lewis, B. Boardman, A. J. Ragauskas, K. Ehrhardt-Martinez, G. Crabtree and M. V. Ramana, Nat. Energy, 2016, 1, 15020, DOI:10.1038/nenergy.2015.20.
- X. J. Xu, H. Ye, Y. X. Xu, M. R. Shen, X. J. Zhang and X. Wu, Appl. Energy, 2014, 113, 924–931 CrossRef.
- H. Ye, L. S. Long, H. T. Zhang and R. Q. Zou, Appl. Energy, 2014, 113, 1118–1126 CrossRef CAS.
- C. Liu, F. Li, L. P. Ma and H. M. Cheng, Adv. Energy Mater., 2010, 22, E28–E62 CrossRef CAS PubMed.
- G. Drenkelfort, S. Kieseler, A. Pasemann and F. Behrendt, Energ. Effic., 2014, 8, 385–402 CrossRef.
- A. Sharma, V. V. Tyagi, C. R. Chen and D. Buddhi, Renewable Sustainable Energy Rev., 2009, 13, 318–345 CrossRef CAS.
- X. Wang, Y. P. Zhang, W. Xiao, R. L. Zeng, Q. L. Zhang and H. F. Di, Chin. Sci. Bull., 2009, 54, 920–928 CAS.
- S. D. Zhang, S. S. Wang, J. Zhang, Y. C. Jiang, Q. Ji, Z. P. Zhang and Z. Y. Wang, J. Phys. Chem. C, 2013, 117, 23412–23417 CAS.
- T. Wei, B. C. Zheng, H. L. Yi, Y. F. Gao and W. H. Guo, Polym. Eng. Sci., 2014, 54, 2872–2876 CAS.
- K. Sarada, T. Jamie, D. Y. Goswami, M. R. Muhammad and K. S. Elias, Prog. Energy Combust. Sci., 2013, 39, 285–319 CrossRef.
- H. J. Wang, C. Y. Qi, E. Y. Wang and J. Zhao, Renewable Energy, 2009, 34, 307–314 CrossRef CAS.
- S. Pintaldi, C. Perfumo, S. Sethuvenkatraman, S. White and G. Rosengarten, Renewable Sustainable Energy Rev., 2015, 41, 975–995 CrossRef CAS.
- Y. Jiang, Z. Wang, M. Shang, Z. Zhang and S. Zhang, Nanoscale, 2015, 7, 10950–10953 RSC.
- K. Pielichowska and K. Pielichowski, Prog. Mater. Sci., 2014, 65, 67–123 CrossRef CAS.
- C. Liu, Z. Zhao, R. L. Zhang, L. Yang, Z. H. Wang, J. W. Yang, H. H. Jiang, M. Y. Han, B. H. Liu and Z. P. Zhang, J. Phys. Chem. C, 2015, 119, 8266–8272 CAS.
- H. Ye and X. Ge, Sol. Energy Mater. Sol. Cells, 2000, 64, 37–44 CrossRef.
- A. Abhat, Sol. Energy, 1983, 30, 313–332 CrossRef CAS.
- B. Zalba, J. M. Marín, L. F. Cabeza and H. Mehling, Appl. Therm. Eng., 2003, 23, 251–283 CrossRef CAS.
- M. F. Mohammed, M. K. Amar, A. K. R. Siddique and A. H. Said, Energy Convers. Manage., 2004, 45, 1597–1615 CrossRef.
- S. Karaman, A. Karaipekli, A. Sarı and A. Biçer, Sol. Energy Mater. Sol. Cells, 2011, 95, 1647–1653 CrossRef CAS.
- J. P. da Cunha and P. Eames, Appl. Energy, 2016, 177, 227–238 CrossRef.
- N. H. S. Tay, M. Liu, M. Belusko and F. Bruno, Renewable Sustainable Energy Rev., 2016 DOI:10.1016/j.rser.2016.10.069.
- A. Sarı and A. Karaipekli, Appl. Therm. Eng., 2007, 27, 1271–1277 CrossRef.
- Z. Chen, J. Wang, F. Yu, Z. Zhang and X. Gao, J. Mater. Chem. A, 2015, 3, 11624–11630 CAS.
- L. Fan and J. M. Khodadadi, Renewable Sustainable Energy Rev., 2011, 15, 24–46 CrossRef CAS.
- S. Jegadheeswaran and S. Pohekar, Renewable Sustainable Energy Rev., 2009, 13, 2225–2244 CrossRef CAS.
- Z. P. Liu, R. Q. Zou, Z. Q. Lin, X. C. Gui, R. J. Chen, J. H. Lin, Y. Y. Shang and A. Y. Cao, Nano Lett., 2013, 13, 4028–4035 CrossRef CAS PubMed.
- L. J. Chen, R. Q. Zou, W. Xia, Z. P. Liu, Y. Y. Shang, J. L. Zhu, Y. X. Wang, J. H. Lin, D. G. Xia and A. Y. Cao, ACS Nano, 2012, 6, 10884–10892 CAS.
- F. Agyenim, N. Hewitt, P. Eames and M. Smyth, Renewable Sustainable Energy Rev., 2010, 14, 615–628 CrossRef CAS.
- J. F. Wang, H. Q. Xie, Z. Xin, Y. Li and L. F. Chen, Sol. Energy, 2010, 84, 339–344 CrossRef CAS.
- B. Q. Tian, W. B. Yang, L. J. Luo, J. H. Wang, K. Zhang, J. Y. Fan, J. Wu and T. Xing, Sol. Energy, 2016, 127, 48–55 CrossRef CAS.
- X. Xiao and P. Zhang, Sol. Energy Mater. Sol. Cells, 2013, 117, 451–461 CrossRef CAS.
- R. J. Chen, R. M. Yao, W. Xia and R. Q. Zou, Appl. Energy, 2015, 152, 183–188 CrossRef CAS.
- K. W. Wierschke, M. E. Franke, R. Watts and R. Ponnappan, J. Thermophys. Heat Transfer, 2006, 20, 865–870 CrossRef CAS.
- Y. J. Zhong, Q. G. Guo, S. Z. Li, J. L. Shi and L. Liu, Sol. Energy Mater. Sol. Cells, 2010, 94, 1011–1014 CrossRef CAS.
- V. Canseco, Y. Anguy, J. J. Roa and E. Palomo, Carbon, 2014, 74, 266–281 CrossRef CAS.
- P. Chaiyasat, S. Noppalit, M. Okubo and A. Chaiyasat, Sol. Energy Mater. Sol. Cells, 2016, 157, 996–1003 CrossRef CAS.
- I. Kholmanov, J. Kim, E. Ou, R. S. Ruoff and L. Shi, ACS Nano, 2015, 9, 11699–11707 CrossRef CAS PubMed.
- M. Karthik, A. Faik, P. Blanco-Rodríguez, J. Rodríguez-Aseguinolaza and B. D'Aguanno, Carbon, 2015, 94, 266–276 CrossRef CAS.
Footnote |
| † Electronic supplementary information (ESI) available: TGA curves of WPU and FT-IR of GF. See DOI: 10.1039/c6qm00381h |
| This journal is © the Partner Organisations 2017 |

