A facile method for the synthesis of a C@MoO2 hollow yolk–shell structure and its electrochemical properties as a faradaic electrode†
Arka
Saha
a,
Aniruddha
Mondal
a,
Sandipan
Maiti
b,
Subhash C.
Ghosh
a,
Sourindra
Mahanty
 *b and
Asit Baran
Panda
*a
aCentral Salt and Marine Chemicals Research Institute (CSIR-CSMCRI) and CSMCRI-Academy of Scientific and Innovative Research, G. B. Marg, Bhavnagar-364002, Gujarat, India. E-mail: abpanda@csmcri.org
bCSIR-Central Glass & Ceramic Research Institute, Raja S C Mullick Road, Kolkata-700032, India. E-mail: mahanty@cgcri.res.in
First published on 6th March 2017
Abstract
Transition-metal oxide hollow yolk–shell micro/nanostructures combined with a conducting substance have gained significant attention as efficient electrode materials for electrochemical energy storage applications due to their large surface area, internal void space, and structural stability. Herein, we report a facile aqueous solution-based soft template method using sucrose–CTAB for the synthesis of a hollow yolk–shell structure of carbon-incorporated MoO2 (C@MoO2) with a diameter of 0.9–1.1 μm, wall thickness of 100 nm, inner yolk size of 400–450 nm, and BET surface area of 40 m2 g−1. During the synthesis process, sucrose plays a dual role, both as a template and a carbon source. The electrochemical charge storage mechanism follows a battery-type behaviour when tested as a faradaic electrode in 3.0 M KOH electrolyte. C@MoO2 exhibits a high specific capacity of 188 C g−1 at the current density of 0.5 A g−1, good rate performance (50.6 C g−1 at 10 A g−1), and 78% retention of capacity after 5000 cycles at 5 A g−1. The obtained performance is superior to those obtained for pure MoO2 hollow spheres (137.1 C g−1 at 0.5 A g−1) as well as previously reported MoO2 and MoO3, indicating the potential applicability of the as-synthesised yolk–shell C@MoO2.
Introduction
In recent years, there has been a strong incentive for the development of low-cost, safe, and high performance energy storage systems to power small electrical devices and for the appropriate utilization of sustainable and renewable energy sources such as solar and wind energy.1,2 Among the developed energy storage systems, pseudocapacitors, so called electrochemical capacitors (ECs), that store electrical energy via reversible redox reactions on the electrode surface or near the surface (Faradaic) have received significant attention due to their high energy density, long cycle stability, and fast charge–discharge characteristics.3–6 Thus, ECs efficiently reduce the energy/power gap between a conventional dielectric capacitor and battery.3–6 Metal oxides, with variable oxidation states, such as RuO2, IrO2, Co3O4, MoO2/O3, NiO, and MnO2 are the ideal candidates and widely studied electrode materials for ECs due to their high intrinsic capacitance.7–15 However, the poor electrical conductivity of these oxides and other shortcomings such as high cost and toxicity associated with the largely used RuO2, IrO2, and Co3O4 are the main obstacles for their large scale commercial use.Oxides of Mo (MoO2/O3) are the most promising materials for EC applications due to their abundance, low-cost, and good electrochemical performance.13,16–29 Since the electrochemical performance is related to the number of redox reactions on the electrode surface or near the surface, extensive research efforts have been made to improve the surface area; in addition, the reaction kinetics and cycling stability may be improved by tuning the size and shape of these materials in the nanometer scale.13,16–29 However, the improvements are still not satisfactory.
Hollow micro-/nanostructures have received a major driving force in present frontier research on the way to develop superior materials for ECs due to their porous structures, inner hollow architectures, high surface areas, and low density.30–36 However, structural collapse during the redox cycle, intercalation, and phase change reduce their performance. The yolk–shell hollow morphology is a special class of hollow-structured materials that contain a distinguishable core@void@shell alignment.37–41 The respective yolk–shell structure shows a reasonable enhancement in its corresponding electrochemical performance. The hollow yolk–shell structures not only provide an inner hollow space but also offer sufficient strength and stability to the hollow structure that prevent structural damage during cycling and in-turn a reasonable enhancement in their corresponding electrochemical performance.37–41
Recent studies have revealed that the incorporation of carbon/graphene/carbon nanotubes/conducting polymer (composite) in the corresponding molybdenum oxide moiety leads to a reasonable improvement in the electrochemical performance via the enhancement in the overall conductivity.42–55 Further, Zheng et al. reported that the specific capacitance of MoO2 rods is superior to that of MoO3 rods, synthesized using an identical method.16 However, reports on MoO2-based ECs are quite rare as compared to those on MoO3. Thus, carbon-incorporated MoO2 hollow structures, specifically yolk–shell structures, may be appropriate materials for ECs with high power density, excellent rate capability, and cycling stability. Although there are reports on carbon based yolk–shell structures based on different materials, to the best of our knowledge, there are no reports on carbon-based yolk–shell hollow spherical structures of MoO2 or MoO3 and their utilization in ECs.
Herein, we report the synthesis of a C@MoO2 hollow yolk–shell structure via a soft template method using CTAB and sucrose as the soft template, ammonium heptamolybdate tetrahydrate as the metal source, and ammonium carbonate as an additive and explored the probable active material for ECs. A specific capacity of 188 C g−1 was achieved at the current density of 0.5 A g−1 for the synthesized C@MoO2 hollow yolk–shell structure, which was much higher than that observed for pure MoO2 (137.1 C g−1). C@MoO2 demonstrates good cycling stability, retaining 78% of its initial capacity after 5000 cycles at the current density of 5 A g−1.
Experimental
Materials
Analytical grade ammonium heptamolybdate tetrahydrate [(NH4)6Mo7O24·4H2O, 99.98%] and cetyltrimethyl ammonium bromide (CTAB, Sigma-Aldrich) were purchased from Sigma-Aldrich; sucrose (C12H22O11) and ammonium carbonate (NH4HCO3 & NH2CO2NH4) were obtained from S. D. Fine Chem., India, and ethanol (C2H5OH, extra pure) was purchased from SRL, India. All chemicals were used as received without further purification. Water was obtained from a Millipore water purifier with the resistivity of 18 MΩ cm and was used for all the reactions.Synthesis of MoO2@C hollow spheres
A 0.195 g of CTAB was dissolved in 35 mL water. Then, an aqueous solution (5 mL) of 1.091 g sucrose was added to the CTAB solution. After stirring for 5 minutes, a separately prepared solution of 0.33 g (0.267 mol) of (NH4)6Mo7O24·4H2O in 5 mL of water was added dropwise to the reaction mixture. A faint white precipitate appeared, which dissolved on addition of ammonium carbonate solution (1 g in 5 mL). After stirring for 10 min, 33 mL of the resulting clear solution was transferred to a 50 mL Teflon-lined stainless steel autoclave, which was tightly sealed and heated at 130 °C for 12 h, followed by heating at 220 °C for 12 h. After naturally cooling down, the resulting black precipitate was collected, washed with deionised water followed by ethanol, and dried in an oven at 70 °C for 24 h. The C@MoO2 composite was obtained after calcination of the dried material at 600 °C for 5 h under a stream of N2 at the scan speed of 5 °C min−1.Characterization
Powder X-ray diffraction patterns were obtained in the 2θ range of 10–80° using a Philips X’pert X-ray powder diffractometer. Thermogravimetric analysis (TGA) was performed using a Mettler-Toledo (TGA/SDTA 851e) apparatus in air at the heating rate of 10 °C min−1. The nitrogen adsorption–desorption measurements were performed at 77 K using an ASAP 2010 Micrometrics, USA instrument and the corresponding determination of the surface area and pore size distribution was performed using the Brunauer–Emmett–Teller (BET) equation and the BJH model of cylindrical pore approximation, respectively. A scanning electron microscope (SEM) (Leo series 1430 VP) equipped with INCA was used to determine the surface morphology of the samples. Transmission electron microscopy (TEM) images were obtained using a JEOL JEM 2100 microscope. DLS measurements were carried out using a Malvern instrument (Zetasizer, Nano series, Nano-ZS90). Calcination of the powdered samples was carried out using a high temperature vacuum tube furnace (MTI, OTF-1200X). For a detailed characterization procedure, please see our previously reported study.56–58For the comparative study of electrochemical applications, pure MoO2 was also synthesized following a similar method without the addition of sucrose and CTAB.
Electrochemical measurements
The working electrodes were fabricated via uniformly mixing 80 wt% of active material (MoO2 or C@MoO2), 10 wt% of SuperP carbon, and 10 wt% of polyvinylidene fluoride (PVDF) in N-methyl-2-pyrrolidone (NMP) to form a viscous slurry, which was then cast on a (2 cm × 2 cm) nickel foam (previously cleaned, thickness ∼0.2 mm). The as-prepared electrodes were immediately transferred into a vacuum oven to evaporate the residual NMP by heating at 110 °C for 4 h. The typical mass loading of the active materials on the Ni foam was about 1.0 mg cm−2, measured using an electronic balance with an accuracy of 0.01 mg (MS105DU, Mettler Toledo, USA). All the electrochemical measurements were conducted using a three-electrode cell configuration where a platinum mesh (2 cm × 2 cm) was used as the counter electrode and a Ag/AgCl (3 M KCl) electrode was used as the reference electrode. A 3.0 M aqueous solution of KOH was used as the electrolyte. Cyclic voltammetry (CV), galvanostatic charge–discharge (GCD), and electrochemical impedance spectroscopy (EIS) were carried out using a galvanostat–potentiostat (PGSTAT 300N, Autolab, the Netherlands). All the CVs were obtained between −0.2 V and 0.5 V at different scan rates (2, 5, 10, 20, 50, and 100 mV s−1). GCD measurements were performed at the current densities of 0.5, 1, 2, 5, 10, and 20 A g−1 in the potential range from 0.0 V to 0.45 V. EIS measurements were carried out over the frequency range of 0.1 Hz–100 kHz with an open circuit potential at an AC amplitude of 10 mV.As the GCD plots do not possess conventional triangular shapes, the specific capacity (Cs) was derived in C g−1 (instead of F g−1) using the following equation, which is applicable for battery-type electrodes exhibiting significant faradaic behaviour:59–61
 | (1) |
Results and discussion
Characterization
Fig. 1 shows the X-ray diffraction pattern of the precursor obtained after hydrothermal treatment and calcined at 600 °C for 5 h under a N2 flow. The diffraction pattern of the as-synthesized material shows the presence of a few distinct peaks with a broad peak at about 2θ value of 20°. All the respective distinct diffraction peaks can readily be indexed to a monoclinic MoO2 system with P21/c space group (JCPDS no. 65-5787; a = 0.56109 nm, b = 0.48562 nm, c = 0.56285 nm, and β = 120.95°). The broad peak at ∼20° can be assigned to amorphous carbon. The results indicate that during the hydrothermal treatment, the molybdenum salt was converted to MoO2 and sucrose was transformed to carbon, as confirmed by the incorporation of carbon in the MoO2 moiety. However, after calcination at 600 °C for 5 h under a N2 flow, no distinct change in the diffraction pattern was observed. The peak intensity for MoO2 was increased due to the enhancement of crystallinity. Due to the enhancement of intensity of the peaks for MoO2, the broad peak for carbon almost disappeared. In the XRD pattern, the absence of any additional peak other than that of monoclinic MoO2 confirmed the formation of phase pure MoO2. The average crystallite sizes of the calcined carbon-incorporated monoclinic MoO2, calculated from X-ray line broadening of all the individual diffractions using Scherrer's equation, was ∼19 nm.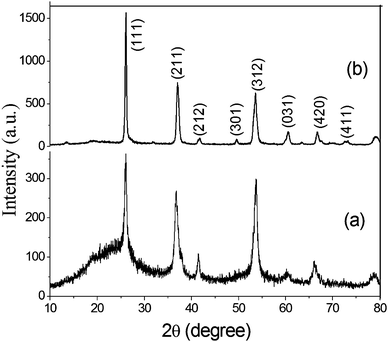 | ||
| Fig. 1 The X-ray diffraction pattern of the synthesized carbon incorporated (a) and calcined (b) MoO2. | ||
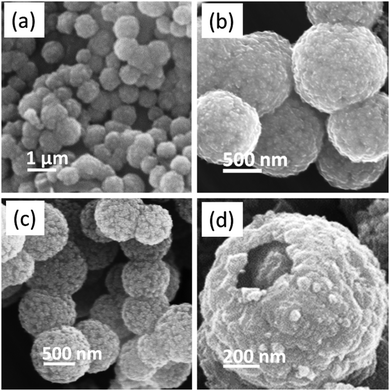
Fig. 2 shows the FE-SEM images of the as-synthesized and calcined samples. The long range overview of the as-synthesized samples at low magnification indicates the formation of separate or assembled spherical structures (Fig. 2a). The magnified images also confirmed the formation of quite uniform spheres and the average diameters of the nearly uniform individual as-synthesized spheres were in the range of 1–1.2 μm (Fig. 2b and Fig. S1, ESI†). No distinct change in the overall spherical morphology was observed after calcination, except for a slight reduction in the average diameter of the spheres (Fig. 2c). The average diameter of the calcined samples was in the range of 0.9–1.1 μm. The surface of the spheres was rough and appeared to be formed by the assembly of small nanoparticles. The hollow space in the broken part of the sphere indicates that the spheres are hollow in nature. Further, in the inner broken part of the sphere, the existence of some solid portion in the hollow space also confirmed the formation of a yolk–shell structure. However, the inner solid part is very rarely identifiable in the FE-SEM images and indicates that the size of the yolk is comparatively smaller than that of the total inner space (Fig. 2d). The wall thickness of the shell was approximately 125 nm, as calculated from the FE-SEM image.
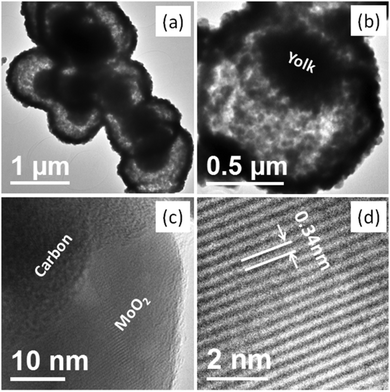
Further morphological and structural confirmation was obtained from the TEM and HR-TEM analysis, as shown in Fig. 3 and Fig. S2 (ESI†). The TEM image of the as-synthesized materials depicts the formation of solid spheres, and no inner hollow space was identified (Fig. S2, ESI†). However, the TEM images of the calcined samples show the formation of the hollow yolk–shell structure (Fig. 3). In the low-resolution TEM images of every sphere, a distinct dark portion in the outer part and inner light portion are clearly identifiable. The outer dark part of the spheres can be ascribed to the shell wall and the inner light part can be ascribed to the hollow space. The dark part in the inner hollow space, the majority in one corner i.e., near one side wall, can be ascribed to the solid portion (the yolk) (Fig. 3a). The average size of the hollow spheres, calculated from magnified TEM images, was in the range from 0.9 to 1.1 μM in width, 100–110 nm in wall thickness, and 400–450 nm inner yolk size. All the results matches well with the SEM results. Herein, note that although a very thin hollow space is identifiable between shell and yolk, they are somehow connected via an interparticle interaction (Fig. 3b). The magnified images depict that the shells were formed by very small nanoparticles with an average particle size of ∼20–25 nm and support the XRD results. The presence of amorphous carbon in the shell wall composed of the MoO2 nanoparticles in the spheres was also confirmed by TEM (Fig. 3c). In the HR-TEM image of the small particles in the shell wall, the presence of distinct lattice fringes confirmed that the synthesized nanoparticles were highly crystalline. In the HR-TEM image, an interplanar distance of 0.34 nm is clearly identifiable, which is in good agreement with the spacing of the (110) plane in monoclinic MoO2 (JCPDS no. 65-5787) (Fig. 3d). The corresponding SAED pattern shows rings and the obtained rings could also be indexed to the monoclinic MoO2 phase (Fig. S2, ESI†). Both the interplanar distance and SAED pattern support the XRD results.
From the elemental mapping images (Fig. S3, ESI†), it is distinctively identifiable that carbon is present throughout the sphere, i.e. In the shell and yolk, but the density of carbon in the inner yolk is higher. However, Mo is homogeneously distributed throughout the spheres. Similarly, the corresponding EDS line scan shows that the concentration of carbon in the yolk is higher than that in the shell and the concentration of Mo in the shell is higher than that in the yolk. However, it is hard to obtain exact information on the composition of the inner yolk because the size of the sphere is very high. The EDX elemental analysis results indicate the presence of ∼8 wt% carbon in the sphere.
BET surface area (SA) measurements were carried out via a N2 adsorption–desorption experiment of the synthesized C@MoO2 to identify the inner architectures and textural properties of the pores. The total surface area was calculated from the desorption region in the relative pressure range from 0.05 to 1.0. Fig. S4 (ESI†) presents the corresponding sorption isotherm and BJH (Barrett–Joyner–Halenda) pore size distribution plot. The sorption isotherm resembles type II and the hysteresis loops are almost an H3 type, which indicate that the material is made from aggregated particles, according to the IUPAC classification. The pore size distribution shows two types of pores (inset Fig. S4, ESI†): one type with a narrow pore size in the lower size range (1–20 nm) and the other type with broad distribution in the higher pore size range (20–200 nm). The TEM images also support the broad size distribution of the pores, which are mainly interparticle pores. The total BET surface area of the synthesized C@MoO2 was 40 m2 g−1 and the total pore volume was 0.27 cm3 g−1.
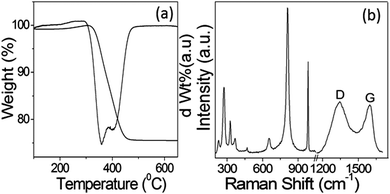
The amount of carbon with respect to MoO2 present in the sample after calcination at 600 °C under N2 was estimated using TG analysis. Fig. 4a represents the TGA and corresponding first-order differential of the TGA curve (DTG). In the thermogram, the main weight loss of ∼23% was observed in the temperature range of 300–450 °C, which can be ascribed to the oxidation of carbon present in the calcined C@MoO2 moiety to CO2. However, the CHN elemental analysis revealed that the sample contained 20% carbon, which is in accordance with the TGA results. Surprisingly, this result contradicts the results obtained from EDS, which shows the presence of only 8% carbon. The results confirmed that EDS was unable to gather information from the yolk, that is from the core. This confirms that the yolk was made up of a majority of carbon and supports the elemental mapping and EDS line scan results.
To further confirm the structure and composition of the synthesized C@MoO2, Raman spectroscopy was performed (Fig. 4b). In the Raman spectrum, the bands in the range of 200–1100 cm−1 are associated with the characteristic absorptions of MoO2 and MoO3. The existence of bands for MoO3 can be ascribed to the transformation of metastable MoO2 on the surface to MoO3. In addition, the two clearly distinguishable bands in the Raman spectrum at around 1350–1580 cm−1 (Fig. 4b) can be ascribed to the D and G bands of carbon, confirming the presence of carbon in the material.
Formation mechanism for the yolk–shell hollow structure
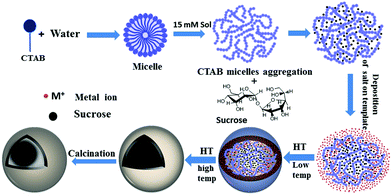
The present synthetic strategy for the C@MoO2 hollow yolk–shell structure is nothing but a suitable modification of our recently developed method for synthesising hollow sphere using CTAB and sucrose as the soft template and ammonium carbonate as the additive.56 The synthesis consists of following crucial steps: (i) the formation of a spherical soft template via the appropriate interaction of an aqueous solution of sucrose and CTAB. At the particular experimental concentration of CTAB (15 mM solution), individual CTAB micelles aggregate and form a worm-like structure.62 Then, these worm-like like micellar structures interact with sucrose and a spherical soft template with an average size of 500 nm is obtained, as confirmed by the DLS experiment (Fig. S5, ESI†). These results show that the combined sucrose–CTAB spherical structure acts as a soft template. In the control DLS experiments using solutions containing only sucrose or CTAB, the absence of any results in the DLS confirmed that the presence of both sucrose and CTAB at particular experimental concentrations is essential for formation of the desired spherical soft template. (ii) Formation of an amorphous core–shell solid spherical precursor by the generation of a molybdenum-based inorganic shell on the surface of the soft-template via the addition of a clear aqueous ammonium carbonate solution of ammonium heptamolybdate tetrahydrate to the template solution at room temperature, followed by simultaneous carbonization of sucrose in the template via a hydrothermal treatment. The inorganic shell was formed through the interaction of the ammonium head groups of CTAB in the template and molybdate ions. Carbonate ions have a distinguishable effect on the formation of a uniform spherical intermediate with a homogeneous distribution in the inorganic shell. In the control reaction with ammonium hydroxide instead of ammonium carbonate, phase-separated carbon spheres with core–shell spheres were observed (Fig. S6, ESI†). Most probably, carbonate ions accelerate the inorganic shell formation and in-turn restricts the formation of phase-separated carbon spheres. (iii) The last step is the formation of the desired C@MoO2 hollow yolk–shell structure via calcination of the as-synthesised amorphous solid core–shell precursor under a N2 flow. Scheme 1 is a schematic of the stepwise formation mechanism of the C@MoO2 hollow yolk–shell structure. The overall formation mechanism for the C@MoO2 hollow yolk–shell structure is almost identical to our previously reported mechanism for MoS2@C hollow spheres.56 In our previous study, we observed that due to the sheet-assembled layer structure of MoS2, during the carbonization process (hydrothermal treatment), most of carbon was deposited or developed in between the interlayer as well as on the inner walls of the MoS2 hollow spheres. However, in the present study, due to the limited interparticle space, a very small amount of carbon was formed in the inter particle pores and most of carbon of the soft template produced the yolk structure. During the synthesis, after deposition of the molybdenum precursor on the soft-template surface, the MoO2 nanoparticles were slowly grown on the carbon spheres, which were formed during the carbonisation process, and the concentration of amorphous MoO2 was increased with time during the hydrothermal treatment. Fig. S7 a and b (ESI†) present the SEM images of the materials formed in 4 h and 12 h with varying concentrations of MoO2 particles on the solids surface, respectively. The average diameters of the nearly uniform individual spheres are in the range of 1–1.2 μm. During calcination, the amorphous carbon in the core was squeezed due to dehydration and partially crystallized at high temperature and produced the yolk–shell structure.Electrochemical study
It was anticipated that the synthesized C@MoO2 hollow yolk–shell structure would improve the electrochemical properties due to an increased number of accessible active sites, which can accommodate large volume changes. Further, the yolk–shell structure will provide a cushioning effect that prevents structural damage during cycling, which is essential to realize an improved cycle life.To evaluate the performance of pure MoO2 and C@MoO2 hollow yolk–shell structure, electrochemical experiments such as cyclic voltammetry (CV) and galvanostatic charge–discharge (GCD) were performed using a standard three-electrode electrochemical shell containing 3 M KOH as the electrolyte. Fig. 5a depicts the relative CV curves of the synthesized C@MoO2 and pure MoO2 at the slow scan rate of 2 mV s−1 over the potential window from −0.2 to 0.5 V vs. Ag/AgCl (3 M KCl), where the redox activities were manifested as characteristic peaks. Observation of these prominent redox peaks indicates that the charge storage mechanism was not capacitive in nature and rather involved strong faradaic processes, somewhat similar to that of a battery material.60,61 It was observed that both the cathodic and anodic peak currents were higher for C@MoO2 as compared to those for MoO2. In addition, there was a shift in the peak potentials to relatively higher values for C@MoO2; the CV curves obtained for MoO2 and C@MoO2 exhibit prominent peaks at 0.31 V and 0.36 V for the anodic process and prominent peaks at 0.205 V and 0.22 V for the cathodic process, respectively. These results indicate that the presence of carbon leads to two favourable attributes in C@MoO2: (1) better wettability, which in turn, results in better accessibility to the electroactive sites and (2) catalytic activity for easing the redox processes. Fig. 5b shows the CV curves of C@MoO2 at various scan rates of 2–100 mV s−1 (the corresponding CV plots for MoO2 are shown in Fig. S8, ESI†). Deviation of the CV plots from their regular shape at higher scan rates indicates the diffusion-controlled kinetics of the electrochemical processes and can also be partially related to ion adsorption–desorption rate at the electrode/electrolyte interface.28,53 The electron transfer mechanism, occurring during the faradic processes, can be expressed by the redox reactions shown below.28,63
| MoO2 + xK+ + xe− ↔ MoO2−x(OK)x | (2) |
| MoO2 + 4OH− ↔ MoO42− + 2H2O + 2e− | (3) |
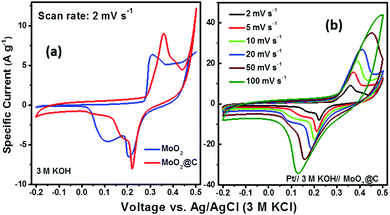 | ||
| Fig. 5 (a) A comparison of the cyclic voltammograms obtained for MoO2 and C@MoO2 at a scan rate of 2 mV s−1 and (b) the CV plots of C@MoO2 at different scan rates in 3 M KOH. | ||
To check whether any major faradic contribution originated from the underlying Ni foam substrate, a similar type of electrochemical cell arrangement was constructed using bare Ni foam as the working electrode and then CV was performed. On calculating the area under the curve, the overall faradic current was found to be only ∼2.5% with respect to those of MoO2 or MoO2@C (Fig. S9, ESI†).
Gravimetric specific capacities (Cs) of both MoO2 and C@MoO2 were calculated from the GCD measurements. Fig. 6 shows a comparison of the GCD profiles obtained for MoO2 and C@MoO2 at the current density of 0.5 A g−1. A relatively higher discharge time for C@MoO2 indicated more active faradic process/ion transportation due to the increased number of accessible active sites that originate from the hollow structure, high surface area, and the presence of carbon, facilitating the charge transport.
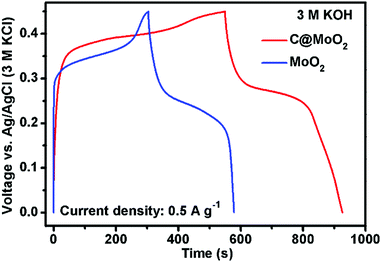 | ||
| Fig. 6 The galvanostatic charge–discharge profiles obtained for MoO2 and C@MoO2 at the current density of 0.5 A g−1. | ||
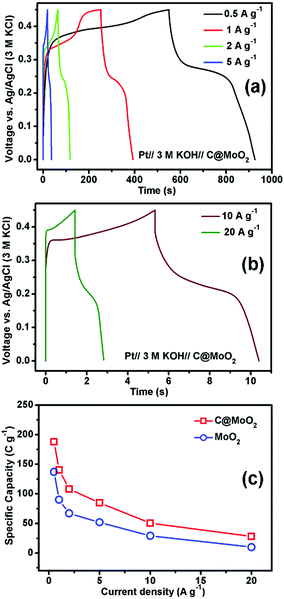
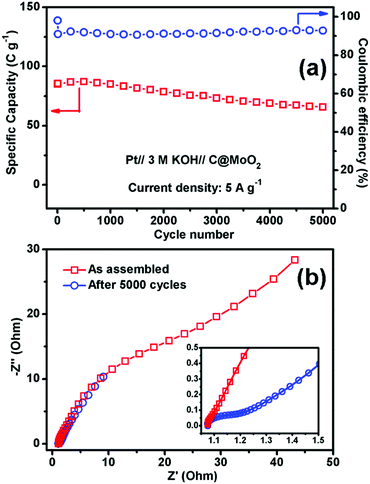
Fig. 7a and b show the GCD profiles of C@MoO2 at different current densities ranging from 0.5 to 5 A g−1 and from 10 to 20 A g−1, respectively. The corresponding GCD profiles for MoO2 are shown in Fig. S10a and b (ESI†). Observation of plateaus in both the charge and discharge profiles originating from the faradaic processes corroborates the observations from CV and is in accordance with a battery-like behaviour. The specific capacity (Cs) values were calculated to be 188, 140.4, 108, 85, 50.6, and 28 C g−1 at the current densities of 0.5, 1, 2, 5, 10, and 20 A g−1, respectively, for C@MoO2 (Fig. 7c). On the other hand, MoO2 showed Cs values of 137.1, 90, 67, 52, 29, and 10 C g−1 at the current densities of 0.5, 1, 2, 5, 10, and 20 A g−1, respectively (Fig. 7c). These results clearly indicate the superior rate performance of C@MoO2. For only comparison purposes, the specific capacitance values were also calculated in F g−1 using the conventional equation [Cs′ = (I × Δt)/(m × ΔV)] and were compared with the existing reported values (Table 1). The obtained specific capacitance (Cs′ in F g−1) of the synthesized C@MoO2 was quite superior to those of previously reported molybdenum oxides, both MoO2 MoO3 and their carbon/conducting polymer-based composites.13,16–27,42–51 There are some reports on molybdenum oxide where the obtained Cs is high; however, in most of the cases, the loading mass is low55 and/or material synthetic procedures are complicated and use additional conducting polymer/CNT/f-GO.28,29,52–54 The high Cs of the synthesized carbon-incorporated MoO2 hollow yolk–shell structure implies that the material possesses a large number of accessible active sites and the presence of carbon facilitates faster electron transport during the charge cycle. A cycling test for the carbon-supported yolk–shell MoO2 showed a capacity value of 66 C g−1 after 5000 cycles at the current density of 5 A g−1, retaining about 78% of its initial capacity (85 C g−1) at 5 A g−1 (Fig. 8a). The obtained cycling stability is comparable to that of molybdenum oxide-based material previously reported in the literature and implies that the yolk–shell structure is quite stable during cycling. Further, the integrity of the C@MoO2 electrode was checked by FESEM and it was observed that the morphology of the electrode film remained unaltered even after 1000 charge/discharge cycles (Fig. S11, ESI†).
| Material | C s | id/νb | Stabilityc | Electrolyte | Ref. |
|---|---|---|---|---|---|
| a C s = specific capacitance. b id/ν = current density or scan rate. c Stability = retention of Cs after a certain number of cycles. d Results from the present study. | |||||
| C@MoO 2 | 188 C g −1 (423 F g−1) | 0.5 A g −1 | 78%/5000 | KOH | |
| MoO2@CC | 174 mF cm−2 | 2 mA cm−2 | 91%/5000 | Na2SO4 | 13 |
| MoO2 | 205.3 F g−1 | 1 mA | 78%/50 | H2SO4 | 16 |
| MoO2 | 146 F g−1 | 5 mV s−1 | 90%/1000 | LiOH | 17 |
| 1D MoO2 | 140 F g−1 | 1 mA cm−2 | 86%/50 | H2SO4 | 18 |
| MC/MoO2 | 395 F g−1 | 2 mV s−1 | 100%/500 | H2SO4 | 42 |
| MoO2–Cu–C | 28 mA h g−1 | 0.5 A g−1 | 91%/5000 | KOH | 43 |
| GO–MoO2 | 381 F g−1 | 0.5 mV s−1 | — | Na2SO4 | 44 |
Electrochemical impedance spectroscopy (EIS) of the C@MoO2 was carried out in the as-assembled state and after 5000 cycles (Fig. 8b). As shown in the inset, the Nyquist plots possess two regions: a small semicircle in the intermediate frequency region (the diameter of which gives the charge transfer resistance Rct) followed by a straight line in the low frequency region (diffusion resistance). The intercept in the X-axis provides the solution resistance Rs. The obtained Rs of the as-assembled electrode was 1.07 Ω, which marginally increased to 1.08 Ω after 5000 cycles, suggesting no dissolution of the electrode material into the electrolyte and confirming the integrity of the yolk–shell structure. However, an increase in the charge transfer resistance (Rct) from 0.02 Ω to 0.14 Ω with prolonged cycling accounts for the observed 22% decay in the capacity after 5000 cycles.
Thus, the overall performance with respect to the specific capacity (Cs), rate capability and cycling behaviour of the synthesized C@MoO2 hollow yolk–shell structure was superior to those of MoO2 (Table 1), MoO3 (Table S1, ESI†), and their composites reported in the literature.13,16–27,42–51 The enhancement in performance was most probably due to the following reasons: (i) the hollow structure, which enhances the surface area due to the 3D nature of the C@MoO2 yolk–shell structure and in-turn, the large number of accessible active sites available for the electrochemical reaction and the reduced average ionic diffusion path, (ii) carbon in the material facilitating faster electron transport during the charge cycle, and (iii) the inside shell not only providing additional active surface but also additional strength and stability to the hollow structure, preserving the integrity of the structure during the electrochemical process.
Conclusions
In conclusion, we successfully demonstrated a simple, cost-effective, and unique protocol for the synthesis of a carbon-incorporated MoO2 (C@MoO2) yolk–shell structure using a soft template, sucrose–CTAB-mediated method. In the synthesis, sucrose not only acted as a template but also as the carbon source. In addition, the synthetic procedure described herein may be used to prepare yolk–shell structure of other metal oxides. As an active material for electrochemical energy storage, C@MoO2 showed faradaic behaviour and exhibited a high specific capacity (Cs) of 188 C g−1 at the current density of 5 A g−1 along with good rate performance and cycle stability. The electrochemical performance was superior to that of the previously reported molybdenum oxides and their corresponding composites. Thus, the synthesized C@MoO2 yolk–shell structure can open-up the possibility to fabricate efficient and low-cost energy storage devices.Acknowledgements
CSIR-CSMCRI communication No. 039/2017. The authors would like to acknowledge SERB, India (EMR/2014/001219) for financial support. A. Saha and S. Maiti acknowledge the UGC and CSIR, India, respectively, for their fellowships. The authors also acknowledge the “ADCIF” of CSMCRI for providing instrumentation facilities.Notes and references
- M. F. El-Kady, V. Strong, S. Dubin and R. B. Kaner, Science, 2012, 335, 1326–1330 CrossRef CAS PubMed.
- C. Zhong, Y. Deng, W. Hu, J. Qiao, L. Zhang and J. Zhang, Chem. Soc. Rev., 2015, 44, 7484–7539 RSC.
- X. Zhao, B. M. Sánchez, P. J. Dobson and P. S. Grant, Nanoscale, 2011, 3, 839–855 RSC.
- M. Jana, S. Saha, P. Samanta, N. C. Murmu, N. H. Kim, T. Kuila and J. H. Lee, J. Mater. Chem. A, 2016, 4, 2188–2197 CAS.
- F. Clerici, M. Fontana, S. Bianco, M. Serrapede, F. Perrucci, S. Ferrero, E. Tresso and A. Lamberti, ACS Appl. Mater. Interfaces, 2016, 8, 10459–10465 CAS.
- V. Augustyn, J. Come, M. A. Lowe, J. W. Kim, P. L. Taberna, S. H. Tolbert, H. D. Abruña, P. Simon and B. Dunn, Nat. Mater., 2013, 12, 518–522 CrossRef CAS PubMed.
- N. Phattharasupakun, J. Wutthiprom, P. Chiochan, P. Suktha, M. Suksomboon, S. Kalasina and M. Sawangphruk, Chem. Commun., 2016, 52, 2585–2588 RSC.
- V. K. A. Muniraj, C. K. Kamaja and M. V. Shelke, ACS Sustainable Chem. Eng., 2016, 4, 2528–2534 CrossRef CAS.
- K. Deori, S. K. Ujjain, R. K. Sharma and S. Deka, ACS Appl. Mater. Interfaces, 2013, 5, 10665–10672 CAS.
- J. Min, J. Liu, M. Lei, W. Wang, Y. Lu, L. Yang, Q. Yang, G. Liu and N. Su, ACS Appl. Mater. Interfaces, 2016, 8, 780–791 CAS.
- Y. M. Chen, J. H. Cai, Y. S. Huang, K. Y. Lee and D. S. Tsai, Nanotechnology, 2011, 22, 115706 CrossRef CAS PubMed.
- S. Maiti, A. Praminik and S. Mahanty, Chem. Commun., 2014, 50, 11717 RSC.
- X.-F. Lu, Z.-X. Huang, Y.-X. Tong and G.-R. Li, Chem. Sci., 2016, 7, 510–517 RSC.
- M. Chen, J. Wang, H. Tang, Y. Yang, B. Wang, H. Zhao and D. Wang, Inorg. Chem. Front., 2016, 3, 1065–1070 RSC.
- J. Wang, H. Tang, H. Ren, R. Yu, J. Qi, D. Mao, H. Zhao and D. Wang, Adv. Sci., 2014, 1, 1400011 CrossRef PubMed.
- L. Zheng, Y. Xu, D. Jin and Y. Xie, J. Mater. Chem., 2010, 20, 7135–7143 RSC.
- X. Li, J. Shao, J. Li, L. Zhang, Q. Qu and H. Zheng, J. Power Sources, 2013, 237, 80–83 CrossRef CAS.
- J. Rajeswari, P. S. Kishore, B. Viswanathan and T. K. Varadarajan, Electrochem. Commun., 2009, 11, 572–575 CrossRef CAS.
- D. Hanlon, C. Backes, T. M. Higgins, M. Hughes, A. O’Neill, P. King, N. McEvoy, G. S. Duesberg, B. M. Sanchez, H. Pettersson, V. Nicolosi and J. N. Coleman, Chem. Mater., 2014, 26, 1751–1763 CrossRef CAS.
- J. Jiang, J. Liu, S. Peng, D. Qian, D. Luo, Q. Wang, Z. Tian and Y. Liu, J. Mater. Chem. A, 2013, 1, 2588–2594 CAS.
- J. Li and X. Liu, CrystEngComm, 2014, 16, 184–190 RSC.
- W. Tang, L. Liu, S. Tian, L. Li, Y. Yue, Y. Wu and K. Zhu, Chem. Commun., 2011, 47, 10058–10060 RSC.
- V. Kumar, X. Wang and P. S. Lee, Nanoscale, 2015, 7, 11777 RSC.
- I. Shakir, M. Shahid, U. A. Rana and M. F. Warsi, RSC Adv., 2014, 4, 8741–8745 RSC.
- Z. Cui, W. Yuan and C. M. Li, J. Mater. Chem. A, 2013, 1, 12926–12931 CAS.
- Q. Mahmood, W. S. Kim and H. S. Park, Nanoscale, 2012, 4, 7855–7860 RSC.
- R. Liang, H. Cao and D. Qian, Chem. Commun., 2011, 47, 10305–10307 RSC.
- K. M. Hercule, Q. Wei, A. M. Khan, Y. Zhao, X. Tian and L. Mai, Nano Lett., 2013, 13, 5685–5691 CrossRef CAS PubMed.
- Y. Zhou, C. W. Lee and S. Yoon, Electrochem. Solid-State Lett., 2011, 14, A157–A160 CrossRef CAS.
- J. S. Cho, H. S. Ju and Y. C. Kang, Sci. Rep., 2016, 6, 23915 CrossRef CAS PubMed.
- Y. Wang, Y. Lei, J. Li, L. Gu, H. Yuan and D. Xia, ACS Appl. Mater. Interfaces, 2014, 6, 6739–6747 CAS.
- H. Tang, J. Wang, H. Yin, H. Zhao, D. Wang and Z. Tang, Adv. Mater., 2015, 27, 1117–1123 CrossRef CAS PubMed.
- J. Qi, X. Lai, J. Wang, H. Tang, H. Ren, Y. Yang, Q. Jin, L. Zhang, R. Yu, G. Ma, Z. Su, H. Zhaod and D. Wang, Chem. Soc. Rev., 2015, 44, 6749–6773 RSC.
- X. Lai, J. E. Halpert and D. Wang, Energy Environ. Sci., 2012, 5, 5604–5618 CAS.
- J. Li, G. Zan and Q. Wu, J. Mater. Chem. A, 2016, 4, 9097–9105 CAS.
- S. Peng, L. Li, H. Tan, R. Cai, W. Shi, C. Li, S. G. Mhaisalkar, M. Srinivasan, S. Ramakrishna and Q. Yan, Adv. Funct. Mater., 2014, 24, 2155–2162 CrossRef CAS.
- T. Yang, R. Zhou, D. W. Wang, S. P. Jiang, Y. Yamauchi, S. Z. Qiao, M. J. Monteiro and J. Liu, Chem. Commun., 2015, 51, 2518–2521 RSC.
- C. L. Tang, X. Wei, Y. M. Jiang, X. Y. Wu, L. N. Han, K. X. Wang and J. S. Chen, J. Phys. Chem. C, 2015, 119, 8465–8471 CAS.
- M. Shao, F. Ning, Y. Zhao, J. Zhao, M. Wei, D. G. Evans and X. Duan, Chem. Mater., 2012, 24, 1192–1197 CrossRef CAS.
- L. Shen, L. Yu, H. B. Wu, X. Y. Yu, X. Zhang and X. W. Lou, Nat. Commun., 2015, 6, 6694 CrossRef CAS PubMed.
- X. Fang, J. Zang, X. Wang, M. S. Zheng and N. Zheng, J. Mater. Chem. A, 2014, 2, 6191–6197 CAS.
- Y. Zhou, C. W. Lee, S.-K. Kim and S. Yoon, ECS Electrochem. Lett., 2012, 1, A17–A20 CrossRef CAS.
- Y. Zhang, B. Lin, Y. Sun, P. Han, J. Wang, X. Ding, X. Zhang and H. Yang, Electrochim. Acta, 2016, 188, 490–498 CrossRef CAS.
- R. Giardi, S. Porro, T. Topuria, L. Thompson, C. F. Pirri and H.-C. Kim, Appl. Mater. Today, 2015, 1, 27–32 CrossRef.
- X. Xia, Q. Hao, W. Lei, W. Wang, H. Wang and X. Wang, J. Mater. Chem., 2012, 22, 8314–8320 RSC.
- X. Zhang, X. Zeng, M. Yang and Y. Qi, ACS Appl. Mater. Interfaces, 2014, 6, 1125–1130 CAS.
- J. Zhou, J. Song, H. Li, X. Feng, Z. Huang, S. Chen, Y. Ma, L. Wang and X. Yan, New J. Chem., 2015, 39, 8780–8786 RSC.
- V. Kumar and P. S. Lee, J. Phys. Chem. C, 2015, 119, 9041–9049 CAS.
- J. Hu, A. Ramadan, F. Luo, B. Qi, X. Deng and J. Chen, J. Mater. Chem., 2011, 21, 15009–15014 RSC.
- T. Tao, Q. Chen, H. Hu and Y. Chen, Mater. Lett., 2012, 66, 102 CrossRef CAS.
- L. Zheng, Y. Xu, D. Jin and Y. Xie, Chem. – Asian J., 2011, 6, 1505–1514 CrossRef CAS PubMed.
- R. Liang, H. Cao and D. Qian, Chem. Commun., 2011, 47, 10305–10307 RSC.
- F. Gao, L. Zhang and S. Huang, Mater. Lett., 2010, 64, 537–540 CrossRef CAS.
- X. Cao, B. Zheng, W. Shi, J. Yang, Z. Fan, Z. Luo, X. Rui, B. Chen, Q. Yan and H. Zhang, Adv. Mater., 2015, 27, 4695–4701 CrossRef CAS PubMed.
- F. Jiang, W. Li, R. Zou, Q. Liu, K. Xu, L. An and J. Hu, Nano Energy, 2014, 7, 72–79 CrossRef CAS.
- A. Saha, P. Bharmoria, A. Mondal, S. C. Ghosh, S. Mahanty and A. B. Panda, J. Mater. Chem. A, 2015, 3, 20297 CAS.
- A. K. Giri, P. Pal, R. Ananthakumar, M. Jayachandran, S. Mahanty and A. B. Panda, Cryst. Growth Des., 2014, 14, 3352–3359 CAS.
- P. Pal, A. Kanti Giri, S. Mahanty and A. B. Panda, CrystEngComm, 2014, 16, 10560 RSC.
- S. Chen, M. Mao, X. Liu, S. Hong, Z. Lu, S. Sang, K. Liu and H. Liu, J. Mater. Chem. A, 2016, 4, 4877 CAS.
- A. Laheäär, P. Przygocki, Q. Abbas and F. Béguin, Electrochem. Commun., 2015, 60, 21–25 CrossRef.
- T. Brousse, D. Bélanger and J. W. Long, J. Electrochem. Soc., 2015, 162, A5185–A5189 CrossRef CAS.
- Z. Lin, J. J. Cai, L. E. Scriven and H. T. Davis, J. Phys. Chem., 1994, 98, 5984 CrossRef CAS.
- Y. Zhang, B. Lin, Y. Sun, P. Han, J. Wang, X. Ding, X. Zhang and H. Yang, Electrochim. Acta, 2016, 188, 490–498 CrossRef CAS.
Footnote |
| † Electronic supplementary information (ESI) available: Additional FESEM & TEM images, N2 sorption isotherms, DLS measurements and additional electrochemical data. See DOI: 10.1039/c7qm00006e |
| This journal is © the Partner Organisations 2017 |

