
 Open Access Article
 This Open Access Article is licensed under a Creative Commons Attribution-Non Commercial 3.0 Unported Licence
Investigation on CO catalytic oxidation reaction kinetics of faceted perovskite nanostructures loaded with Pt
S. M. Yin*ab,
J. J. Duanmua,
Y. H. Zhuc,
Y. F. Yuana,
S. Y. Guoa,
J. L. Yanga,
Z. H. Ren *b and
G. R. Hanb
*b and
G. R. Hanb
aCollege of Machinery and Automation, Zhejiang Sci-Tech University, Hangzhou 310018, P. R. China. E-mail: yinsm@zstu.edu.cn; 2685341028@qq.com; jinlinyang@126.com
bState Key Lab of Silicon Materials, School of Materials Science and Engineering, Zhejiang University, Hangzhou 310027, P. R. China. E-mail: renzh@zju.edu.cn
cAdvanced Membranes and Porous Materials Center, King Abdullah University of Science and Technology, Thuwal 23955-6900, Kingdom of Saudi Arabia
First published on 18th January 2017
Abstract
Perovskite lead titanate nanostructures with specific {111}, {100} and {001} facets exposed, have been employed as supports to investigate the crystal facet effect on the growth and CO catalytic activity of Pt nanoparticles. The size, distribution and surface chemical states of Pt on the perovskite supports have been significantly modified, leading to a tailored conversion temperature and catalytic kinetics towards CO catalytic oxidation.
Noble metals, such as Pt, Au, Pd and Rh can generate high catalytic activity, offering great opportunity and raising interest in industrial catalysis and theoretical study, and so on.1–6 Bringing the catalyst to the nanoscale has been extensively investigated in various systems from organic synthesis, CO oxidation to water–gas reaction, etc.7–12 In particular, the shape and size control of the noble metal catalysts have been proved to significantly affect the catalytic performance.13,14 For example, the activation energies for the electron–transfer reaction between Fe(CN)63− and S2O32− has been determined to be effectively tailored by the shape of the Pt nanoparticles from tetrahedral to cubic to spherical.15,16 Furthermore, the {100} surface of the Pt nanocubes with a size below 10 nm is more efficient to enhance catalytic performance towards the formation of n-butylamine, compared to that of the Pt {111}.13 On the other hand, noble metals grown on specific facets of the oxide supports demonstrated a remarkable catalytic activity, which should be attributed to the creativity of new reactive sites and the interfacial effect.1,17,18 CeO2 has been identified to be effective in exerting strong shape/crystal plane effect on Au by stabilizing and activating the Au nanoparticles in water-gas shift (WGS).19 It has been argued that the formation energy of oxygen vacancies on the oxides surface is tightly associated with the stability of Au, which is significantly mediated by the exposure of crystal planes. Therefore, it is reasonable to consider that the specific exposed facets of the oxide supports should not only play a key role in determining the stability of the deposited noble metal catalysts, but also in changing their growth behaviour and shape. Compared with simple metal and metal oxides, perovskite oxides have been widely used as catalysts or oxide support for noble metal catalysts for fuel cells and oxygen evolution reaction because of their flexible structure tolerance and fruitful surface configuration. In the case of Pt–SrTiO3 (STO) system, the facets ratio of {111} and {100} of Pt growth on {100} of the nanocubiod STO was determined by the interfacial energy, and a perfect epitaxial growth of Pt on STO {100} was achieved by lowering significantly reducing the interfacial energy via lattice agreement.20 Such Pt–STO was employed as the catalyst in propane oxidation by lowering the reaction temperature of ∼50 °C compared to that of Pt–Al2O3.21 These fascinating advances encourage us to further intensively explore the facet effect of perovskite nanostructures on the growth of noble metals and their corresponding catalytic activity.
Perovskite ferroelectric oxides, such as PbTiO3 (PT), Pb(Zr,Ti)O3(PZT), have found many technical applications ranging from nonvolatile ferroelectric random access memories to electro-mechanical device. With the minimization of these devices, PT-based nanostructures have been the focus of many efforts for understanding ferroelectricity and piezoelectricity at nanoscale.22 In the past few years, our group developed various (hydrothermal, sol–gel and solid state reaction, etc.) approaches to preparing single-crystal PT-related nanostructures from nanodots, nanofibers to nanoplates.23–27 In addition to conventional piezoelectric, ferroelectric and phase transition investigation, gas catalytic, photocatalytic and bending-sensitive photoluminescence properties of the nanostructures have been investigated on the basis of their surface or interface character.23,28 In particular, Pt-loaded PT nanostructures show obvious catalytic activity towards CO oxidation, even at near room temperature, offering the opportunity to develop novel perovskite-based catalysis.24 However, the effect of crystal planes of PT nanostructures on their catalytic kinetics and mechanism of CO oxidation has not been comprehensively pursued and revealed. Here we choose single-crystal nanofiber, nanoplate and truncated octahedron of perovskite PT as supports to discuss the deposition of Pt nanoparticles on them, where {100}, {001} and {111} are dominantly exposed. These exposed planes have been revealed to effectively modify the size, morphology and distribution of Pt nanoparticles, giving rise to a change in reaction kinetics and activated energy of the Pt/PT systems. It is supposed that the exposed facets and Pt nanoparticles on them should together make essential contributions to the catalytic performance of the systems.
Experimental details
Preparation
Firstly, three perovskite nanostructures have been synthesized via hydrothermal/hydrothermal-heat treatment process in advance.24,25,27 The as-obtained PT products were dispersed in deionized water in an ultrasonic bath for 30 min, respectively. The Pt/PT nanostructures were obtained by adding 0.05 M chloroplatinic acid (H2PtCl6·6H2O, aq) into the above mentioned solutions containing PT nanostructures. After stirring for 15 min (at room temperature), 0.2 M sodium borohydride (NaBH4, reductant) solution was added dropwise into the mixture and then kept in the ultrasonic bath for 30 min. The final powder was derived after centrifuging, washing and then drying at 60 °C for 24 h.Characterization
Scanning electron microscope (SEM) images were collected by the Hitachi field emission SEM MODEL S-4800. X-ray photoelectron spectra (XPS) were acquired using a Thermo ESCALAB 250 photoelectron spectrometer with Al Kα source. Thermogravimetry (TG) and differential scanning calorimetry (DSC) analysis was carried out on a TGA-SDT (Q600 V8.2 Build 100) instrument. Nitrogen gas adsorption experiments are carried out on an Accelerated Surface Area and Porosimetry system (ASAP-2020, Micromeritics, Norcross, GA). High-resolution (S)TEM imaging was carried out on a FEI Titan ST microscope at 300 kV. A HAADF detector with inner detection angle of 76 mrad was used for the STEM imaging. HRTEM simulation was carried out using multi-slice method with the qSTEM code. Electron tomography tilt series from −65° to 65° at 1° interval were acquired in STEM mode, which were aligned and then reconstructed to a 3D volume using the SIRT function in the FEI Inspect 3D software. The 3D volume rendering, density segmentation and isosurface construction were achieved by the Avizo software.Catalytic oxidation of CO
The ambient pressure CO oxidation and kinetic study was performed in a continuous flow fixed-bed quartz tubular reactor (6 mm i.d.). 50 mg (40–60 mesh) 1% Pt/PT catalyst was packed in the reactor and pre-treated at 120 °C for 2 h under a 50 ml min−1 dry He flow. After cooling to room temperature, a dry 0.7 vol% CO/He and 33.3 vol% O2/He mixture feed stock was introduced into the reactor with different ratios and space velocities (SVs), in order to achieve different CO/O2 ratios and control the conversion of CO below 15%. All reactants and products were analyzed by on-line gas chromatography.Results and discussion
Three supports of tetragonal perovskite PT nanostructures were characterized and shown in Fig. 1. PT nanocrystals were prepared by a combination of hydrothermal and solid state reaction, further determined to adopt a truncated octahedral shape with a size distribution of 20–50 nm and {111}/{001} exposed (Fig. 1a and 2a).24 Clear lattice images in Fig. 1b confirmed that the nanocrystals are single-crystal in character. Single-crystal PT nanofibers (Fig. 1c and d) were obtained by a hydrothermal and subsequent solid state phase transformation, and these nanofibers were characterized to grow along [001] with {100} facets exposed.25,29 Single-crystal PT nanoplates were formed hydrothermally via a self-template growth process, where {001} are dominantly exposed.27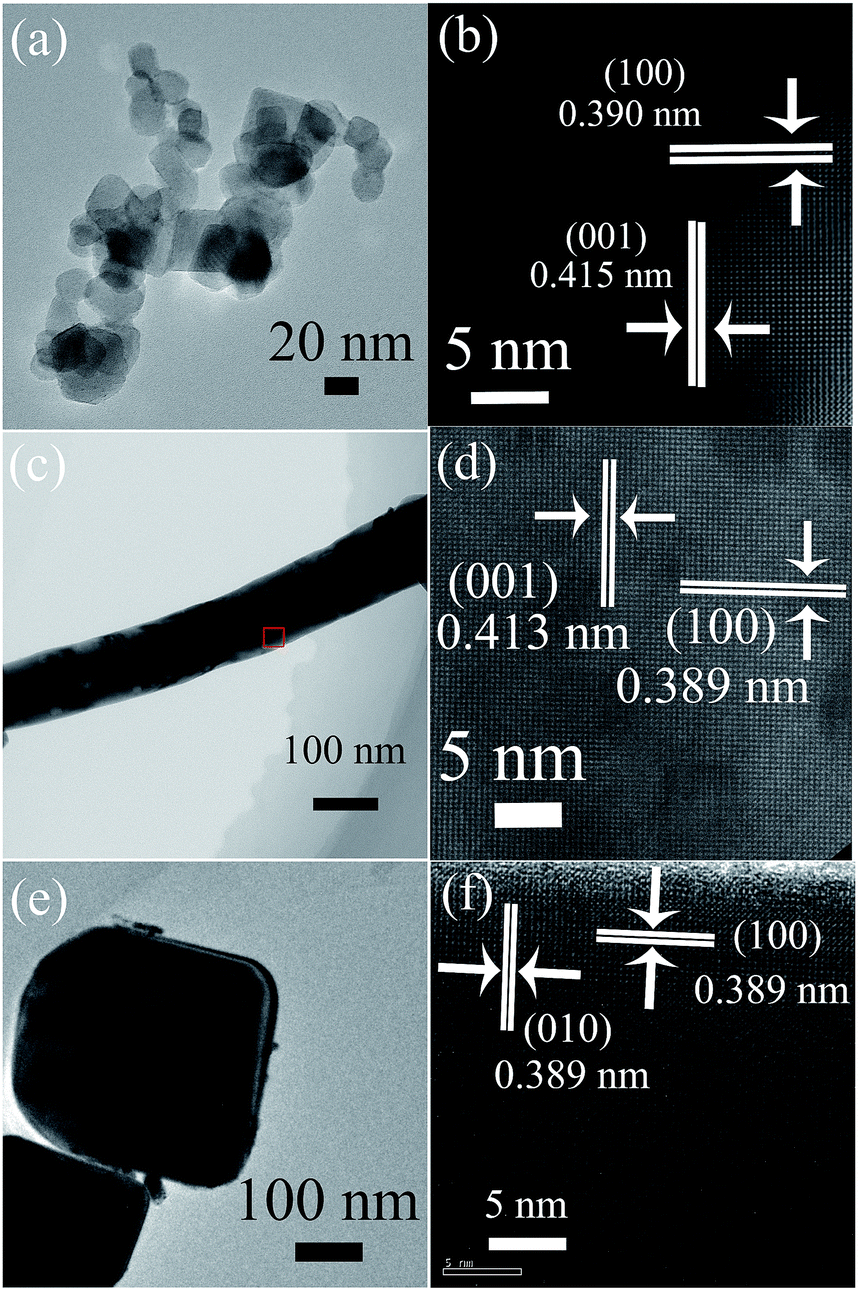 | ||
| Fig. 1 TEM and corresponding HRTEM images of perovskite PT nanostructures (a and b) nanocrystals, (c and d) -fibers and (e and f) -plates. (PT: JCPDF file no. 06-0452). | ||
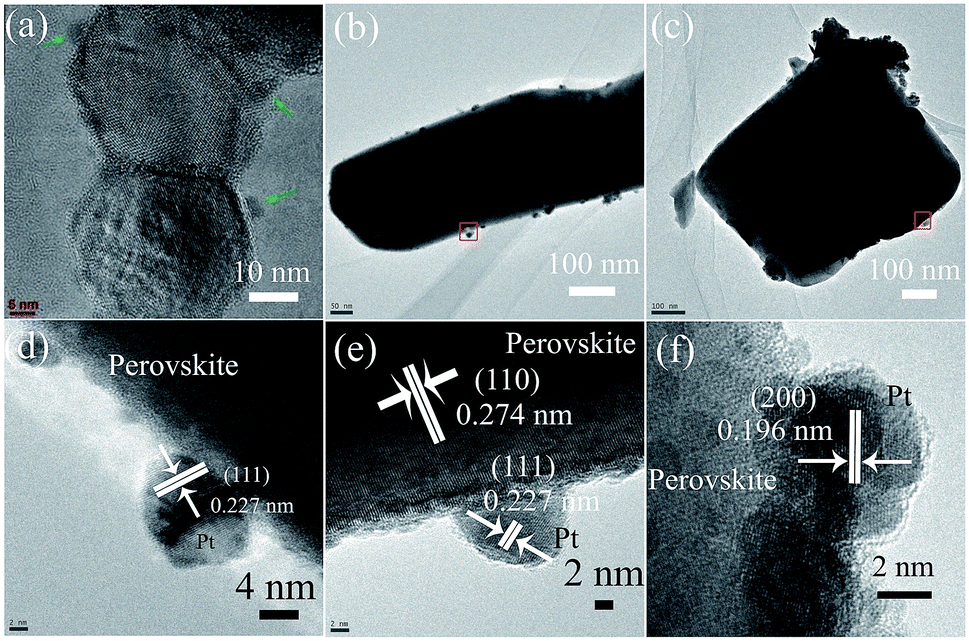 | ||
| Fig. 2 TEM and HRTEM images of Pt/PT nanostructures: (a and d) nanocrystals; (b and e) nanofibers and (c and f) nanoplates. | ||
These three nanostructures were respectively employed as oxide supports for Pt deposition and growth by using H2PtCl6·6H2O aqueous solution. Pt nanocrystals with a size of 3–5 nm were successfully obtained and well dispersed on the surface of PT truncated octahedron, and these nanocrystals were further identified to selectively deposit on the {111} of truncated octahedron24 (Fig. 2a and d). When prepared by a simple solution reduction reaction without any surface surfactant, the {111} facets of Pt NPs tended to be exposed more easily than other facets such as {100} considering the surface free energy of {111} and {100} (γPt{111}/γPt{100} of 0.84).20 Compared with that of PT truncated octahedron, there are two major types for Pt particles to exist on the surface of perovskite single-crystal nanofibers, as observed in TEM. One type is that Pt particles grew into an aggregation (clusters) with the size of 5–20 nm, and the other type is that Pt particles with a size of 5–10 nm exist on the surface of perovskite single-crystal nanofiber, as shown in Fig. 2b and e. In stark contrast, severe aggregation of Pt nanoparticles can be clearly observed in the case of PT nanoplates, where the size of aggregation is up to 100 nm (Fig. 2c), consisting of large-scale single-crystal Pt nanoparticles of 3–5 nm (Fig. 2f). This implies that the deposition and growth of well-dispersed Pt nanoparticles are not favored energetically. As predicted in the case of Pd–LiNbO3, the polar surface has a significant effect on the deposit and growth of Pd atoms to generate either a clustered configuration or a dispersed pattern.30 For the case of PT nanoplates, the two exposed {001} facets correspond to polar surface, possibly leading to the aggregated configuration of Pt nanoparticles or additional deposited sites (side facets of the nanoplates, such as {100}). On the basis of above results, the ability to obtain well-dispersed Pt nanoparticles decreased from {111}, {100} to {001} of tetragonal perovskite PT.
As discussed above, the size and configuration of Pt particles changed significantly on the {111}, {001} and {100} of PT supports. It is therefore interesting to explore their effect on the catalytic performance and kinetics of the systems towards CO oxidation. For all the three blank PT samples without Pt loading in Fig. 3a, the nanoplates were determined to show the highest catalytic activity for CO oxidation, which begins at about 110 °C and achieve ∼85% conversion rate at ∼250 °C. In contrast, the PT nanofibers demonstrate almost no activity from room temperature to ∼250 °C. For the PT nanocrystals, the oxidation reaction occurred at ∼150 °C and a 60% rate was observed at ∼250 °C. It is clear that the reaction activity decreased from the nanoplates, nanocrystals to nanofibers. When loaded with Pt nanoparticles, the situation changed completely. Nearly 100% conversion of CO can be achieved for Pt/PT nanocrystals at a temperature as low as ∼50 °C, which is significantly lower than the temperature of 100% CO conversion (∼100 °C) for the Pt/PT nanoplates, as shown in Fig. 3a. The behaviour of the nanofibers is almost the same as that of the nanoplates. Furthermore, kinetic orders of CO and O2 over the Pt/PT nanoplates, nanocrystals and nanofibers are calculated to be −0.25 and 0.48, −0.30 and 0.44, −0.5 and 0.45, respectively (Fig. 3b). These are apparently different from those monofunctional pathways that either have a ∼[O2]1 dependence over Pt,31 Pd32 and Rh33 catalysts through a *–CO* assisted O2 activation as the rate-determining step (rds)33,34 or a ∼[CO]−1 dependence for CO desorption-controlled kinetics.35 The reaction orders are close to observed ones in a Pt/Rh/CeO2/Al2O3 system involving a bifunctional pathway, which refers to a reaction between CO adsorbed on the metal and oxygen from support at the metal/support interface.36 It gives a less negative reaction order for CO and a positive ∼0.5 order for O2, where the O2 molecular adsorption on the PT support is the rds. A regression analysis of Arrhenius plot (Fig. 3c) determines that the apparent activation energies (Ea) of CO oxidation are 22.9(±0.4) kcal mol−1 for Pt/PT nanocrystals, 26.5(±1.6) kcal mol−1 for Pt/PT nanoplates, and 32.7(±2.9) kcal mol−1 for Pt/PT nanofibers, which are close to the Ea values for either oxygen molecular adsorption on TiO2 (ref. 37) or CO desorption on Pt metal,38 and also close to a typical Ea for Pt NPs supported on other oxide support, like Al2O3 (26.7–41 kcal mol−1) (Table 1).36,39
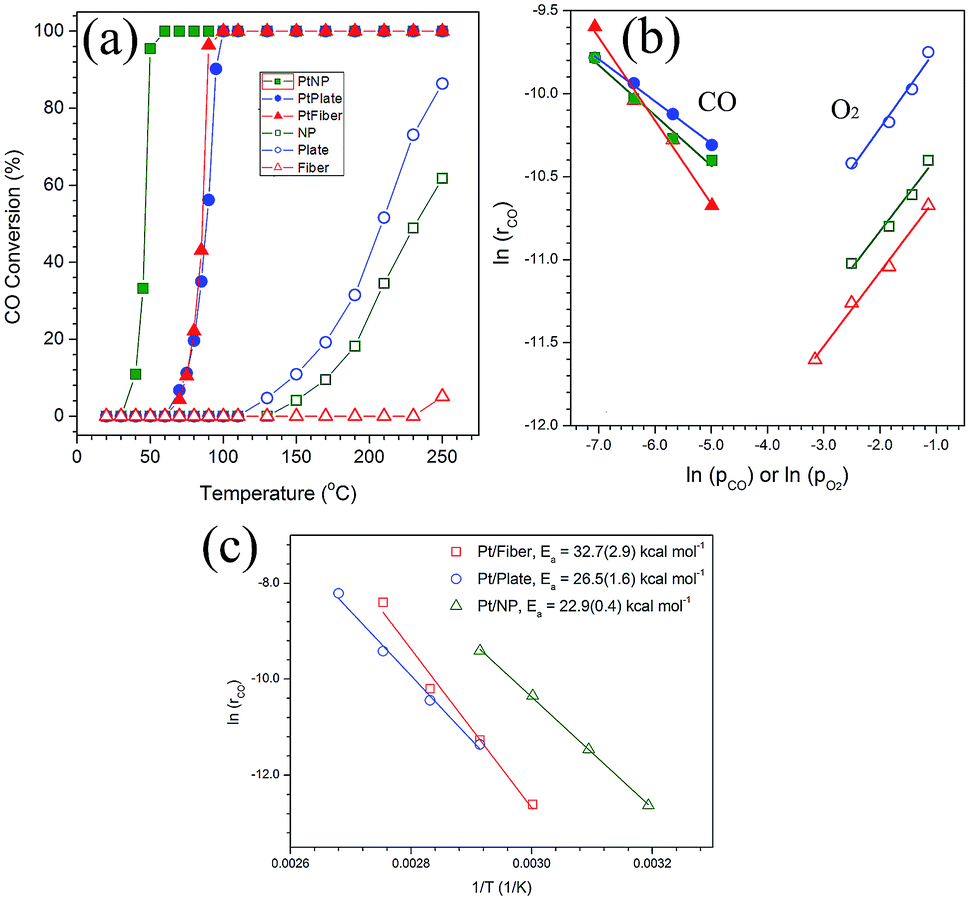 | ||
| Fig. 3 (a) Catalytic activity of the Pt-loaded (solid) and Pt-free (open) PT nanocrystals (green), nanofibers (red) and nanoplates (blue); (b) reaction orders for CO (solid) and O2 (open) of the three corresponding Pt/PT nanostructures and (c) Arrhenius plots and linear regression analysis. | ||
| Morphology of Pt | Size of Pt/nm | Pt4f/eV | |
|---|---|---|---|
| Pt/PT nanocrystals | Well-distribution | 3–5 | 70.84 |
| Pt/PT nanofibers | Slight aggregation | 5–20 | 70.53 |
| Pt/PT nanoplates | Severe aggregation | ∼100 | 70.49 |
To understand the results in Fig. 3, the surface structures of Pt-free and Pt-loaded PT samples were analyzed by BET and XPS measurement. Before Pt deposition, the surface area of the blank supports was detected to be 14.50 m2 g−1, 1.14 m2 g−1 and 0.7 m2 g−1 and respectively for the PT nanocrystals, nanoplates and nanofibers. Among them, the nanocrystals have the largest BET surface area. Obviously, the conversion temperature of the blank PT support is not dominated only by their surface areas. Furthermore, the surface states of the blank supports were characterized by XPS analysis, as shown in Fig. 4b. For the three supports, the binding energies of Ti2p are 458.07 eV, 457.13 eV and 457.12 eV, indicative of the typical Ti4+ and Ti3+ ions, respectively.40 These results may allow us to expect that accompanied with Ti3+, more defects, such as oxygen vacancies, exist on the {001} and {100} of PT supports, possibly leading to a higher catalytic activity of the support by improving O2 molecular adsorption than that of {111} of PT.
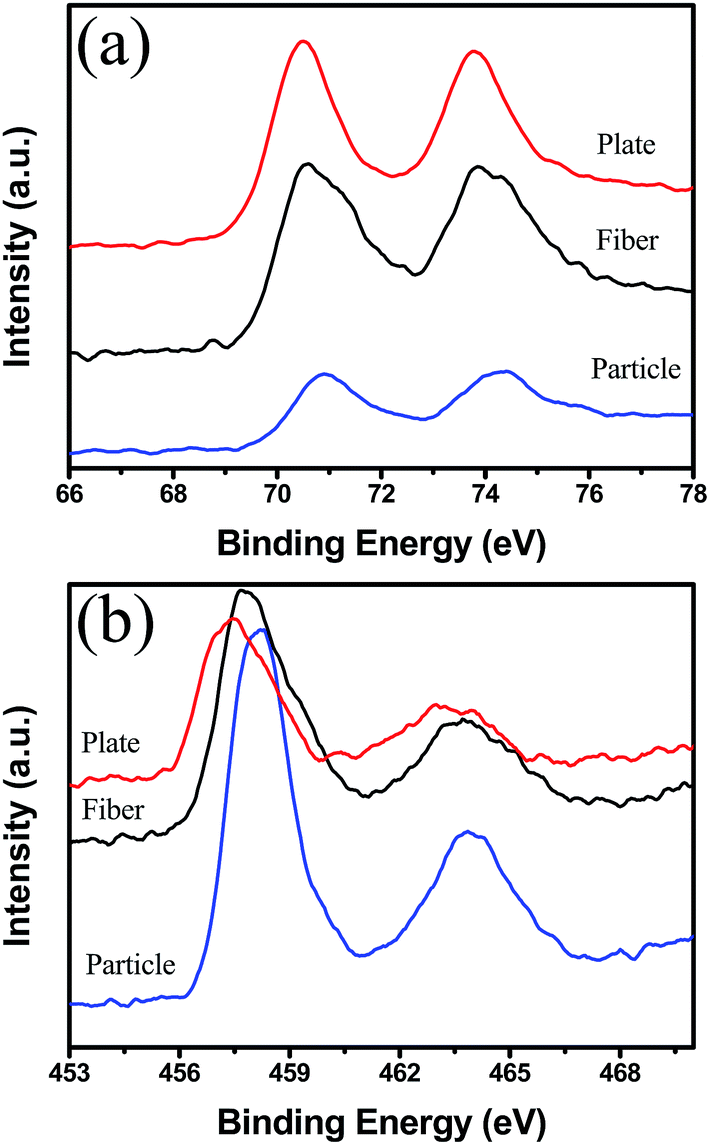 | ||
| Fig. 4 (a) Pt4f and (b) Ti2p XPS spectra of Pt/PT nanostructures. | ||
According to Fig. 3a, however, the Pt-free nanofibers demonstrated almost no activity of CO oxidation up to 250 °C. For blank support, CO and O2 molecular adsorption as well as subsequent oxidation reaction simultaneously occurred on the surface of the supports. Moreover, the O2 molecular adsorption as rds also occurred on the surface of supports in the cases of Pt-loaded PT. Although the three systems presented very similar reaction order of O2 in Fig. 3b, the reaction rate at the same condition is different, and the lowest one is the case of the blank nanofibers. The adsorption of the molecular oxygen as electron-withdrawing adsorbate with large dipole (∼2.92D) has been proposed to be greatly enhanced in a negative electric field mainly through the first-order stark effect.41 Such field can be generated by a negatively poled ferroelectric surface here in {001} and {111} PT, whereas the polar surfaces are not involved in the {100} PT. Particularly, ferroelectric polarization are completely projected on the {001} of tetragonal PT (vertical to polar c axis), and partial ferroelectric polarization projection occurs on {111}. This suggests that the absorption process of O2 should be more favourable on the {001} and {111} than that of {100} for PT, which may explain the change in CO oxidation performance of the blank supports in Fig. 3a.
Furthermore, for the Pt/PT systems, the CO catalytic oxidation reaction centers transferred from the surface of the blank support to Pt NPs on them in Fig. 3a, where CO adsorbed on the surface of Pt and O2 adsorbed on PT. Due to a very low lattice mismatch, Pt nanocrystals with a size of 3–5 nm were successfully obtained and well dispersed on {111} of PT nanocrystals. Larger area by reduced size and more reactive sites on {111} of Pt are crucial for lowering the energy barrier and reaction temperature of CO oxidation. In addition, from the nanoplates and nanofibers to the nanocrystal support, the increased binding energies of Pt4f7/2 and Pt4f5/2, respectively, imply increased oxidization states of Pt on the PT nanocrystals. A broad shoulder of Pt4f5/2 for the Pt/PT nanocrystals (as in Fig. 4a) is indicative of Pt2+ (ref. 42) that could originate from the surface oxidation states of the Pt NPs due to the decreased size, as shown in Fig. 2. Such surface oxidation state of Pt also can make important contribution to improving the reaction activity of CO oxidation for the Pt/PT nanocrystals, where this effect is not obvious for the other two systems. Therefore, it is not difficult to understand that the Pt/PT nanocrystal system have the lowest 100% CO conversion temperature and the lowest Ea of (22.9(±0.4) kcal mol−1) among three supports.
Derived from Fig. 3b, the reaction of CO oxidation for Pt/PT present here experienced a bifunctional pathway, where a reaction occurred between CO adsorbed on Pt and oxygen from support, and the O2 molecular adsorption controlled kinetics here (reaction determining step, rds,  ).43 For the three systems, the saturated absorption of CO on Pt NPs can be achieved easily since a less negative reaction order for CO was obtained from Fig. 3b. It is thus supposed that the reaction kinetics and Ea here are mainly determined by O2 molecular adsorption process and subsequent oxidation reaction, especially for Pt/PT nanoplate and nanofiber systems.
In summary, the single-crystal nanofiber, nanoplate and truncated octahedron nanoparticle of perovskite PT, where {100}, {001} and {111} are dominantly exposed, have been employed as the supports to investigate the crystal plane effect on the size, distribution, surface chemical states of deposited Pt nanoparticles and thus their catalytic dynamics towards CO oxidation. It was revealed that the ability to obtain well-dispersed Pt nanoparticles decreased from {111}, {100} to {001} of tetragonal perovskite PT. The Ea of CO oxidation are 22.9(±0.4) kcal mol−1 for Pt/PT nanocrystals, 26.5(±1.6) kcal mol−1 for Pt/PT nanoplates, and 32.7(±2.9) kcal mol−1 for Pt/PT nanofibers, and a bifunctional pathway, where a reaction occurred between CO adsorbed on Pt and oxygen from support, and the O2 molecular adsorption controlled kinetics, has been revealed. The findings described here suggest that the exposed facets of perovskite nanostructures play a key role in the growth and surface state of Pt NPs, offering the opportunity to tailor and optimize catalytic performance.
Acknowledgements
This work was financially supported by National Natural Science Foundation of China (No. 51602286, 51232006, 51472218, 21102212, and 51302247), General Scientific Research Project of Department of Education of Zhejiang Province (Y201534612) and Science Foundation of Zhejiang Sci-Tech University (Grant no. 15022084-Y). And we especially appreciate the financial support from the Young Researchers Foundation of Zhejiang Provincial Key Laboratory of Fiber Materials and Manufacturing Technology, Zhejiang Sci-Tech University (2016QN05).Notes and references
- M. S. Chen and D. W. Goodman, Science, 2004, 306, 252–255 CrossRef CAS PubMed.
- X. F. Wu, P. Anbarasan, H. Neumann and M. Beller, Angew. Chem., Int. Ed., 2010, 49, 9047–9050 CrossRef CAS PubMed.
- T. Yu, D. Y. Kim, H. Zhang and Y. N. Xia, Angew. Chem., Int. Ed., 2011, 50, 2773–2777 CrossRef CAS PubMed.
- H. W. Gao, Appl. Surf. Sci., 2016, 379, 347–357 CrossRef CAS.
- D. W. Ma, W. W. Ju, T. X. Li, X. W. Zhang, C. Z. He, B. Y. Ma, Z. S. Lu and Z. X. Yang, Appl. Surf. Sci., 2016, 383, 98–105 CrossRef CAS.
- H. B. Huang, Y. Xu, Q. Y. Feng and D. Y. C. Leung, Catal. Sci. Technol., 2015, 5, 2649–2669 CAS.
- F. Qi, H. Saltsburg, F. Stephanopoulos and M. Flytzani-Stephanopoulos, Science, 2003, 301, 935–938 CrossRef PubMed.
- A. Canlier, U. V. Ucak, H. Usta, C. S. Cho, J. Y. Lee, U. Sen and M. Citir, Appl. Surf. Sci., 2015, 350, 79–86 CrossRef CAS.
- S. Bonanni, K. A. Mansour, W. Harbich and H. Brune, J. Am. Chem. Soc., 2012, 134, 3445–3450 CrossRef CAS PubMed.
- G. F. Wei, C. Shang and Z. P. Liu, Phys. Chem. Chem. Phys., 2015, 17, 2078–2087 RSC.
- M. Arenz, K. J. J. Mayrhofer, V. Stamenkovic, B. B. Blizanac, T. Tomoyuki, P. N. Ross and N. M. Markovic, J. Am. Chem. Soc., 2005, 127, 6819–6829 CrossRef CAS PubMed.
- C. M. Kalamaras, D. D. Dionysiou and A. M. Efstathiou, ACS Catal., 2012, 2, 2729–2742 CrossRef CAS.
- C. K. Tsung, J. N. Kuhn, W. Y. Huang, C. Aliaga, L. I. Hung, G. A. Somorjai and P. D. Yang, J. Am. Chem. Soc., 2009, 131, 5816–5822 CrossRef CAS PubMed.
- Q. L. Liu, U. A. Joshi, K. Uber and J. R. Regalbuto, Phys. Chem. Chem. Phys., 2014, 16, 26431–26435 RSC.
- Y. Lin, J. Petroski and M. A. EI-Sayed, J. Phys. Chem. B, 2000, 104, 10956–10959 CrossRef.
- R. Narayanan and M. A. EI-Sayed, J. Am. Chem. Soc., 2004, 126, 7194–7195 CrossRef CAS PubMed.
- F. Micoud, F. Maillard, A. Bonnefont, N. Job and M. Chatenet, Phys. Chem. Chem. Phys., 2010, 12, 1182–1193 RSC.
- J. P. Dacquin, M. Cabié, C. R. Henry, C. Lancelot, C. Dujardin, S. R. Raouf and P. Granger, J. Catal., 2010, 270, 299–309 CrossRef CAS.
- R. Si and M. F. Stephanopoulos, Angew. Chem., Int. Ed., 2008, 120, 2926–2929 CrossRef.
- J. A. Enterkin, K. R. Poeppelmeier and L. D. Marks, Nano Lett., 2011, 11, 993–997 CrossRef CAS PubMed.
- J. A. Enterkin, W. Setthapun, J. W. Elam, S. T. Christensen, F. A. Rabuffetti, L. D. Marks, P. C. Stair, K. R. Poeppelmeier and C. L. Marshall, ACS Catal., 2011, 1, 629–635 CrossRef CAS.
- J. F. Scott, Science, 2007, 315, 954–959 CrossRef CAS PubMed.
- S. M. Yin, H. Tian, Z. H. Ren, X. Wei, C. Y. Chao, J. Y. Pei, X. Li, G. Xu, G. Shen and G. R. Han, Chem. Commun., 2014, 50, 6027–6030 RSC.
- S. M. Yin, Y. H. Zhu, Z. H. Ren, C. Y. Chao, X. Li, X. Wei, G. Shen, Y. Han and G. R. Han, J. Mater. Chem. A, 2014, 2, 9035–9039 CAS.
- Z. H. Ren, G. Xu, Y. Liu, X. Wei, Y. H. Zhu, X. B. Zhang, G. L. Lv, Y. W. Wang, Y. W. Zeng, P. Y. Du, W. J. Weng, G. Shen, J. Z. Jiang and G. R. Han, J. Am. Chem. Soc., 2010, 132, 5572–5573 CrossRef CAS PubMed.
- S. Y. Gong, Z. H. Ren, S. Jiang, M. Li, X. Li, X. Wei, G. Xu, G. Shen and G. R. Han, J. Phys. Chem. C, 2014, 118, 5486–5493 CAS.
- C. Y. Chao, Z. H. Ren, Y. H. Zhu, Z. Xiao, Z. Y. Liu, G. Xu, J. Q. Mao, X. Li, G. Shen and G. R. Han, Angew. Chem., Int. Ed., 2012, 51, 9283–9287 CrossRef CAS PubMed.
- S. Jiang, Z. H. Ren, S. M. Yin, S. Y. Gong, Y. F. Yu, X. Li, X. Wei, G. Xu, G. Shen and G. R. Han, ACS Appl. Mater. Interfaces, 2014, 6, 10935–10940 CAS.
- Z. Y. Liu, Z. H. Ren, Z. Xiao, C. Y. Chao, X. Wei, Y. Liu, X. Li, G. Xu, G. Shen and G. R. Han, Small, 2012, 8, 2959–2963 CrossRef CAS PubMed.
- S. Kim, M. R. Schoenberg and A. M. Rappe, Phys. Rev. Lett., 2011, 107, 076102 CrossRef PubMed.
- A. D. Allian, K. Takanabe, K. L. Fujdala, X. H. Hao, T. J. Truex, J. Cai, C. Buda, M. Neurock and E. Iglesia, J. Am. Chem. Soc., 2011, 133, 4498–4517 CrossRef CAS PubMed.
- S. Ladas, H. Poppa and M. Boudart, Surf. Sci., 1981, 102, 151–171 CrossRef CAS.
- S. H. Oh and C. C. Eickel, J. Catal., 1991, 128, 526–536 CrossRef CAS.
- T. Zambelli, J. V. Barth, J. Wintterlin and G. Ertl, Nature, 1997, 390, 495–497 CrossRef CAS.
- J. T. Roberts and C. M. Friend, J. Phys. Chem. B, 1988, 92, 5205–5213 CrossRef CAS.
- R. H. Nibbelke, M. A. J. Campman, J. H. B. J. Hoebink and G. B. Marin, J. Catal., 1997, 171, 358–373 CrossRef CAS.
- M. A. Henderson, W. S. Epling, C. L. Perkins and C. H. F. Peden, J. Phys. Chem. B, 1999, 103, 5328–5337 CrossRef CAS.
- R. W. McCabe and L. D. Schmidt, Surf. Sci., 1977, 66, 101–124 CrossRef CAS.
- G. S. Zafiris and R. J. Gorte, J. Catal., 1993, 140, 418–423 CrossRef CAS.
- J. Moulder, W. Stickle, F. P. E. K. Sobol and D. Bomben, Physical Electronics, 1992, p. 73 Search PubMed.
- M. P. Hyman and J. W. Medlin, J. Phys. Chem. B, 2005, 109, 6304–6310 CrossRef CAS PubMed.
- Q. Pang, J. M. Zhang, K. W. Xu and V. Ji, Appl. Surf. Sci., 2009, 255, 8145–8152 CrossRef CAS.
- V. P. Zhdanov, Surf. Sci. Rep., 1991, 12, 185–242 CrossRef.
| This journal is © The Royal Society of Chemistry 2017 |