 Open Access Article
Site-selective Eu(III) spectroscopy of highly efficient luminescent mixed-metal Pb(II)/Eu(III) coordination polymers†
C. D. E. S.
Barbosa
ab,
L. L.
da Luz
a,
F. A. Almeida
Paz
c,
O. L.
Malta
a,
M. O.
Rodrigues
d,
S. A.
Júnior
a,
R. A. S.
Ferreira
 b and
L. D.
Carlos
 *b
*b
aUniversity Federal of Pernambuco, Department of Chemistry, Laboratório de Terras Raras, 50590-470, Recife, Brazil
bDepartment of Physics and CICECO – Aveiro Institute of Materials, University of Aveiro, 3810-193 Aveiro, Portugal. E-mail: lcarlos@ua.pt
cDepartment of Chemistry, CICECO – Aveiro Institute of Materials, University of Aveiro, 3810-193 Aveiro, Portugal
dUniversity of Brasília (IQ – UNB), Campus Universitário Darcy Ribeiro, LIMA – Laboratório de Inorgânica e Materiais, 70904970, Brasília, Brazil
First published on 18th January 2017
Abstract
Novel mixed-metal coordination polymers (CPs) based on Pb1−xEux–BDC (x = 0.05, 0.10, 0.25, 0.50 and BDC = 1,4-benzenedicarboxylic acid) are reported. The materials display different coordination structures as the Pb![[thin space (1/6-em)]](https://www.rsc.org/images/entities/char_2009.gif) :
:![[thin space (1/6-em)]](https://www.rsc.org/images/entities/char_2009.gif) Eu metal ratio is modified. Whereas for x < 0.25 the Eu3+ ions essentially replace the Pb2+ ones in the [Pb(BDC)n] structure, for x > 0.25 the samples are isotypical with [Eu2(BDC)3(H2O)4], as shown by powder (including Rietveld analysis) and single-crystal X-ray diffraction. The unique Pb0.75Eu0.25–BDC compound displays a mixture of both crystalline phases with the highest emission quantum yield value reported for luminescent CPs based on Pb(II), 69 ± 7%. Site-selective excitation using a common Xe lamp permits the detailed study of the two Eu3+ local sites, illustrating how powerful the Eu3+ luminescence is as a local probe spectroscopic tool.
Eu metal ratio is modified. Whereas for x < 0.25 the Eu3+ ions essentially replace the Pb2+ ones in the [Pb(BDC)n] structure, for x > 0.25 the samples are isotypical with [Eu2(BDC)3(H2O)4], as shown by powder (including Rietveld analysis) and single-crystal X-ray diffraction. The unique Pb0.75Eu0.25–BDC compound displays a mixture of both crystalline phases with the highest emission quantum yield value reported for luminescent CPs based on Pb(II), 69 ± 7%. Site-selective excitation using a common Xe lamp permits the detailed study of the two Eu3+ local sites, illustrating how powerful the Eu3+ luminescence is as a local probe spectroscopic tool.
Introduction
Coordination polymers (CPs) and Metal–Organic Frameworks (MOFs) constitute ionic classes of hybrid materials having received a wide scientific attention.1–4 The hybrid character of these materials arising from the coordination between metal ions (or their clusters) and multifunctional organic ligands grant them a wide range of applications.4–6 Mixed-ligand and mixed-metal CPs have been then synthesized through distinct synthetic protocols based in mixtures of different types of organic ligands and metal ions.7–10 The presence of more than one metal ion or organic ligand in CP structures permits a fine tuning of the material's properties, e.g., optical, catalytic, electronic, host–guest, magnetic, shape specificity and ion exchange.11–15In particular, Pb-containing CPs present interesting luminescent properties,16–18 and mixed-metal materials based on Pb2+ have been previously reported.19–21 Nevertheless, materials based on Pb2+ and Ln3+ ions are scarce. The first example of a 6p–4f heterometallic MOF was reported by Wang et al.22 and, more recently, Pan et al. showed white-light emission in two series of heteronuclear Pb2+–Ln3+ complexes.23
Here, we report new photoluminescent 6p–4f heterometallic CPs, based on distinct Pb2+/Eu3+ ratios and 1,4-benzenedicarboxylic acid (BDC). The Pb1−xEux–BDC (x = 0.05, 0.10, 0.25, 0.50 and 1.00) materials were characterized by X-ray powder diffraction, single crystal X-ray diffraction and luminescence spectroscopy. Whereas for x = 0.05 and 0.10 the Pb1−xEux–BDC compounds are structurally similar to [Pb(BDC)]n,24–27 for x = 0.50 the CP exhibits the structure of the [Eu2(BDC)3(H2O)4] hydrated phase.28,29 The Pb0.75Eu0.25–BDC compound displays a mixture of both crystalline phases with a intriguing high emission quantum yield (69 ± 7%). Moreover, site-selective and time-resolved spectroscopy enabled the detailed study of the two Eu3+ local sites in that CP illustrating how powerful the Eu3+ luminescence is as a local probe spectroscopic tool. Although Eu3+ luminescence was often used as a local structural probe in nanoparticles,30,31 sol–gel derived hybrid materials32,33 and ceramics,34,35 this is, as far as we know, the first example of the use of this powerful tool in CPs and MOFs.
Experimental
Synthesis
Disodium terephthalate, C6H4(COONa)2 (Na2BDC, lç 0 Alfa Aesar, 99.0%), Pb(NO3)2 (VETEC, 99.0%) and Eu(NO3)3·5H2O (Aldrich, 99.9%) were analytical grade and used as purchased. All solutions were prepared with ultrapure water. With the overall aim to include in the Pb2+–terephthalic acid optically-active as Eu3+ ions in order to design new photoluminescent materials, Pb1−xEux–BDC (x = 0.05, 0.10, 0.25, 0.50) CPs were prepared using different Pb2+/Eu3+ (mmol mmol−1) molar ratios (0.95![[thin space (1/6-em)]](https://www.rsc.org/images/entities/char_2009.gif) :
:![[thin space (1/6-em)]](https://www.rsc.org/images/entities/char_2009.gif) 0.05, 0.90
0.05, 0.90![[thin space (1/6-em)]](https://www.rsc.org/images/entities/char_2009.gif) :
:![[thin space (1/6-em)]](https://www.rsc.org/images/entities/char_2009.gif) 0.10, 0.75
0.10, 0.75![[thin space (1/6-em)]](https://www.rsc.org/images/entities/char_2009.gif) :
:![[thin space (1/6-em)]](https://www.rsc.org/images/entities/char_2009.gif) 0.25, 0.50
0.25, 0.50![[thin space (1/6-em)]](https://www.rsc.org/images/entities/char_2009.gif) :
:![[thin space (1/6-em)]](https://www.rsc.org/images/entities/char_2009.gif) 0.50) and 0.50 mmol of Na2BDC, with 14 mL of H2O. The mixture was transferred to Teflon® lined autoclaves (25 mL) and the reaction took place under static hydrothermal conditions in ovens preheated at 393 K over a period of 3 days. The obtained materials were filtered, washed at room temperature with ultrapure water and dried at 313 K. For comparative purposes, the monometallic [Pb(BDC)]n and [Eu2(BDC)3(H2O)4] CPs were synthesized following the same procedure described above.
0.50) and 0.50 mmol of Na2BDC, with 14 mL of H2O. The mixture was transferred to Teflon® lined autoclaves (25 mL) and the reaction took place under static hydrothermal conditions in ovens preheated at 393 K over a period of 3 days. The obtained materials were filtered, washed at room temperature with ultrapure water and dried at 313 K. For comparative purposes, the monometallic [Pb(BDC)]n and [Eu2(BDC)3(H2O)4] CPs were synthesized following the same procedure described above.
Scanning electron microscopy (SEM)
SEM images of Pb1−xEux–BDC (x = 0.05, 0.10, 0.25 and 0.50) were acquired using a Shimadzu SS550 microscope with a tungsten filament operated at 15–20 kV. SEM images of the [Pb(BDC)]n and [Eu2(BDC)3(H2O)4] CPs were collected using a Hitachi TM3000 microscope operated at 20 kV.Powder X-ray diffraction (PXRD)
The PXRD data were collected at room temperature (300 K) on a Bruker D8 Advance powder X-ray diffractometer using Bragg–Brentano geometry with Cu Kα radiation. The diffractograms were acquired in the angular range 2θ between 5° and 50° in steps of 0.01°. The crystallinity and phase mixtures have been determined by Rietveld refinements to the XRD patterns.36 The Rietveld refinement for Pb1−xEux–BDC (x = 0.05, 0.10, 0.25, 0.50) were performed with the GSAS/EXPGUI37 software using as starting premise the atomic coordinates of the previously reported [Pb(BDC)]n (ref. 24–27) and [Eu2(BDC)3(H2O)4]28,29 structures. The preferential orientation was corrected using the spherical harmonic model (tenth order) proposed by Jarvinen,38 the peak profile was adjusted by the Thompson–Cox–Hastings function modified by Young and Desai (pV-TCHZ),39,40 the surface roughness correction was refined by the Pitschke function and the background was fitted by an eighth-degree shifted Chebyshev polynomial function.41 In the final run, the following parameters were refined: scale factor, background and absorption coefficients, spherical harmonic, unit-cell parameters and pV-TCHZ correction. The quantitative phase analysis was performed in accordance with the method proposed by Howard et al.42Single-crystal XRD of Pb0.90Eu0.10–BDC
Single crystals of the mixed-metal Pb0.90Eu0.10–BDC CPs were manually harvested from dried samples and immersed in highly viscous FOMBLIN Y perfluoropolyether vacuum oil (LVAC 140/13, Sigma-Aldrich).43 Crystals were mounted on a Hampton Research CryoLoop with the help of a Stemi 2000 stereomicroscope equipped with Carl Zeiss lenses. XRD data were collected at 180(2) K on a Bruker X8 Kappa APEX II charge-coupled device (CCD) area-detector diffractometer (Mo Kα graphite-monochromated radiation, λ = 0.7107 Å) controlled by the APEX2 software package,44 and an Oxford Instruments Cryostrem 700 Series low temperature device monitored remotely by the software interface Cryopad.45 Diffraction images were processed using the software package SAINT+,46 and data were corrected for absorption by the multiscan semi-empirical method implemented in SADABS.47 The structure was solved using the algorithm implemented in SHELXT-2014,48 which allowed the immediate location of almost all of the heaviest atoms composing the asymmetric unit. The remaining missing and misplaced non-hydrogen atoms were located from difference Fourier maps calculated from successive full-matrix least-squares refinement cycles on F2 using the latest SHELXL from the 2014 release.48,49 All structural refinements were performed using the graphical interface ShelXle.50The inclusion of both Pb2+ and Eu3+ metallic centers in the crystal structure was achieved by restraining the atomic coordinates and the thermal parameters to common values. In later stages of the overall refinement, the site occupancies of the two metal centers were allowed to refine freely, ultimately converging to values close to 0.85 and 0.10, respectively. These values were fixed for the last refinement of the crystal structure, ultimately accounting for the inclusion of 5% of site vacancies and explaining the reason why the unit cell contains a non-integer number of atoms. Hydrogen atoms bound to carbon were placed at their idealized positions using the HFIX 43 instruction in SHELXL. These hydrogen atoms were included in subsequent refinement cycles with isotropic thermal displacements parameters (Uiso) fixed at 1.2 × Ueq of the parent carbon atoms.
Crystal data for Pb0.90Eu0.10–BDC: C8H4Eu0.10O4Pb0.85, M = 355.42, orthorhombic, space group Pbca, Z = 8, a = 7.6820(12) Å, b = 10.2672(15) Å, c = 18.256(3) Å, V = 1439.9(4) Å3, μ(Mo-Kα) = 20.768 mm−1, Dc = 3.279 g cm−3, colorless prism with crystal size of 0.08 × 0.06 × 0.02 mm3. Of a total of 11![[thin space (1/6-em)]](https://www.rsc.org/images/entities/char_2009.gif) 484 reflections collected, 1922 were independent (Rint = 0.0452). Final R1 = 0.0253[I > 2σ(I)] and wR2 = 0.0543 (all data). Data completeness to theta = 25.24°, 99.8%. The last difference Fourier map synthesis showed the highest peak (1.476 e Å−3) and the deepest hole (−1.406 e Å−3) located at 0.69 and 0.78 Å from the mixed-metal site Pb1/Eu1, respectively. Structural drawings have been created using the software package Crystal Impact Diamond.51
484 reflections collected, 1922 were independent (Rint = 0.0452). Final R1 = 0.0253[I > 2σ(I)] and wR2 = 0.0543 (all data). Data completeness to theta = 25.24°, 99.8%. The last difference Fourier map synthesis showed the highest peak (1.476 e Å−3) and the deepest hole (−1.406 e Å−3) located at 0.69 and 0.78 Å from the mixed-metal site Pb1/Eu1, respectively. Structural drawings have been created using the software package Crystal Impact Diamond.51
Crystallographic data (including structure factors) for the crystal structure of compound Pb0.90Eu0.10–BDC have been deposited with the Cambridge Crystallographic Data Centre as supplementary publication no. CCDC 1490068.†
Photoluminescence spectroscopy
Photoluminescence spectra were recorded on a Fluorolog-3® (Horiba scientific) with double-excitation spectrometer and a single-emission spectrometer (TRIAX 320) coupled to a R928 photomultiplier, using the front-face acquisition mode. The excitation source was a 450 W xenon lamp. The emission spectra were corrected for the spectral response of the excitation monochromator using a correction file provided by manufacture and the excitation spectra were weighed for the spectral distribution of the lamp intensity using a photodiode reference detector. Time-resolved emission spectra and emission decay curves were acquired using the same equipment with a pulsed Xe–Hg lamp (6 × 10⁻³ s pulse at half-width and 20–30 × 10−6 s tail) as the excitation source. The emission quantum yields were measured using the C9920-02 from Hamamatsu system with a 150 W Xe lamp coupled to a monochromator for wavelength discrimination, an integration sphere as sample chamber and a multichannel analyzer for signal detection. Three measurements were made for each sample, and the average values obtained are reported with accuracy within 10% accorded to the manufacturer.Results and discussion
XRD and PXRD studies
Fig. 1 shows the PXRD data collected for [Pb(BDC)]n, Pb1−xEux–BDC, (x = 0.05, 0.10, 0.25, 0.50) and [Eu2(BDC)3(H2O)4]. The simulated patterns of the [Pb(BDC)]n and [Eu2(BDC)3(H2O)4] compounds are also displayed. SEM images in Fig. 2 show that the size and morphology of the microcrystals are greatly influenced by the relative amount of incorporated Eu3+ ions. Similarly to [Pb(BDC)]n, the crystal habit of Pb1−xEux–BDC, with x = 0.05, 0.10, is based on block-like microcrystals. For x = 0.10, some crystals show the presence of a minor amount of smaller particles with a well-defined plate-like shape. These particles correspond to the [Eu2(BDC)3(H2O)4] phase (see below). However, the x = 10 microcrystals chosen for single-crystal XRD studies do not shown evidence of any plate-like particles, as confirmed by the corresponding structural elucidation: a single phase mixed-metal Pb0.90Eu0.10–BDC CP (see below). In Pb1−xEux–BDC (x = 0.25 and 0.50) the block-like microcrystals are stacked together with well-defined platelets, analogous to those seen in [Eu2(BDC)3(H2O)4], Fig. 2. This mixture of phases is also discerned in PXRD and photoluminescence data.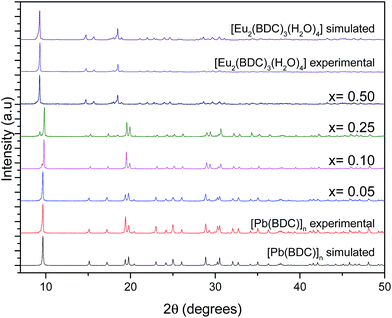 | ||
| Fig. 1 Simulated patterns of [Pb(BDC)]n and [Eu2(BDC)3(H2O)4] and PXRD patterns of [Pb(BDC)]n, Pb1−xEux–BDC, with x = 0.05, 0.10, 0.25, 0.50, and [Eu2(BDC)3(H2O)4]. | ||
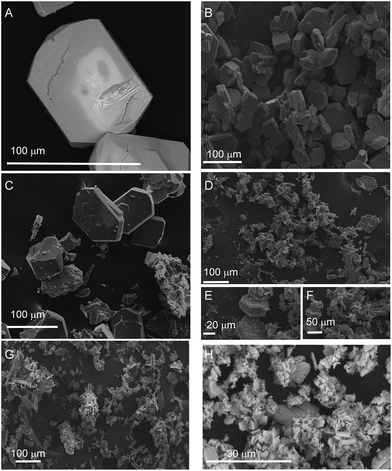 | ||
| Fig. 2 SEM images of (A) [Pb(BDC)]n, Pb1−xEux–BDC CPs (B) x = 0.05, (C) x = 0.10, (D–F) x = 0.25, (G) x = 0.50 and (H) [Eu2(BDC)3(H2O)4]. | ||
The PXRD patterns show clearly that the mixed-metal Pb1−xEux–BDC (x = 0.05 and 0.10) compounds are structurally similar to [Pb(BDC)]n, whose structure was originally reported by Tan et al.24 and later re-determined a handful of times.25–27 This was unequivocally confirmed by Rietveld refinement, Fig. S1 and S2 (ESI†). Thus, we report the reader to these previous publications for additional structural details which are not described in this manuscript.
For approximately an 0.25% inclusion of Eu3+ a structural change occurs and Pb0.75Eu0.25–BDC is composed by a mixture of the [Pb(BDC)]n phase and another known CP structure solely based on Eu3+:[Eu2(BDC)3(H2O)4].28,29 For this phase the Eu3+ eight-coordination sphere involves six oxygen of the BDC ligand and two water molecules in a C4 local pseudo-symmetry group.29 Rietveld quantitative phase analysis reveals that Pb0.75Eu0.25–BDC has 0.90 and 0.10 of [Pb(BDC)]n and [Eu2(BDC)3(H2O)4], respectively (Fig. S3, ESI†). These structures should be, somehow, related and to further investigate this we decided to employ a typical topological analysis in which each network is mathematically reduced into central nodes and connecting rods. Their selection needs, however, to be careful and structurally meaningful. Following the description by Alexandrov et al.,52 who suggested that any moiety (ligand or atoms) connecting more than two metallic centers (μn) should be considered as a network node, the center of gravity of the ligand itself was considered as a node, alongside with the metallic center. In this way, as revealed by the software package TOPOS, while Pb0.90Eu0.10–BDC is a 6,6-connected binodal network of the 6,6T23 topological type, [Eu2(BDC)3(H2O)4] is instead a 4,4,6-connected trinodal framework belonging to the 4,4,6T24 family. We note that for both structures the metallic centers are 6-connected. Because of the smaller ionic radius of Eu3+ and the absence of the lone pair of electrons of Pb2+, in the latter framework the overall connectivity of the organic linkers is reduced from six to four.
Pb1−xEux–BDC, with x = 0.50 and 1.00, are structurally similar to [Eu2(BDC)3(H2O)4] (the Rietveld refinement for x = 0.50 is shown in Fig. S4, ESI†).
Single-crystal XRD studies of Pb0.90Eu0.10–BDC
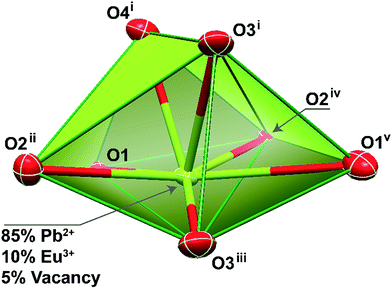
For approximately an 10% inclusion of Eu3+ (Pb0.90Eu0.10–BDC), we were able to obtain single-crystals large enough which allowed an unequivocally structural elucidation using single-crystal XRD at low temperature. As expected, the unit cell parameters and space group match those previously reported for the pure Pb2+ material,24–27 showing that the three-dimensional network remain essentially unaltered. However, during the refinement stages, a charge problem arose: because of the inclusion of +3 charges at the sites of the +2 charges, and in the absence of voids capable of accommodate partially-occupied counter-ions to balance the crystal charge, the metallic center site has mandatorily to also be occupied by vacancies. Indeed, during the last stage of the refinement stage the site occupancies for Pb2+ and Eu3+ were allowed to refine freely, concerning to values of ca. 0.85 and 0.10, respectively. This agrees well with a presence of ca. 5% of vacancies while the crystal charge remains neutral.The mixed-metal Pb0.90Eu0.10–BDC CP is based on a single metallic center (M), statistically occupied by ca. 85% of Pb2+, 10% of Eu3+ plus 5% of vacancies (Fig. 3).
As previously described for the other structural determinations,24–27 the M center appear 7-coordinated, {MO7}, with the overall coordination polyhedron being significantly distorted due to the presence of a stereoactive lone pair of electrons belonging to the Pb2+ metallic center. Indeed, considering the position of this lone pair of electrons as a possible coordination site, the overall coordination sphere resembles very much a highly distorted pentagonal bipyramid, with the M–O distances ranging between 2.483(4) and 2.775(4) Å. It is important to notice that there is a nearby oxygen atom from a carboxylate group which could be, in theory, interacting with the metallic center [at a distance of 3.037(4) Å]. A search in the Cambridge Structural Database (Version 5.37 with two updates – February 2016)53 reveals that even though the known range of Pb–O interactions shows up distances up to 3.33 Å, the number of structures in which this appears is extremely small with the vast majority showing values around the mean value of 2.61 Å.
This coordination environment resembles a polyhedron with a C2v pseudo-symmetry. Taking into account the fact that when the Pb2+ metallic center is replaced by Eu3+ the lone pair is removed from the overall coordination polyhedron, it is thus feasible to assume that the Eu3+ environment will readjust itself so to better accommodate the organic ligands. Ultimately, the Eu3+ local symmetry is also changed, as we will discuss below.
The crystal packing of Pb0.90Eu0.10–BDC is rather featureless, being as depicted in Fig. 4 described as the parallel packing of inorganic metal oxide layers (in this compound with also ca. 5% of vacancies) placed in the ab plane of the unit cell, pillared along the [001] direction by the organic linkers. Though the structure is rich in oxygen atoms capable of accepting hydrogen atoms in supramolecular interactions, the structure only possesses such atoms attached to carbon which are also not located in a position to establish such interactions. Thus, no structurally-relevant supramolecular interactions exist in the present compound, being the packing solely driven by the coordination features to the metallic centers.
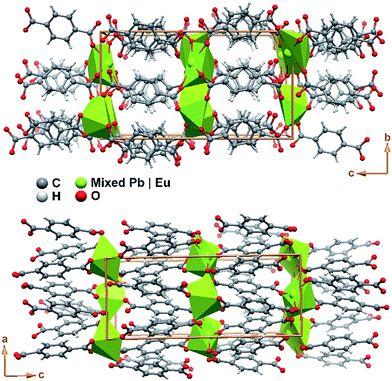 | ||
| Fig. 4 Schematic representation of the crystal packing of compound Pb0.90Eu0.10–BDC viewed in perspective along the (top) [100] and (bottom) [010] directions of the unit cell. | ||
For higher concentration of Eu3+ in the reactive gel (≥25%) the structure does not seem to be robust enough to accommodate the total inclusion of these optically-active metallic centers in the framework. This is most likely due to the fact that the amount of vacancies needed to maintain the crystal charge neutral is so large that the structure would collapse (or, in this case, it is not even formed).
Eu3+ luminescence as a structural local probe
Fig. 5 shows the emission spectra of the Pb1−xEux–BDC (x = 0.05, 0.10, 0.25, 0.50) and [Eu2(BDC)3(H2O)4] CPs. The relative intensity and number of Stark components of the 5D0 → 7F0–4 transitions strongly depend on the Eu3+ concentration, due to the presence of the [Pb(BDC)]n and [Eu2(BDC)3(H2O)4] phases.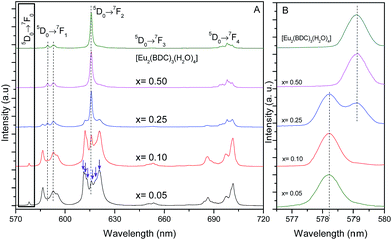 | ||
| Fig. 5 (A) Emission spectra (300 K) of Pb1−xEux–BDC (x = 0.05, 0.10, 0.25, 0.50) and [Eu2(BDC)3(H2O)4] excited at 315 nm. (B) Magnification of the 5D0 → 7F0 transition. | ||
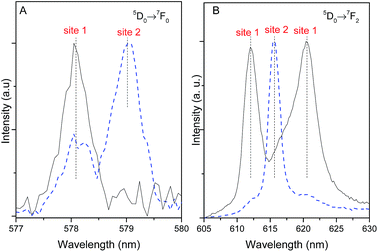
The emission spectra of Pb1−xEux–BDC (x = 0.05, 0.10) display a single 5D0 → 7F0 line (17![[thin space (1/6-em)]](https://www.rsc.org/images/entities/char_2009.gif) 295.1 ± 3.0 cm−1, 578.2 nm) and a local-field splitting of the 7F1,2 levels in 3 and 6 components (at least), respectively. For Pb0.5Eu0.5–BDC, however, the 5D0 → 7F0 transition red-shifts (17
295.1 ± 3.0 cm−1, 578.2 nm) and a local-field splitting of the 7F1,2 levels in 3 and 6 components (at least), respectively. For Pb0.5Eu0.5–BDC, however, the 5D0 → 7F0 transition red-shifts (17![[thin space (1/6-em)]](https://www.rsc.org/images/entities/char_2009.gif) 268.2 ± 3.0 cm−1, 579.1 nm) and the fewer number of 7F1,2 Stark components detected (clearly 2 and 3, respectively) confirms the structural change from [Pb(BDC)]n to [Eu2(BDC)3(H2O)4] pointed out by XRD. It is interesting to note that for x = 0.25 two 5D0 → 7F0 lines are unequivocally observed, being characterized by the same energy values as those found for the lower and more concentrated CPs, indicating the presence of a phase mixture of [Pb(BDC)]n and [Eu2(BDC)3(H2O)4], in accord with the PXRD data. To render easier the following discussion, the local environment of the Eu3+ ions belonging to the [Pb(BDC)]n and [Eu2(BDC)3(H2O)4] compounds will be hereafter termed as site 1 and site 2, respectively.
268.2 ± 3.0 cm−1, 579.1 nm) and the fewer number of 7F1,2 Stark components detected (clearly 2 and 3, respectively) confirms the structural change from [Pb(BDC)]n to [Eu2(BDC)3(H2O)4] pointed out by XRD. It is interesting to note that for x = 0.25 two 5D0 → 7F0 lines are unequivocally observed, being characterized by the same energy values as those found for the lower and more concentrated CPs, indicating the presence of a phase mixture of [Pb(BDC)]n and [Eu2(BDC)3(H2O)4], in accord with the PXRD data. To render easier the following discussion, the local environment of the Eu3+ ions belonging to the [Pb(BDC)]n and [Eu2(BDC)3(H2O)4] compounds will be hereafter termed as site 1 and site 2, respectively.
The number of 7F2 Stark levels discerned for the Pb1−xEux–BDC (x = 0.05 and 0.10) low-concentrated samples, 6 (arrows in Fig. 5A), is higher than the maximum 2J + 1 allowed splitting, suggesting the presence of more than one Eu3+ local environment. This is unequivocally confirmed by the dependence of the emission spectra of those compounds with the excitation wavelength, Fig. S5 (ESI†). In fact, for the 5D0 → 7F1,2 transitions besides the Stark components ascribed to Eu3+ ions in the [Pb(BDC)]n phase (site 1), it is possible to discern the presence of components from [Eu2(BDC)3(H2O)4] (site 2), as highlighted by the vertical lines in Fig. 5A. The fact that the [Eu2(BDC)3(H2O)4] structure is not detected by PXRD readily indicates that for the lower concentrated samples this phase appears in a very reduced relative amount, and thus the dominant local environment of the Eu3+ ions belongs to the [Pb(BDC)]n phase (site 1). The emission spectra of Pb0.5Eu0.5–BDC are independent of the excitation wavelength, Fig. S5 (ESI†), indicating that the sample is formed only by the [Eu2(BDC)3(H2O)4] phase.
Whereas for site 2 each Eu3+ ion occupies the center of a slightly distorted square plane, yielding a metal ion environment with pseudo-C4 symmetry,29 the discussion about the Eu3+-local coordination in the [Pb(BDC)]n phase is, as far as we know, performed for the first time here. As mentioned above, the Eu3+ ions in site 1 replace the structural position of the Pb2+ ions in a C2v local symmetry group. When Eu3+ replace Pb2+ its local environment will readjust itself so to better accommodate the organic ligands and it is expectable a distortion from the C2v local symmetry group. Actually, the presence of the 5D0 → 7F0 transition indicates a local point symmetry of the type Cnv or Cn,54,55 and the ligand field-splitting observed for the 5D0 → 7F1,2 transitions are in agreement with this, even taken into account that the mentioned overlapping between the Stark components of the two phases for Pb1−xEux–BDC (x = 0.05, 0.10 and 0.25). It is plausible that in this seven-fold first coordination sphere, the oxygen-ligating atom leading to a distorted C2v point symmetry contributes to decrease the rank 1 and 3 summations over spherical harmonics in the first coordination sphere (the main contributions to the Ω2 Judd–Ofelt intensity parameter), which would explain the noticeable decrease of the relative intensity of the 5D0 → 7F2 transition, relatively to site 2 local symmetry.
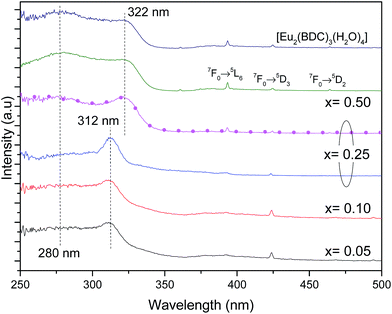
Fig. 6 shows the excitation spectra of Pb1−xEux–BDC (0.05 ≤ x ≤ 0.50) and [Eu2(BDC)3(H2O)4] monitored around the Eu3+ 5D0 → 7F0 transition revealing the presence of a broad band between 240 and 350 nm and a series of low-relative intensity intra-4f6 transitions between the F0 ground state and the 5D4–1, 5G2–6 and 5L6 excited levels. The broad band is formed by one high-energy component centered at ∼280 nm and by a low-energy one, whose peak position depends on the Eu3+ amount, it peaks at ∼312 nm for 0.05 ≤ x ≤ 0.25 and at ∼322 nm for 0.25 ≤ x ≤ 0.50. A similar broad band with two components around 285 nm and 321 nm was also detected for the Na2BDC, being ascribed to BDC excited states (Fig. S6, ESI†). Although the presence of ligand-to-metal charge transfer (LMCT) states which are expected in the range 300–350 nm cannot be ruled out,56,57 we note that a similar broad band with two components around 285 nm and 321 nm was also detected for the Na2BDC. Therefore, we assign the components in the excitation spectra to the preferential contribution of the BDC excited states (Fig. S6, ESI†), as we will detail below. The variation of the energy peak position with the Eu3+ content can be ascribed to the dependence of the local coordination site on the Eu3+ concentration, as it will be detailed below. Independently of the Eu3+ amount the higher relative intensity of the ligand-related components points out that the Eu3+ excited states are mainly sensitized by the ligands rather than by direct intra-4f6 excitation.
We note that for x = 0.25, the excitation spectra depend on the monitoring wavelength being observed a red-shift of the low-energy component from 312 nm to 322 nm, as the monitoring wavelength increases from 578.2 nm (site 1) to 579.1 nm (site 2), readily indicating that the Eu3+ excited states in each local coordination are distinctly populated. Thus, the Pb0.75Eu0.25–BDC CP can be used to demonstrate the Eu3+ ability as a spectroscopic local probe. As above described, there are unequivocal experimental evidences supporting the presence of site 1 and site 2 at x = 0.25 with energy values for the 5D0 → 7F0 transition of 17![[thin space (1/6-em)]](https://www.rsc.org/images/entities/char_2009.gif) 268.2 ± 3.0 cm−1 (579.1 nm) and 17
268.2 ± 3.0 cm−1 (579.1 nm) and 17![[thin space (1/6-em)]](https://www.rsc.org/images/entities/char_2009.gif) 295.1 ± 3.0 cm−1 (578.2 nm), respectively. Usually, site-selective excitation in Eu3+ compounds was performed using a tunable dye laser.55,58,59 The Pb0.75Eu0.25–BDC CP is one of the rare examples in which two Eu3+ sites can be selectively excited through a common Xe lamp, as evidenced below.
295.1 ± 3.0 cm−1 (578.2 nm), respectively. Usually, site-selective excitation in Eu3+ compounds was performed using a tunable dye laser.55,58,59 The Pb0.75Eu0.25–BDC CP is one of the rare examples in which two Eu3+ sites can be selectively excited through a common Xe lamp, as evidenced below.
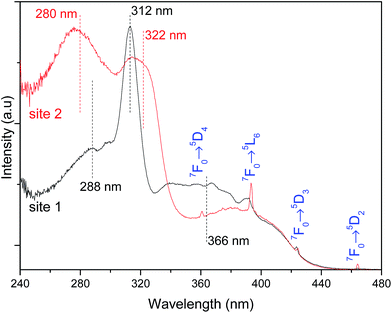
The high-resolution excitation spectra were monitored at the 5D0 → 7F0 energy values of site 1 and site 2 for Pb0.75Eu0.25–BDC CP, Fig. 7. The spectra show the BDC ligand-related bands at ∼288 nm and ∼312 nm for site 1, being observed an enlargement and a shift of these components to ∼275 nm and ∼322 nm, respectively, when site 2 is monitored.
While monitoring site 1, the component at 366 nm shows an increase in its relative intensity, indicating that the Eu3+ ions at site 1 are preferentially excited at this wavelength. We note that while monitoring site 2, it is observed a significant enhancement of the relative intensity of the higher-energetic component, thus, indicating that under excitation around 288 nm, site 2 is favored with respect to the emission arising from site 1. Moreover, site 2 is also favored under direct-intra-4f6 excitation, as the higher relative intensity of the Eu3+ transitions (in comparison with that in the excitation spectrum monitored within site 1) points out.
Based on the information provided by the selective monitoring of the excitation paths that preferentially populate the 5D0 excited states of the Eu3+ at site 1 and site 2, Fig. 8 shows the emission spectra dependence on the excitation wavelength for Pb0.75Eu0.25–BDC. Fig. 8 shows that while exciting site 2 at 366 nm the emission spectrum resembles that of [Eu2(BDC)3(H2O)4], whereas at 280 nm, the spectrum drastically changes being similar to that of the Pb0.95Eu0.05–BDC CP.
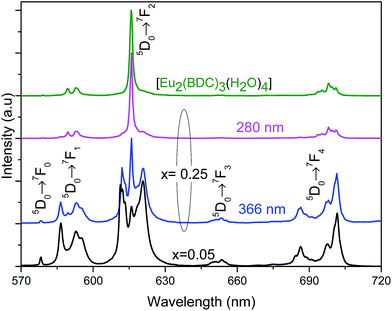 | ||
| Fig. 8 Emission spectra (300 K) of Pb1−xEux–BDC excited at 280 mm and at 366 nm for x = 0.25 and excited at 315 nm for x = 0.05 and [Eu2(BDC)3(H2O)4]. | ||
The 5D0 lifetime values were determined by selectively monitoring the emission at the 5D0 → 7F0 transitions at 578.0 nm (site 1) and 579.0 nm (site 2) and under the same excitation wavelength (315 nm). All the emission decay curves are well reproduced by a single-exponential function (Fig. S7–S12, ESI†), yielding the lifetime values listed in Table 1. The 5D0 lifetime values are higher for site 1 compared with that found for site 2, which can be ascribed to the presence of water molecules coordinated to the Eu3+ placed in site 2, which favors the non-radiative transition probability through OH oscillators. We also note that the increase of Eu3+ concentration causes a decrease in the 5D0 lifetime values of site 1, suggesting the presence of concentration quenching effects. For site 2, the 5D0 lifetime values are almost independent of the Eu3+ concentration.
| x | Site 1 | Site 2 |
|---|---|---|
| 0.05 | 1.21 ± 0.07 | |
| 0.10 | 1.00 ± 0.10 | |
| 0.25 | 0.90 ± 0.03 | 0.40 ± 0.01 |
| 0.50 | 0.42 ± 0.01 | |
| 1.00 | 0.44 ± 0.01 |
The distinct 5D0 lifetime values of site 1 and site 2 were rationalized in terms of the calculation of the 5D0 radiative (Ar) and nonradiative (Anr) transition probabilities and of the 5D0 quantum efficiency (η) following a methodology described elsewhere.60 These calculations were performed for Pb0.95Eu0.05–BDC, site 1, and for [Eu2(BDC)3(H2O)4], site 2. We note that the very close η values (0.27 and 0.21, respectively), result from distinct contributions from Ar and Anr. Despite higher Ar values (0.479 ms−1) found for [Eu2(BDC)3(H2O)4] compared with that (0.224 ms−1) of Pb0.95Eu0.05–BDC, we note the increase of Anr for site 2 ([Eu2(BDC)3(H2O)4], 1.794 ms−1) relatively to that in site 1 (Pb0.95Eu0.05–BDC, 0.602 ms−1). The higher value of the Anr value for the [Eu2(BDC)3(H2O)4] can be ascribed to the presence of 4 water molecules in the coordination sphere which are known as very efficient quenchers from the 5D0 emission.60
The different 5D0 lifetime values of site 1 and site 2 allow the use of time-resolved spectroscopy to distinguish the Stark components that arise from each site, as illustrated for the most intense 5D0 → 7F2 transition. Fig. 9 shows the time-resolved emission excited at 315 nm acquired under distinct starting-delay (SD) values in the spectral regions of the 5D0 → 7F0,2 transitions. At shorter SD values (0.05 ms), the emission spectrum reveals two lines for the 5D0 → 7F0 transition region (already detected under steady-state mode, Fig. 5) ascribed to site 1 (578 nm) and site 2 (579 nm). At longer SD values (2.50 ms), only the long-lived 5D0 → 7F0 transition from site 1 remains, corroborating the longer 5D0 lifetime values listed in Table 1. At shorter SD values (0.05 ms) the 5D0 → 7F2 spectral region is dominated by the short-lived line at 616 nm ascribed to site 2, whereas for longer SD values (2.50 ms) the emission is governed by the long-lived Stark components at 612.0 nm (16![[thin space (1/6-em)]](https://www.rsc.org/images/entities/char_2009.gif) 340 ± 3 cm−1) and 621.0 nm (16
340 ± 3 cm−1) and 621.0 nm (16![[thin space (1/6-em)]](https://www.rsc.org/images/entities/char_2009.gif) 103 ± 3 cm−1) characteristic of site 1, Fig. 5B.
103 ± 3 cm−1) characteristic of site 1, Fig. 5B.
The emission properties of the CPs were further quantified by measuring the emission quantum yield as a function of the excitation wavelength, namely through the ligands excited states (280–370 nm) and via direct intra-4f6 excitation (5L6, 393 nm and 5D2, 465 nm), Fig. 10. The higher emission quantum yield was found for the Pb0.75Eu0.25–BDC, 69 ± 7%, under excitation at 315 nm, which is well above the values found for similar materials based on Pb(II).21,23 Analyzing the dependence of the emission quantum yield on the Eu3+ amount it is observed that the maximum values (independent of the excitation wavelengths) are found for x = 0.25 which may be ascribed to the simultaneous contribution of site 1 and site 2 for the radiative emission. Focusing our attention into the low-concentrated samples (site 1), it is observed that under the ligands-preferential excitation at 315 nm (Fig. 6), the emission quantum yield increases as x increases from 0.05 to 0.25 which may be attributed to the fact that as the amount of Eu3+ increases there is a larger number of ligands with Eu3+ ions in the neighborhoods, thus, the ligand-to-Eu3+ energy transfer is favored. Another interesting aspect is that when the intra-4f6 levels are excited (393 nm, 465 nm), the quantum yield is larger for the more concentrated samples, Pb1−xEux–BDC, x = 0.25, 0.50 and [Eu2(BDC)3(H2O)4], in good agreement with the preferential excitation of site 2 under direct intra-4f6 excitation.
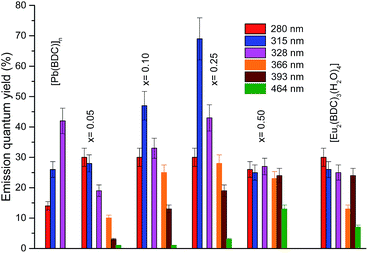 | ||
| Fig. 10 Dependence of the emission quantum yield on the excitation wavelengths for [Pb(BDC)]n, Pb1−xEux–BDC (x = 0.05, 0.10, 0.25, 0.50) and [Eu2(BDC)3(H2O)4]. | ||
The quantum yield values for Pb0.95Eu0.05(BDC) and [Eu2(BDC)3(H2O)4] are analogous the values found for the 5D0 quantum efficiency. It is known that the quantum efficiency η is the superior limit for q (q ≤ η)60 and that the overall absolute emission quantum yield q is the product of the sensitization efficiency of the ligand (ηtr) and η, q = ηtr × η.61 The similarity between q and η points out that an efficient ligand-to-Eu3+ energy transfer (ηtr ∼ 1) occurs for those CPs. This conclusion is in good agreement with the absence of LMCT bands in the excitation spectra (Fig. 6) which are known to play an important role in quenching the Eu3+ luminescence.57
Conclusions
We provide an intriguing example of a series of luminescent mixed-metal Pb1−xEux–BDC (x = 0.05, 0.10, 0.25, 0.50) CPs, including, for comparison purposes, the mononuclear [Pb(BDC)]n and [Eu2(BDC)3(H2O)4] phases. Increasing the amount of Eu3+, the mixed-metal CPs display a gradual change in their structure from the [Pb(BDC)]n phase to the [Eu2(BDC)3(H2O)4] one, well-monitored through luminescence spectroscopy. In fact, the discussion about the Eu3+-local coordination in the [Pb(BDC)]n phase is, as far as we know, performed for the first time here. The Pb0.75Eu0.25–BDC material display a mixture of both crystalline phases with a high emission quantum yield of 69 ± 7%, one the highest value measured for luminescent CPs based on Pb(II). Moreover, the Pb0.75Eu0.25–BDC CP is one of the rare examples in which two Eu3+ sites can be selectively excited through a common Xe lamp illustrating how powerful the Eu3+ luminescence is as a local probe spectroscopic tool.Acknowledgements
The authors gratefully acknowledge CNPq (RH-INCT/INAMI), DPP-UNB, FAP-DF, and CAPES for financial support. This work was partially developed in the scope of the project CICECO – Aveiro Institute of Materials (Ref. FCT UID/CTM/50011/2013), financed by Portuguese funds through the FCT/MEC and when applicable co-financed by FEDER under the PT2020 Partnership Agreement. LDC acknowledges CAPES and CNPq (Brazil) for a Pesquisador Visitante Especial grant (313778/2013-2) within the Science without Borders program.References
- J. Heine and K. Muller-Buschbaum, Chem. Soc. Rev., 2013, 42, 9232–9242 RSC.
- H. Furukawa, K. E. Cordova, M. O'Keeffe and O. M. Yaghi, Science, 2013, 341, 1230444 CrossRef PubMed.
- T. Wen, D.-X. Zhang, J. Liu, R. Lin and J. Zhang, Chem. Commun., 2013, 49, 5660–5662 RSC.
- G. Férey, New J. Chem., 2016, 40, 3950–3967 RSC.
- M. D. Allendorf, C. A. Bauer, R. K. Bhakta and R. J. T. Houk, Chem. Soc. Rev., 2009, 38, 1330–1352 RSC.
- J. Rocha, L. D. Carlos, F. A. A. Paz and D. Ananias, Chem. Soc. Rev., 2011, 40, 926–940 RSC.
- B. Zhao, X.-Y. Chen, P. Cheng, D.-Z. Liao, S.-P. Yan and Z.-H. Jiang, J. Am. Chem. Soc., 2004, 126, 15394–15395 CrossRef CAS PubMed.
- T. R. Cook, Y.-R. Zheng and P. J. Stang, Chem. Rev., 2012, 113, 734–777 CrossRef PubMed.
- H. Deng, C. J. Doonan, H. Furukawa, R. B. Ferreira, J. Towne, C. B. Knobler, B. Wang and O. M. Yaghi, Science, 2010, 327, 846–850 CrossRef CAS PubMed.
- A. D. Burrows, CrystEngComm, 2011, 13, 3623–3642 RSC.
- G. Férey, F. Millange, M. Morcrette, C. Serre, M. L. Doublet, J. M. Grenèche and J. M. Tarascon, Angew. Chem., Int. Ed. Engl., 2007, 46, 3259–3263 CrossRef PubMed.
- H.-L. Gao, B. Zhao, X.-Q. Zhao, Y. Song, P. Cheng, D.-Z. Liao and S.-P. Yan, Inorg. Chem., 2008, 47, 11057–11061 CrossRef CAS PubMed.
- W. Kleist, M. Maciejewski and A. Baiker, Thermochim. Acta, 2010, 499, 71–78 CrossRef CAS.
- V. Singh, A. Kumar, M. K. Yadav, L. B. Prasad and N. Singh, Synth. Met., 2013, 176, 65–69 CrossRef CAS.
- F. Gul-E-Noor, M. Mendt, D. Michel, A. Pöppl, H. Krautscheid, J. Haase and M. Bertmer, J. Phys. Chem. C, 2013, 117, 7703–7712 CAS.
- Y.-H. Zhao, H.-B. Xu, K.-Z. Shao, Y. Xing, Z.-M. Su and J.-F. Ma, Cryst. Growth Des., 2007, 7, 513–520 CAS.
- J. He, M. Zeller, A. D. Hunter and Z. Xu, J. Am. Chem. Soc., 2011, 134, 1553–1559 CrossRef PubMed.
- J. Chen, Q. Zhang, Z.-F. Liu, S.-H. Wang, Y. Xiao, R. Li, J.-G. Xu, Y.-P. Zhao, F.-K. Zheng and G.-C. Guo, Dalton Trans., 2015, 44, 10089–10096 RSC.
- L.-Q. Fan, L.-M. Wu and L. Chen, Inorg. Chem., 2006, 45, 3149–3151 CrossRef CAS PubMed.
- J.-D. Lin, S.-T. Wu, Z.-H. Li and S.-W. Du, CrystEngComm, 2010, 12, 4252–4262 RSC.
- W. W. Lestari, P. Lönnecke, H. C. Streit, M. Handke, C. Wickleder and E. Hey-Hawkins, Eur. J. Inorg. Chem., 2014, 1775–1782 CrossRef CAS.
- Y. Wang, Z. J. Zhang, W. Shi, P. Cheng, D. Z. Liao and S. P. Yan, CrystEngComm, 2010, 12, 1086–1089 RSC.
- M. Pan, C. Yan, L. Chen, L. Y. Zhang, S. Y. Yin, Y. X. Zhu, K. Wu, Y. J. Hou and C. Y. Su, New J. Chem., 2015, 39, 3770–3776 RSC.
- Y.-X. Tan, F.-Y. Meng, M.-C. Wu and M.-H. Zeng, J. Mol. Struct., 2009, 928, 176–181 CrossRef CAS.
- K.-F. Wu, F. Jiang, X.-L. Bai, S.-Y. Mo, G.-F. Qin and Y. Feng, J. Inorg. Organomet. Polym. Mater., 2015, 25, 879–885 CrossRef CAS.
- L. Zhang, Z.-J. Li, Q.-P. Lin, Y.-Y. Qin, J. Zhang, P.-X. Yin, J.-K. Cheng and Y.-G. Yao, Inorg. Chem., 2009, 48, 6517–6525 CrossRef CAS PubMed.
- Z.-P. Li, Y.-H. Xing, C.-G. Wang, J. Li, X.-Q. Zeng, M.-F. Ge and S.-Y. Niu, Z. Anorg. Allg. Chem., 2009, 635, 1650–1653 CrossRef CAS.
- T. M. Reineke, M. Eddaoudi, M. Fehr, D. Kelley and O. M. Yaghi, J. Am. Chem. Soc., 1999, 121, 1651–1657 CrossRef CAS.
- C. Daiguebonne, N. Kerbellec, O. Guillou, J.-C. Bünzli, F. Gumy, L. Catala, T. Mallah, N. Audebrand, Y. Gérault, K. Bernot and G. Calvez, Inorg. Chem., 2008, 47, 3700–3708 CrossRef CAS PubMed.
- J. W. Stouwdam, G. A. Hebbink, J. Huskens and F. C. J. M. van Veggel, Chem. Mater., 2003, 15, 4604–4616 CrossRef CAS.
- G. T. Xiang, J. H. Zhang, Z. D. Hao, X. Zhang, G. H. Pan, Y. S. Luo and H. F. Zhao, CrystEngComm, 2015, 17, 3103–3109 RSC.
- K. Devlin, B. Okelly, Z. R. Tang, C. Mcdonagh and J. F. Mcgilp, J. Non-Cryst. Solids, 1991, 135, 8–14 CrossRef CAS.
- S. J. L. Ribeiro, K. Dahmouche, C. A. Ribeiro, C. V. Santilli and S. H. Pulcinelli, J. Sol–Gel Sci. Technol., 1998, 13, 427–432 CrossRef CAS.
- D. Q. Chen, Y. Zhou, Z. Y. Wan, H. Yu, H. W. Lu, Z. G. Ji and P. Huang, Phys. Chem. Chem. Phys., 2015, 17, 7100–7103 RSC.
- S. Y. Qi, Y. L. Huang, Y. D. Li, P. Cai, S. I. Kim and H. J. Seo, J. Mater. Chem. B, 2014, 2, 6387–6396 RSC.
- H. M. Rietveld, J. Appl. Crystallogr., 1969, 2, 65–71 CrossRef CAS.
- A. C. Larson and R. B. Von Dreele, General Structure Analysis System (GSAS), Los Alamos National Laboratory, 2004 Search PubMed.
- M. Jarvinen, J. Appl. Crystallogr., 1993, 26, 525–531 CrossRef CAS.
- P. Thompson, D. E. Cox and J. B. Hastings, J. Appl. Crystallogr., 1987, 20, 79–83 CrossRef CAS.
- R. Young and P. Desai, Arch. Nauki Mater., 1989, 10, 71–90 Search PubMed.
- V. Sidey, J. Appl. Crystallogr., 2004, 37, 1013–1014 CrossRef CAS.
- R. Hill and C. Howard, J. Appl. Crystallogr., 1987, 20, 467–474 CrossRef CAS.
- T. Kottke and D. Stalke, J. Appl. Crystallogr., 1993, 26, 615–619 CrossRef.
- APEX2, Data Collection Software Version 2.1-RC13, Bruker AXS, Delft, The Netherlands, 2006 Search PubMed.
- Cryopad, Remote monitoring and control, Version 1.451, Oxford Cryosystems, Oxford, United Kingdom, 2006 Search PubMed.
- SAINT+, Data Integration Engine v. 8.27b©, Bruker AXS, Madison, Wisconsin, USA, 1997-2012 Search PubMed.
- G. M. Sheldrick, SADABS 2012/1, Bruker AXS Area Detector Scaling and Absorption Correction, Bruker AXS, Madison, Wisconsin, USA, 2012 Search PubMed.
- G. M. Sheldrick, SHELXT-2014, Program for Crystal Structure Solution, University of Göttingen, 2014 Search PubMed.
- G. M. Sheldrick, Acta Crystallogr., Sect. A: Found. Crystallogr., 2008, 64, 112–122 CrossRef CAS PubMed.
- C. B. Hübschle, G. M. Sheldrick and B. Dittrich, J. Appl. Crystallogr., 2011, 44, 1281–1284 CrossRef PubMed.
- K. Brandenburg, DIAMOND, Version 3.2f, Crystal Impact GbR, Bonn, Germany, 1997-2010 Search PubMed.
- E. Alexandrov, V. Blatov, A. Kochetkov and D. Proserpio, CrystEngComm, 2011, 13, 3947–3958 RSC.
- C. R. Groom, I. J. Bruno, M. P. Lightfoot and S. C. Ward, Acta Crystallogr., Sect. B: Struct. Sci., Cryst. Eng. Mater., 2016, 72, 171–179 CrossRef CAS PubMed.
- L. D. Carlos and A. L. L. Videira, Phys. Rev. B, 1994, 49, 11721–11728 CrossRef CAS.
- K. Binnemans, Coord. Chem. Rev., 2015, 295, 1–45 CrossRef CAS.
- Y. Hasegawa and T. Nakanishi, RSC Adv., 2015, 5, 338–353 RSC.
- S. V. Eliseeva, O. V. Kotova, F. Gumy, S. N. Semenov, V. G. Kessler, L. S. Lepnev, J. C. G. Bunzli and N. P. Kuzmina, J. Phys. Chem. A, 2008, 112, 3614–3626 CrossRef CAS PubMed.
- J. C. G. Bunzli and G. O. Pradervand, J. Chem. Phys., 1986, 85, 2489–2497 CrossRef.
- M. M. Fernandes, M. Schmidt, T. Stumpf, C. Walther, D. Bosbach, R. Klenze and T. Fanghanel, J. Colloid Interface Sci., 2008, 321, 323–331 CrossRef PubMed.
- L. D. Carlos, R. A. S. Ferreira, V. de Zea Bermudez and S. J. L. Ribeiro, Adv. Mater., 2009, 21, 509–534 CrossRef CAS PubMed.
- J.-C. G. Bünzli, Chem. Rev., 2010, 110, 2729–2755 CrossRef PubMed.
Footnote |
| † Electronic supplementary information (ESI) available: Crystallographic data, excitation spectrum and lifetime decay curves. CCDC 1490068. For ESI and crystallographic data in CIF or other electronic format see DOI: 10.1039/c6ra27850g |
| This journal is © The Royal Society of Chemistry 2017 |

