 Open Access Article
Creative Commons Attribution 3.0 Unported Licence
Synthesis of chiral R/S-pseudopeptide-based Cu(II) & Zn(II) complexes for use in targeted delivery for antitumor therapy: enantiomeric discrimination with CT-DNA and pBR322 DNA hydrolytic cleavage mechanism†
Sabiha Parveen,
Sartaj Tabassum and
Farukh Arjmand *
*
Department of Chemistry, Aligarh Muslim University, Aligarh 202002, India. E-mail: farukh_arjmand@yahoo.co.in; Tel: +91 5712703893
First published on 20th January 2017
Abstract
Chiral pseudopeptide Cu(II) and Zn(II) complexes (1S/R and 2S/R, respectively), were obtained by a de novo synthetic strategy employing pseudopeptide synthons derived from R/S-2-amino-2-phenylethanol and N-methyliminodiacetic acid. The complexes were thoroughly characterized by elemental analysis, mass spectrometry, and IR; the 2S/R complexes were further characterized by 1H, 13C NMR, whereas 1S/R complexes were studied by EPR spectroscopy. In vitro DNA binding studies were carried out by UV-Vis, fluorescence, thermal denaturation and circular dichroic techniques. The experimental results revealed that the complexes strongly bind to DNA via electrostatic interaction. The extent of binding was quantified by computing their intrinsic binding constant (Kb) and binding constant (K) values, which showed that the S-enantiomers of both complexes 1 and 2 exhibited higher binding propensities as compared to their R-enantiomeric analogs, and followed the trend 1S > 2S > 1R > 2R. Thermal denaturation studies of complexes in the absence and presence of CT-DNA have been carried out and the calculated ΔTm was found to be 1–3 °C, depicting the electrostatic mode of binding, which corroborated the results of the UV-Vis, fluorescence and other optical methods. The cleavage efficiencies of 1S and 2S with pBR322 DNA were evaluated by gel electrophoretic assay. S-Enantiomers of both Cu(II) and Zn(II) complexes were found to be efficient cleaving agents and cleavage reactions were mediated by hydrolytic pathways, which were further validated by relegation experiments using the T4 ligase enzyme. The cytotoxic activity of 1S and 2S showed pronounced GI50 values <10 μg mL−1 in the case of the HeLa cancer cell line, whereas for other cell lines, viz. MCF7, Hep-G2 and MIA-Pa-Ca-2, moderate activity was observed, which implicated the selective response of drug entities towards different cancer phenotypes.
Introduction
Cancer or malignant neoplasm is a complex class of diseases that are difficult to treat due to various phenotypes being derived from numerous organs/tissues with multiple etiologies and endless combinations of genetic and epigenetic alterations.1 It is said that we have entered “the age of cancer”, with 6.5 million cancer deaths in 2003, reaching 12 million in 2013, and predication of 22 million deaths by 2030, which may exponentially increase to 35 million by 2050.2 Although much innovation in drug design strategies has been carried out in the past decades and a large number of new chemical entities (NCEs) and screenable drug targets have been synthesized, only a few of them were found to be efficacious against various cancers.3 Over 40% of marketed drug candidates have been terminated because of the undesirable biological consequences of drug metabolism, toxicity and dose-limiting side effects. In light of the above, tremendous efforts have been made in the recent past toward the development of targeted chemotherapy. In “targeted” therapy, a drug is developed to target a specific cellular signalling pathway on which cancer cells depend for growth, metastasis, or angiogenesis.4 Targeted therapy focuses on the development of selective therapeutics, whereas classical therapy focuses on the development of increasingly cytotoxic compounds. Targeted chemotherapy thus holds the enormous potential to combat severe side effects and acquired resistance associated with classical chemotherapeutics.5The incorporation of chiral centers in either metal complexes or ligand scaffolds plays a critical role in the regulation of stereoselectivity at the target site and in the enhancement of the pharmacological behavior of metal complexes due to complementarity with chiral biotargets.6 As such, there is an increasing demand for enantiomeric pharmaceuticals that prove to be more efficacious and exhibit less systemic toxicity with high specificity.7 The chiral metal-based peptide scaffolds could also provide an excellent delivery system into the specific tumor target sites with better cellular uptake, reducing the high drug dosage and could be less toxic to normal tissues.8,9 Peptides contain many potential donor atoms for complexation with metal ions, and have been used for DNA selective recognition and/or as cleavage agents. Many cyclic peptides, pseudopeptides and peptidomimetics (non-peptide molecules) preserve the biological properties of peptides and could be considered as good drug candidates, owing to their (i) improved bioavailability, (ii) selective targeting, (iii) chemical optimization possibilities and (iv) increased pharmacokinetic profile.10
Copper containing metallo-drugs are of special significance because of their lower toxicity, endogenicity and good biocompatibility.11,12 Copper complexes have emerged as the best candidates in the search for metal complexes of biological importance and are regarded as the most promising alternatives to cisplatin.13,14 Synthetic Cu(II) complexes have been reported as potential anticancer agents because copper accumulates in tumors, due to the selective permeability of cancer cell membranes to copper compounds, and a number of copper complexes have been found to be active both in vitro and in vivo.15,16
Zn is the second most abundant trace metal in the human body after Fe; it plays a structural role in many proteins and enzymes and is preferred by hydrolytic enzymes, due to its redox inertness, low toxicity, hard Lewis acid properties and bioavailability.17,18 The efficient Zn(II) based hydrolytic cleavage agents could prove to be ideal pharmaceutical candidates at the cellular level. Zinc complexes form the most propitious forms of Zn-metalloelements for delivery to required cellular sites, enabling Zn-dependent enzyme syntheses and the facilitation of Zn-dependent biochemical processes.19
Results and discussion
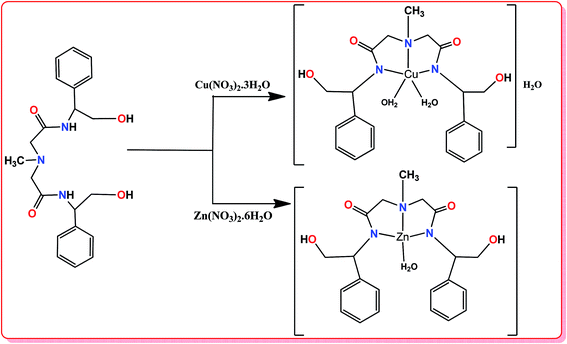
The (1S/R) and (2S/R) complexes were synthesized by reacting methanolic solutions of metal salts with ligands synthesized from R-2-amino-2-phenylethanol and N-methyliminodiacetic acid in a 1![[thin space (1/6-em)]](https://www.rsc.org/images/entities/char_2009.gif) :
:![[thin space (1/6-em)]](https://www.rsc.org/images/entities/char_2009.gif) 1 stoichiometric ratio as depicted in Scheme 1. The structure elucidation was done by elemental analysis and various spectroscopic techniques, viz. FT-IR, ESI-MS, EPR in the case of Cu(II) complexes, and electronic absorption methods.
1 stoichiometric ratio as depicted in Scheme 1. The structure elucidation was done by elemental analysis and various spectroscopic techniques, viz. FT-IR, ESI-MS, EPR in the case of Cu(II) complexes, and electronic absorption methods.
The complexes are stable towards air and moisture and are fairly soluble in methanol, DCM and DMSO. Molar conductance values of complexes in DMSO (10−3 M) at 25.0 °C indicate their non-electrolytic nature (15–25 Ω−1 cm2 mol−1).
The IR spectra of non-coordinated pseudopeptides exhibited a strong absorption band at 3269 cm−1, due to ν(N–H), which was absent in the complexes that ascertained coordination of ligand to metal ion through the deprotonation of the –NH group;20 intense amide bands were observed at 1626 cm−1. The ligands exhibited characteristic bands in the range of 3324–3328 cm−1, attributed to the –OH group of R-2-amino-2-phenylethanol, which retained their positions in the complexes, indicating that the –OH group was not involved in coordination with the metal ion. The bands at 758, 1043, 1160–1180 and 2926–2932 cm−1 were assigned to the –CH bending of the aromatic ring, C–O group, –CH2, and (C–H) stretching, respectively.21 In the far IR region, the presence of medium intensity bands around 456 and 530 cm−1 were attributed to (Cu/Zn–N) and (Cu/Zn–O), respectively.
The 1H and 13C NMR spectra of the ligand and (2S/R) complexes were obtained in DMSO-d6 solution and exhibited signatures in accordance with their proposed structures. The NH peptidic signature of the ligand at 8.2 ppm was absent in the spectra of the complexes, indicative of the coordination of the nitrogen atom to the metal via deprotonation of the NH peptide [Fig. S1 and S2†].22 The characteristic aromatic signatures were observed as multiplets at 7.1–7.4 ppm and the OH resonance of the ligand was observed at 5.34 in the complexes. The ligand and complexes exhibited signals for the proton attached to the chiral carbon at 3.75 ppm and signals at 3.58 and 1.26 ppm were attributed to –CH2 & –CH3 protons of N-methyliminodiacetic acid. In the 13C NMR spectra, prominent resonance peaks at 156 and 139 ppm were assigned to ![[double bond splayed left]](https://www.rsc.org/images/entities/char_e009.gif) C
C![[double bond, length as m-dash]](https://www.rsc.org/images/entities/char_e001.gif) O carbons of MIDA and (C–O) of R/S-2-amino-2-phenylethanol. The characteristic signatures of aromatic ring carbons appeared in the range of 126–139 ppm and signals found at 51.95, 47.50, 33.13 and 23.95 corresponded to (–CH2–NH), (–CH2OH), (–CH), and (–CH3), respectively.23
O carbons of MIDA and (C–O) of R/S-2-amino-2-phenylethanol. The characteristic signatures of aromatic ring carbons appeared in the range of 126–139 ppm and signals found at 51.95, 47.50, 33.13 and 23.95 corresponded to (–CH2–NH), (–CH2OH), (–CH), and (–CH3), respectively.23
The liquid state X-band EPR spectra of (1S/R) complexes were recorded in DMSO at both room temperature (RT) and liquid nitrogen temperature (LNT). The EPR spectra at RT revealed isotropic signals, whereas at LNT, they revealed anisotropic signals exhibiting well split signals for g1, g2 and g3 [Fig. S3†]. The observed anisotropy arises due to the presence of a gross distortion in the molecular geometry from the perfect Oh symmetry to five coordinate trigonal bipyramidal (tbp) or square pyramidal (sq. py) geometry around Cu2+ ion. The ground state energy levels for tbp and sq. py structures are dx2y2 and dz2, respectively.24 The magnitude of the rhombic distortion parameter (R), defined as (g2 − g1)/(g3 − g2), is helpful to ascertain the type, as well as the extent of distortion and the related ground energy state. The observed R > 1 reveals the sq. py geometry with dz2 ground energy state, whereas R < 1 is indicative of the dx2 − y2 energy state of the tbp geometry.25 The magnitudes of R for both (1S/R) complexes were found to be 0.64 and 0.69, respectively (i.e., R < 1), consistent with a five coordinate trigonal bipyramidal structure.
The effective magnetic moments of (1S/R) complexes with the d9 configuration were calculated at room temperature, using the equation μeff = 2.828 [χmT]1/2 and were found to be 2.01 and 2.03 BM, respectively (where χm is the molar susceptibility and T is the absolute temperature). The magnetic moment values for (1S/R) Cu(II) complexes were consistent with one unpaired electron in the trigonal bipyramidal geometry, whereas (2S/R) complexes with d10 configuration showed typical diamagnetism.26
The ESI-MS spectra were recorded in the positive ion mode for the ligands and (1S/R) and (2S/R) complexes in DMSO solution. The spectra of ligands L and L′ exhibited prominent peaks at m/z 403, corresponding to [C21H27N3O4 + H2O]+ [Fig. S4†]. ESI-MS spectra of the complexes showed molecular cation peaks at m/z 527 and 528, corresponding to 1S and 1R, respectively, whereas both 2S and 2R exhibited peaks at m/z 469. The (1S/R) and (2S/R) complexes exhibited prominent peaks at m/z 488, 441, 403 and 449, corresponding to the [C21H31CuN3O7 − 0.5H2O − 4H]+, [C21H31CuN3O7 − 3H2O − 5H]+ [L/L′ + H2O]+ and [C21H27N3ZnO5 − H2O]+ fragments, respectively.
In vitro DNA binding studies
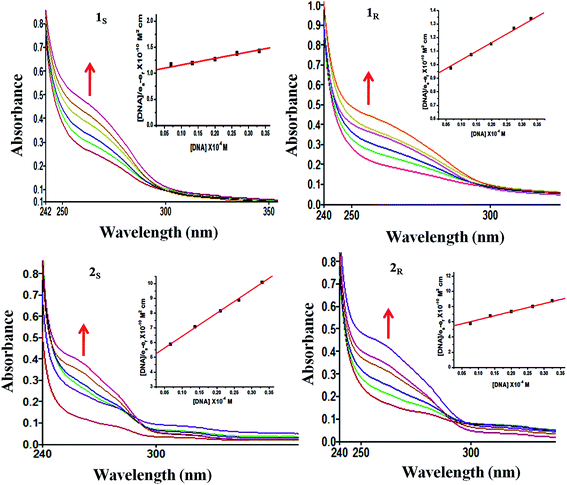
Electronic absorption spectroscopy has been used to examine metal complex–DNA interactions by monitoring the spectral changes. UV-Vis spectra of 1S/R complexes exhibited a broad band at ∼720 nm and a strong charge transfer (CT) band near 271 nm, suggestive of the Cu(II) ion in a five coordinate environment, whereas 2S/R complexes exhibited intense absorption bands with maxima at ∼270–280 nm, attributable to the n → π* transition of the N-methyliminodiacetic acid moiety, indicative of a tetrahedral environment around the Zn(II) ion. The absorption spectral technique is one of the most common ways to determine the intrinsic binding constants (Kb) of complexes, along with the mode of binding with CT-DNA by monitoring the absorption bands. On titrating S and R-enantiomeric analogues of complexes 1 and 2 (6.66 × 10⁻⁶ M) with aliquots of CT-DNA (0.00–3.33 × 10⁻⁵ M), ‘hyperchromism’ was observed with no significant shift in absorption intensities [Fig. 1]. The ‘hyperchromic’ effect is usually associated with non-covalent interactions via the electrostatic binding mode typical of cationic complexes, and is also associated with the breakage of hydrogen bonds that stabilize the secondary structure of the DNA double helix,27 whereas ‘‘hypochromism” is attributed to the intercalative binding of complexes to the DNA helix, due to strong stacking interactions.28 In order to further elucidate the quantitative binding strength of (1S/R) and (2S/R) complexes with CT-DNA, intrinsic binding constant, Kb values were determined by using the Wolfe–Shimer equation. The Kb values were found to be 6.47 × 10⁴, 3.27 × 10⁴, 4.64 × 10⁴ and 1.91 × 10⁴ M−1 respectively, and followed the trend 1S > 2S > 1R > 2R, indicating that S-enantiomers 1S and 2S possess higher propensities for DNA binding in comparison to R-enantiomers because the right-handed chiral B-form of the DNA helix displays conformational compatibility (the TPCP-two pole complementarity principle) to the S-enantiomers of the complexes, thereby underlining preferential enantiomeric discrimination. This also encompasses such chiral metal complexes being used as structural probes to validate DNA conformations.29Fluorescence studies
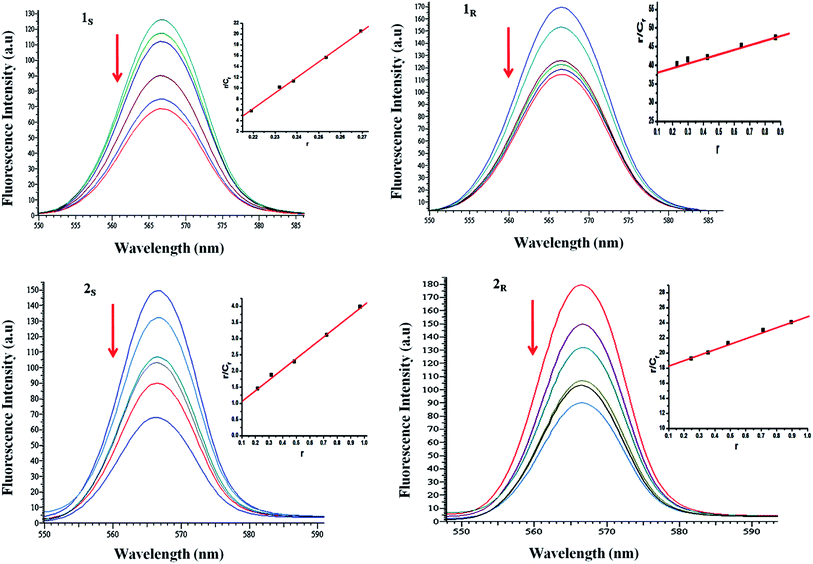
Further insight on the interaction mode of (1S/R) and (2S/R) complexes with CT-DNA was substantiated by the fluorescence studies. The emission titrations were carried out in 0.01 tris–HCl/50 mM NaCl buffer at ambient temperature, excited at 270 nm. In the absence of CT-DNA, (1S/R) and (2S/R) complexes displayed intense luminescence with fluorescence maxima centered at ∼565 nm. The concomitant addition of CT-DNA to fixed concentrations of complexes resulted in a gradual enhancement in the fluorescence emission intensity without apparent changes in the position and shape of the emission bands, which revealed the strong interactions of metal complexes with DNA [Fig. 2]. The observed enhancement in intensity could be attributed to decreased vibrational modes of relaxation resulting from restricted complex mobility at the binding site due to the inability of the solvent molecules to reach the hydrophobic environment inside the DNA helix.30 Hydrophobic interactions could induce changes in the excited state properties either due to electrostatic association or intercalation.31Binding constants K of the metal complexes were also determined from Scatchard eqn (1) and (2) by employing emission titration:
| Cf = CT(I/I0 − P)(1 − P) | (1) |
| r/Cf = K(n − r) | (2) |
The binding constant (K) values of the 1S/R and 2S/R complexes calculated from the plots of r/Cf versus r were found to be 5.26 × 10⁴, 1.57 × 10⁴, 2.39 × 10⁴ and 1.317 × 10⁴ M−1, respectively, and followed the order 1S > 2S > 1R > 2R. Furthermore, the Kb values are indicative of the enantioselective approach of the complexes, emphasizing the stronger binding affinity of the S-enantiomers for DNA as compared to R-enantiomers.
Circular dichroism (CD)
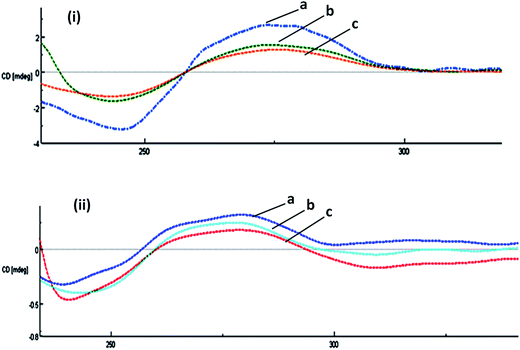
CD spectra in the UV range are sensitive to the conformational changes of the helix during drug–DNA interactions and provide a rationale for preferential binding modes of the enantiomers with inherently chiral DNA. The observed CD spectrum of unbound CT-DNA is characterized by a positive band at 275 nm and a negative band near 240 nm. These two bands are the outcome of exciton coupling interactions of the bases, which depend on the skewed orientation on the DNA backbone.32 On addition of (1S/R) and (2S/R) complexes to CT-DNA, the CD spectra exhibited changes in positive and negative (ellipticity and helicity) bands [Fig. 3]. The 1S and 2S complexes displayed an increase in intensities of both positive and negative bands due to the enantio-preferential selectivity of the S-enantiomeric form. On the other hand, the R-enantiomeric form of complexes 1R and 2R presented inverse CD spectra exhibiting a decrease in intensities of both positive and negative bands as compared to unbound CT–DNA. Both the enantiomers of complexes 1 and 2 displayed opposite spectral changes on binding to CT-DNA, which could be attributed to the selective response of conformations of enantiomers towards DNA.Thermal denaturation
Thermal denaturation is a sensitive method for detecting small conformational changes and interaction strength of the complexes with DNA.33 To get clear insight into the DNA binding mode of the synthesized complexes, thermal denaturation studies were performed in the presence and absence of the complexes. On gradual heating, the DNA helix gradually dissociates to single strands, and exhibits a hyperchromic effect on the absorption spectra of DNA base pairs at the wavelength of 260 nm. The melting transition curve of DNA alone gives a sharp ‘sigmoid’ curve. The decrease in the melting temperature (Tm) leads to destabilization of the DNA helix, indicating the presence of electrostatic interactions, while an increase in Tm manifests stabilizing interactions (often intercalative or phosphate binding) due to the stabilization of the DNA duplex through pi–pi stacking.34 The ΔTm value of DNA with S-enantiomers (1S, 2S) showed a shift of ∼2 °C, whereas R-enantiomers (1R, 2R) revealed a shift of ∼3 °C, depicting the electrostatic mode of binding or groove binding, while ruling out the possibility of the intercalative binding mode, hence corroborating well with the results obtained by various spectroscopic studies [Fig. 4].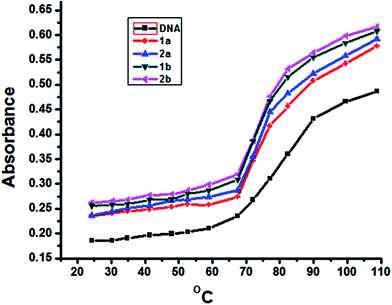 | ||
| Fig. 4 Thermal denaturation profiles of CT-DNA before and after the addition of (1S/R) and (2S/R) complexes. | ||
Cleavage activity with pBR322 DNA
Since L-enantiomeric complexes 1S and 2S exhibited higher DNA binding affinities, their cleavage activity was assessed by agarose gel electrophoresis using supercoiled pBR322 plasmid DNA as a substrate in a medium of 5 mM tris–HCl/50 mM NaCl buffer, at pH = 7.2. The cleavage activity of Cu(II) and Zn(II) complexes in mediating DNA cleavage has been well documented, owing to the fact that these complexes exhibit their own selectivity for a cleavage mechanism.35,36 The cleavage activities of complexes 1S and 2S were assessed by the conversion of DNA Form I (supercoiled form) to Form II (nicked circular form). The concentration dependent cleavage patterns of 1S and 2S are shown in Fig. 5a and 6a. Upon increasing the concentration of complexes from 5–50 μM, Form I converted into Form II. At the concentration of 35 μM of complex 1S and 2S, respectively, Form I got converted to Form II; no formation of Form III (linear form) was observed, suggestive of single strand DNA scission (lane 8 for both the complexes).37Furthermore, the mechanistic pathway for the cleavage reaction of pBR322 plasmid DNA by complexes 1S and 2S (35 μM) was investigated in the presence of additives such as DMSO and EtOH (hydroxyl radical scavengers), NaN3 (singlet oxygen scavengers 1O2) and SOD (superoxide anion radical, O2˙−). For both the complexes, DMSO (lane 2) and EtOH (lane 3) exhibited degradation and significant inhibition of DNA, indicative of the involvement of the diffusible hydroxyl radical as one of the reactive species involved in the cleavage process [Fig. 5b and 6b]. These OH˙ free radicals participate in the oxidation of the deoxyribose moiety, followed by hydrolytic cleavage of the sugar phosphate backbone. On the other hand, upon addition of SOD and NaN3 (lanes 4, 5), no obvious inhibition was observed for both the complexes.
The cleavage activity of complexes was also evaluated in the presence of activators, viz. H2O2, ascorbate (Asc) and 3-mercaptopropionic acid (MPA). The results revealed that the cleavage activity of the complexes was significantly enhanced in the presence of these activators and followed the order H2O2 ≫ MPA > Asc for complexes 1S and 2S, respectively. The complexes in the presence of H2O2 exhibited significant DNA cleavage activity, followed by complete degradation of DNA.
The groove binding preferences of complexes 1S and 2S were tested in the presence of minor groove binder, DAPI, and major groove binder, methyl green, (MG). As shown in Fig. 5b and 6b, the minor groove binder, DAPI, exhibited significant inhibition of the DNA damage mediated by both the complexes (lane 10), indicative of the fact that both the complexes interact through the minor groove of the DNA helix.
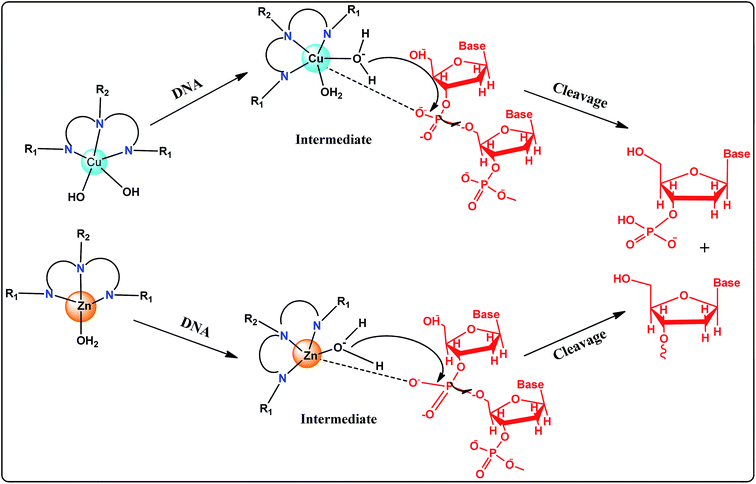
The cleavage patterns illustrate that complexes 1S and 2S follow similar mechanisms in the cleavage process, in which hydroxyl radicals participate in the oxidation of the deoxyribose moiety, followed by hydrolytic cleavage of the sugar phosphate backbone, and are responsible for cleavage reactions [Scheme 2]. The complex promotes the direct coordination between metal cations acting as Lewis acids and the negatively charged oxygen in the phosphodiester backbone of DNA. The newly formed metal–oxygen bond undergoes electrostatic interactions that enhance the electrophilicity of the phosphorus, so the phosphorus becomes active enough to be the target of nucleophilic attack. The possible nucleophilic species in the complex–DNA system is the coordinated water linked to the metal cation. The aquo-hydroxo form of the complex is formed on the removal of a proton from one of the metal coordinated water molecules in the complex. The activated phosphorus atom can then be attacked by the active nucleophilic species, resulting in the formation of a pentacoordinated intermediate. Finally, one of the P–O ester bonds of the phosphodiester in the DNA backbone is broken by the intramolecular charge delivery, resulting in the DNA cleavage.38 The direct evidence of hydrolytic cleavage of DNA was ascertained by T4 DNA ligase enzymatic assay, where the nicked DNA fragments (Form II) cleaved by the complex are re-ligated to a large extent in the presence of T4 DNA ligase enzyme.
T4 DNA ligase assay
The 1S and 2S complexes demonstrated efficient hydrolytic cleavage activity, which was further supported by DNA re-ligation assay. It is well known that in hydrolytic cleavage, 3′-OH and 5′-OPO3 (5′-OH and 3′-OPO3) fragments of DNA remain intact and that these fragments can be enzymatically ligated by using T4 DNA ligase enzyme.39 The complexes yielded linearised DNA, which was re-ligated by T4 DNA ligase enzyme. As shown in Fig. 7, DNA re-ligation was complete and after ligation there was complete repair, which was quantitatively ascertained by comparison of complex treated DNA with the control DNA alone in SC form (Form I), providing direct evidence in favour of the hydrolytic mechanism. Therefore, complexes 1S and 2S could serve as a rational basis for the possible design of targeted anticancer drugs.In vitro cytotoxic activity
The cytotoxic activity of S-enantiomers 1S and 2S was evaluated on a panel of human cancer cell lines, viz. HeLa, MCF7, Hep-G2, MIA-Pa-Ca-2 by SRB assay, in terms of GI50 (concentration of drug that produces 50% inhibition of the cells), TGI (concentration of the drug that produces total inhibition of the cells) and LC50 (concentration of the drug that kills 50% of the cells) values. The observed results revealed that both complexes 1S and 2S were selective for the HeLa cervical cancer cell line with GI50 values <10 μg mL−1, while for other cell lines, moderate activity was observed (25–50 μg mL−1), and 1S was found to exhibit better cytotoxicity than 2S, which corroborated well with the findings of DNA binding studies [Fig. 8]. The cytotoxicity studies and pBR322 plasmid cleavage revealed the potential of these pseudopeptides to act as delivery agents for specific targeted chemotherapeutic intervention.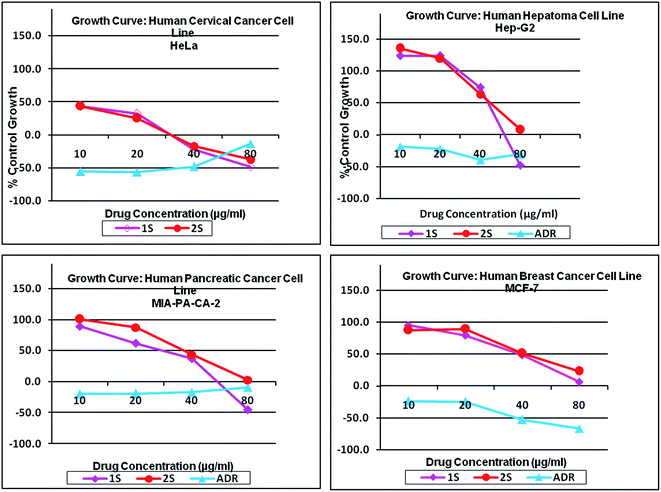 | ||
| Fig. 8 Growth curves showing % control growth vs. drug concentration (μg mL−1) against different human carcinoma cell lines: HeLa (cervix), MCF7 (breast), MIA-Pa-Ca-2 (pancreas), Hep-G2 (hepatoma). | ||
Molecular docking studies
Molecular docking studies provide vital information regarding the favourable binding modes of drug entities by offering the visual representation of the binding of small molecules to DNA. The favourable energy minimized docked poses of complexes 1S and 2S carried out with B-DNA (PDB ID: 1BNA) revealed that they interact adjacent to the GC-rich sequence of the minor groove and were in close proximity to C-21, G-22, C-24, G-24, A-5, A-6, G-4 and C-3 DNA base pairs [Fig. 9]. The complexes adopted characteristic shapes and were found to be flexible enough to adopt conformations that were complementary to the minor groove. The resulting relative binding energies of docked structures of complexes 1S and 2S were found to be −280.37 and −253.32 kcal mol−1, respectively, which also revealed that 1S exhibited higher binding affinity and is more promising than 2S to act as an efficacious chemotherapeutic agent.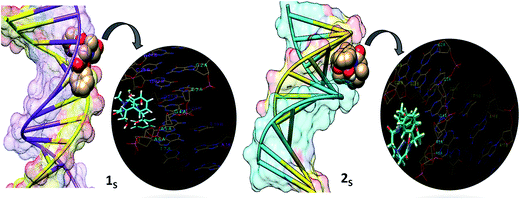 | ||
| Fig. 9 Molecular docked model of complexes 1S and 2S fitted into the G–C region of the minor groove of the DNA dodecamer duplex of sequence d(CGCGAATTCGCG)2, PDB ID: 1BNA. | ||
Conclusion
New S- and R-enantiomeric complexes 1S/R and 2S/R obtained from pseudopeptide synthons of R/S-2-amino2-phenylethanol and N-methyliminodiacetic acid were designed and synthesized to ascertain the structure-activity relationship of these complexes towards CT-DNA. In vitro DNA binding studies of S and R-enantiomers of ligands (L and L′) and 1S/R and 2S/R complexes were carried out by UV-Vis, fluorescence and circular dichroism to validate their potential to act as antitumor chemotherapeutic agents. The binding profiles of these pseudopeptidic complexes revealed that the S-enantiomer of complex 1S/R exhibited the highest DNA binding propensity and cleavage activity, possessing distinct chiral preference over its R-enantiomer, and satisfactorily fulfilled the criteria for the design of antitumor drug candidates. The cleavage reactions of 1S and 2S complexes were found to be mediated by the hydrolytic pathway involving the OH˙ radical, and further, we validated the hydrolytic cleavage by re-ligation experiments using T4 ligase enzyme. The cytotoxic activities of complexes 1S and 2S were studied against four human cancer cell lines; HeLa, MCF7, Hep-G2, MIA-Pa-Ca-2 by employing the SRB assay. It was observed that both 1S and 2S exhibited selective cytotoxic activity against HeLa with considerable regression (GI50 values <10 μg mL−1), while for MCF7, Hep-G2, MIA-Pa-Ca-2 moderate activity was observed, indicating that complexes 1S and 2S can be utilized for antitumor chemotherapeutic intervention, particularly in the case of cervical cancers.Experimental section
Reagents and materials
R/S-2-Amino-2-phenylethanol, N-methyliminodiacetic acid (Sigma), 2-(1H-benzotriazol-1-yl)-1,1,3,3-tetramethyluroniumhexafluorophosphate (HBTU), tris(hydroxymethyl)aminomethane (Sigma) were used as received. Disodium salt of calf thymus DNA (CT-DNA) was purchased from Sigma Chemical Co. and was stored at 4 °C. Agarose, ascorbic acid (Sigma), 6× loading dye (Fermental Life Science) and supercoiled plasmid DNA pBR322 (Genei) were utilized as received. All reagents were of the best commercial grade and were used without further purification.Methods and instrumentation
Elemental analyses (C, H and N) were performed on an Elementar Vario EL III. Fourier-transform infrared (FTIR) spectra were recorded on an Interspec2020 FTIR spectrometer in KBr pellets from 400–4000 cm−1. Electronic spectra were recorded on a UV-Vis spectrophotometer Lambda 20 (Perkin Elmer); data were reported in λmax (nm). The EPR spectra of Cu(II) complexes were acquired on a JES-FA200 ESR spectrometer using X-band frequency (9.1 GHz) at room temperature and liquid nitrogen temperature in the solid state under the magnetic field strength of 3000 G. The 1H and 13C NMR spectra were obtained on a Bruker DRX-400 spectrometer. ESI-MS spectra were recorded on a Micromass Quattro II triple quadrupole mass spectrometer. Circular dichroism (CD) spectra were recorded on a Jasco J-815CD spectrometer operating at room temperature at 25 °C. The wavelength region between 200 and 700 nm was scanned for each sample using a 1 cm path quartz cell. Cleavage experiments were performed with the help of Axygen electrophoresis supported by a Genei power supply with a potential range of 50–500 V, visualized and photographed by Vilber-INFINITY gel documentation system. The thermal denaturation experiments were carried out by monitoring the absorbance of CT-DNA (1 × 10⁻⁴ M) at 260 nm with varying temperatures in the absence and presence of (1S/R) and (2S/R) complexes in a 1![[thin space (1/6-em)]](https://www.rsc.org/images/entities/char_2009.gif) :
:![[thin space (1/6-em)]](https://www.rsc.org/images/entities/char_2009.gif) 2 ratio of complex to DNA; the samples were gradually heated at the rate of 1 °C min−1 in tris buffer (pH 7.2) using a Peltier system attached to the UV-Vis spectrophotometer.
2 ratio of complex to DNA; the samples were gradually heated at the rate of 1 °C min−1 in tris buffer (pH 7.2) using a Peltier system attached to the UV-Vis spectrophotometer.
In vitro DNA binding studies
DNA binding experiments, including absorption spectral traces, emission spectroscopy and circular dichroism, conformed to the standard methods and practices previously adopted by our laboratory,40,41 whereas DNA cleavage was performed by the standard protocol as described previously.42 While measuring the absorption spectra, an equal amount of DNA was added to both the compound solutions and the reference solution to eliminate the absorbance of the CT-DNA itself, and tris–HCl buffer was subtracted through base line correction. All the experiments involving interaction of the complexes with CT-DNA were performed in double distilled buffer containing tris(hydroxymethyl)aminomethane and adjusted to pH 7.3 with hydrochloric acid. A solution of CT-DNA in buffer gave a ratio of UV absorbance at 260 and 280 nm of ca. 1.9![[thin space (1/6-em)]](https://www.rsc.org/images/entities/char_2009.gif) :
:![[thin space (1/6-em)]](https://www.rsc.org/images/entities/char_2009.gif) 1, indicating that DNA was sufficiently free of protein. The DNA concentration per nucleotide was determined by absorption spectroscopy, with the molar absorption coefficient of 6600 M−1 cm−1 at 260 nm.
1, indicating that DNA was sufficiently free of protein. The DNA concentration per nucleotide was determined by absorption spectroscopy, with the molar absorption coefficient of 6600 M−1 cm−1 at 260 nm.
In vitro cytotoxic activity
The in vitro antitumor screening of 1S and 2S was carried out on the human cervical cancer line (HeLa). G-Adriamycin, a standard anticancer drug, was taken as the control. Human malignant cell lines were procured and grown in RPMI-1640 medium supplemented with 10% Fetal Bovine Serum (FBS) and antibiotics to study the growth patterns of these cells. The proliferation of the cells upon treatment with chemotherapy was determined by means of the sulphorhodamine-B (SRB) semi-automated assay. Cells were seeded in 96 well plates at an appropriate cell density to give optical density in the linear range (from 0.5 to 1.8) and were incubated at 37 °C in a CO2 incubator for 24 h. The stock solution of the complexes were prepared as 100 mg mL−1 in DMSO and four dilutions (i.e. 10 μg mL−1, 20 μg mL−1, 40 μg mL−1, 80 μg mL−1) were tested in triplicate, each well receiving 90 μL of cell suspension. The plates were properly labelled and were incubated for 48 h. Termination of the experiment was done by gently layering the cells with 50 μL of chilled 30% TCA (in the case of adherent cells) and 50% TCA (in the case of suspension cell lines) for cell fixation and keeping them at 4 °C for 1 h. Plates were stained with 50 μL of 0.4% SRB for 20 min. All experiments were repeated three times.Molecular docking studies
Molecular docking studies were performed using HEX 8.0 software,43 which is an interactive molecular graphics program for calculating and displaying feasible docking modes of an enzyme and a DNA molecule. The structures of complexes were converted into PDB format from mol format by OPENBABEL (http://www.vcclab.org/lab/babel/). The crystal structure of the B-DNA dodecamer d(CGCGAATTCGCG)2 (PDB ID: 1BNA) was downloaded from the protein data bank (http://www.rcsb.org./pdb). Visualization of the docked poses was done using CHIMERA (http://www.cgl.ucsf.edu/chimera), a molecular graphics program.Syntheses
Yield, 70% mp 190 °C; FT-IR (KBr, ν, cm−1): 3327 ν(–OH), 3269 ν(–NH), 2930 ν(C–H); 1626 ν(C![[double bond, length as m-dash]](https://www.rsc.org/images/entities/char_e001.gif) O); 1578 δ(N–H) + ν(C–N); 1152 ν(CH2); 757 ν(Ar). 1H NMR δH (400 MHz; DMSO-d6 ppm): 8.2 (–NH), 7.21–7.34 (5H, Ar H), 5.34 (–OH), 3.75 (–CH, 1H), 3.58 (–CH2, 2H), 2.52 (–CH2), 1.26 (–CH3, 3H); 13C NMR (100 MHz, DMSO-d6 ppm): 156.74 (C
O); 1578 δ(N–H) + ν(C–N); 1152 ν(CH2); 757 ν(Ar). 1H NMR δH (400 MHz; DMSO-d6 ppm): 8.2 (–NH), 7.21–7.34 (5H, Ar H), 5.34 (–OH), 3.75 (–CH, 1H), 3.58 (–CH2, 2H), 2.52 (–CH2), 1.26 (–CH3, 3H); 13C NMR (100 MHz, DMSO-d6 ppm): 156.74 (C![[double bond, length as m-dash]](https://www.rsc.org/images/entities/char_e001.gif) O), 139 (C–O), 126.59–128.13 (Ar C), 51.95 (–CH2–NH), 47.50 (–CH2OH), 33.13 (–CH), 23.95 (–CH3); ESI-MS (m/z): 403 [C21H27N3O4 + H2O]+.
O), 139 (C–O), 126.59–128.13 (Ar C), 51.95 (–CH2–NH), 47.50 (–CH2OH), 33.13 (–CH), 23.95 (–CH3); ESI-MS (m/z): 403 [C21H27N3O4 + H2O]+.
1S. Yield, 75% mp 260 °C, FT-IR (KBr, ν, cm−1): 3324 ν(–OH), 2931 ν(C–H); 1624 ν(C
![[double bond, length as m-dash]](https://www.rsc.org/images/entities/char_e001.gif) O); 1580 δ(N–H) + ν(C–N); 1152 ν(CH2); 760 ν(Ar). Molar conductance, ΛM (10−3 M, DMSO): 15.0 Ω−1 cm2 mol−1 (non-electrolyte). ESI-MS (m/z): 497 [C21H31CuN3O7 − 3H]+.
O); 1580 δ(N–H) + ν(C–N); 1152 ν(CH2); 760 ν(Ar). Molar conductance, ΛM (10−3 M, DMSO): 15.0 Ω−1 cm2 mol−1 (non-electrolyte). ESI-MS (m/z): 497 [C21H31CuN3O7 − 3H]+.
1R. Yield, 74% mp 262 °C, FT-IR (KBr, ν, cm−1): 3324 ν(–OH), 2931 ν(C–H); 1624 ν(C
![[double bond, length as m-dash]](https://www.rsc.org/images/entities/char_e001.gif) O); 1580 δ(N–H)+ν(C–N); 1152 ν(CH2); 760 ν(Ar). Molar conductance, ΛM (10−3 M, DMSO): 18.0 Ω−1 cm2 mol−1 (non-electrolyte). ESI-MS (m/z): 497 [C21H31CuN3O7 − 3H]+.
O); 1580 δ(N–H)+ν(C–N); 1152 ν(CH2); 760 ν(Ar). Molar conductance, ΛM (10−3 M, DMSO): 18.0 Ω−1 cm2 mol−1 (non-electrolyte). ESI-MS (m/z): 497 [C21H31CuN3O7 − 3H]+.
2S. Yield, 73% mp 240 °C; FT-IR data (KBr, ν, cm−1): 3328 ν(–OH), 2929 ν(C–H); 1628 ν(C
![[double bond, length as m-dash]](https://www.rsc.org/images/entities/char_e001.gif) O); 1576 δ(N–H) + ν(C–N); 1156 ν(CH2); 760 ν(Ar). 1H NMR δH (400 MHz; DMSO-d6 ppm): 7.21–7.46 (5H, Ar H), 5.32 (–OH), 3.52 (–CH2, 2H), 3.45 (–CH2, 2H), 2.52 (–CH), 1.27 (–CH3, 3H); 13C NMR (100 MHz, DMSO-d6 ppm): 156.73 (C
O); 1576 δ(N–H) + ν(C–N); 1156 ν(CH2); 760 ν(Ar). 1H NMR δH (400 MHz; DMSO-d6 ppm): 7.21–7.46 (5H, Ar H), 5.32 (–OH), 3.52 (–CH2, 2H), 3.45 (–CH2, 2H), 2.52 (–CH), 1.27 (–CH3, 3H); 13C NMR (100 MHz, DMSO-d6 ppm): 156.73 (C![[double bond, length as m-dash]](https://www.rsc.org/images/entities/char_e001.gif) O), 126.21–128.78 (ArC), 51.94 (–CH2OH), 47.51 (–CH2OH), 33.33 (–CH), 24.47 (–CH3). Molar conductance, ΛM (10−3 M, DMSO): 23.0 Ω−1 cm2 mol−1 (non-electrolyte). ESI-MS (m/z): 469 [C21H27N3ZnO5 + 2H]+.
O), 126.21–128.78 (ArC), 51.94 (–CH2OH), 47.51 (–CH2OH), 33.33 (–CH), 24.47 (–CH3). Molar conductance, ΛM (10−3 M, DMSO): 23.0 Ω−1 cm2 mol−1 (non-electrolyte). ESI-MS (m/z): 469 [C21H27N3ZnO5 + 2H]+.
2R. Yield, 74% mp 242 °C; FT-IR (KBr, ν, cm−1): 3327 ν(–OH), 2930 ν(C–H); 1627 ν(C
![[double bond, length as m-dash]](https://www.rsc.org/images/entities/char_e001.gif) O); 1577 δ(N–H) + ν(C–N); 1157 ν(CH2); 761 ν(Ar). 1H NMR δH (400 MHz; DMSO-d6 ppm): 7.21–7.42 (5H, Ar H), 5.32 (–OH), 3.52 (–CH2, 2H), 3.45 (–CH2, 2H), 2.53 (–CH), 1.29 (–CH3, 3H); 13C NMR (100 MHz, DMSO-d6 ppm): 156.82 (C
O); 1577 δ(N–H) + ν(C–N); 1157 ν(CH2); 761 ν(Ar). 1H NMR δH (400 MHz; DMSO-d6 ppm): 7.21–7.42 (5H, Ar H), 5.32 (–OH), 3.52 (–CH2, 2H), 3.45 (–CH2, 2H), 2.53 (–CH), 1.29 (–CH3, 3H); 13C NMR (100 MHz, DMSO-d6 ppm): 156.82 (C![[double bond, length as m-dash]](https://www.rsc.org/images/entities/char_e001.gif) O), 126.11–128.31 (Ar C), 51.98 (–CH2OH), 47.53 (–CH2OH), 33.35 (–CH), 24.47 (–CH3). Molar conductance, ΛM (10−3 M, DMSO): 25.0 Ω−1 cm2 mol−1 (non-electrolyte). ESI-MS (m/z): 469 [C21H27N3ZnO5 + 2H]+.
O), 126.11–128.31 (Ar C), 51.98 (–CH2OH), 47.53 (–CH2OH), 33.35 (–CH), 24.47 (–CH3). Molar conductance, ΛM (10−3 M, DMSO): 25.0 Ω−1 cm2 mol−1 (non-electrolyte). ESI-MS (m/z): 469 [C21H27N3ZnO5 + 2H]+.
Abbreviations
| DCC | N,N′-Dicyclohexylcarbodiimide |
| CD | Circular dichroism |
| CT-DNA | Calf thymus DNA |
Acknowledgements
The authors are grateful to SAIF Panjab University, Chandigarh, STIC Cochin University, Cochin for providing ESI-MS, NMR, elemental analysis facility, respectively. The author (S. Parveen) is thankful to University Grants Commission (UGC), New Delhi, for providing BSR Fellowship and the Department of Chemistry, AMU through UGC assisted DRS–SAP and DST PURSE Programme. The authors express their sincere gratitude for ‘In vitro SRB assay for anti-cancer activity evaluation of drugs, carried out at Anti-Cancer Drug screening facility (ACDSF) at ACTREC, Tata Memorial Centre, Navi Mumbai’.References
- H. Brody, Nature, 2011, 471, S1 CrossRef CAS PubMed.
- G. Jaouen, A. Vessières and S. Top, Chem. Soc. Rev., 2015, 44, 8802–8817 RSC.
- N. J. Wheate, S. Walker, G. E. Craig and R. Oun, Dalton Trans., 2010, 39, 8113–8127 RSC.
- W. H. Ang and P. J. Dyson, Eur. J. Inorg. Chem., 2006, 4003–4018 CrossRef CAS.
- A. G. Weidmann, A. C. Komor and J. K. Barton, Comments Inorg. Chem., 2014, 34, 114–123 CrossRef CAS PubMed.
- F. Arjmand, A. Jamsheera, M. Afzal and S. Tabassum, Chirality, 2012, 24, 977–986 CrossRef CAS PubMed.
- Mudasir, N. Yoshioka and H. Inoue, J. Inorg. Biochem., 2008, 102, 1638–1643 CrossRef CAS PubMed.
- F. Huber and R. Barbieri, in Metal Complexes in Cancer Chemotherapy, ed. B. K. Keppler, VCH, Weinheim, 1993, pp. 353–368 Search PubMed.
- V. Marx, Chem. Eng. News, 2005, 83, 17–24 Search PubMed.
- F. Arjmand, S. Parveen and D. K. Mohapatra, Inorg. Chim. Acta, 2012, 388, 1–10 CrossRef CAS.
- W. Kaim and J. Rall, Angew. Chem., Int. Ed. Engl., 1996, 35, 43–60 CrossRef CAS.
- D. Denoyer, S. Masaldan, S. La Fontaine and M. A. Cater, Metallomics, 2015, 7, 1459–1476 RSC.
- M. Muralisankar, N. S. P. Bhuvanesh and A. Sreekanth, New J. Chem., 2016, 40, 2661–2679 RSC.
- A. T. Chaviara, P. C. Christidis, A. Papageorgiou, E. Chrysogelou, D. J. Hadjipavlou-Litina and C. A. Bolos, J. Inorg. Biochem., 2005, 99, 2102–2109 CrossRef CAS PubMed.
- C. Fernandes, G. L. Parrilha, J. A. Lessa, L. J. M. Santiago, M. M. Kanashiro, F. S. Boniolo, A. J. Bortoluzzi, N. V. Vugman, M. H. Herbst and A. Horn Jr, Inorg. Chim. Acta, 2006, 359, 3167–3176 CrossRef CAS.
- M. Alagesan, N. S. P. Bhuvanesh and N. Dharmaraj, Dalton Trans., 2013, 42, 7210–7223 RSC.
- G. K. Walkup, S. C. Burdette, S. J. Lippard and R. Y. Tsien, J. Am. Chem. Soc., 2000, 122, 5644–5645 CrossRef CAS.
- F. Arjmand and S. Parveen, RSC Adv., 2012, 2, 6354–6362 RSC.
- F. Mancina and P. Tecilla, New J. Chem., 2007, 31, 800–817 RSC.
- M. Nath, S. Pokharia, G. Eng, X. Song and A. Kumar, J. Organomet. Chem., 2003, 669, 109–123 CrossRef CAS.
- F. Arjamnd, G. C. Sharma, M. Muddassir and S. Tabassum, Chirality, 2011, 23, 557–567 CrossRef PubMed.
- S. Parveen, M. Usman, S. Tabassum and F. Arjmand, RSC Adv., 2015, 5, 72121–72131 RSC.
- M. Chauhan, K. Banerjee and F. Arjmand, Inorg. Chem., 2007, 46, 3072–3082 CrossRef CAS PubMed.
- Z. A. Siddqui, P. K. Sharma, M. Shahid, M. Khalid, Anjuli, A. Siddique and S. Kumar, Eur. J. Med. Chem., 2012, 57, 102–111 CrossRef PubMed.
- A. Z. EI-Sonbati, A. S. AI-Shihri and A. A. E. I. Bindary, J. Inorg. Organomet. Polym., 2003, 13, 99–108 CrossRef.
- F. Dimiza, S. Fountoulaki, A. N. Papadopoulos, C. A. Kontogiorgis, V. Tangoulis, C. P. Raptopoulou, V. Psycharis, A. Terzis, D. P. Kessissogloua and G. Psomas, Dalton Trans., 2011, 40, 8555–8568 RSC.
- C. N. Banti, A. D. Giannoulis, N. Kourkoumelis, A. M. Owczarzak, M. Poyraz, M. Kubicki, K. Charalabopoulos and S. K. Hadjikakou, Metallomics, 2012, 4, 545–560 RSC.
- A. Jansco, L. Nagy, E. Moldrheim and E. J. Sletten, Dalton Trans., 1999, 1587–1594 Search PubMed.
- P. Yang and M. Guo, Met.-Based Drugs, 1998, 5, 41–48 CrossRef CAS PubMed.
- L.-F. Tan, H. Chao, K.-C. Zhen, J.-J. Fei, F. Wang, Y.-F. Zhou and L.-N. Ji, Polyhedron, 2007, 26, 5458–5468 CrossRef CAS.
- Q.-Q. Zhang, F. Zhang, W.-G. Wang and X.-L. Wang, J. Inorg. Biochem., 2006, 100, 1344–1352 CrossRef CAS PubMed.
- A. Rodger and B. Nord’en, Circular Dichroism and Linear Dichroism, Oxford Chemistry Press, UK, 1997 Search PubMed.
- D. Lahiri, S. Roy, S. Saha, R. Majumdar and R. R. Dighe, Dalton Trans., 2015, 1–25 Search PubMed.
- A. Martínez, C. S. K. Rajapakse, R. A. Sánchez-Delgado, A. Varela-Ramirez, C. Lema and R. J. Aguilera, J. Inorg. Biochem., 2010, 104, 967–977 CrossRef PubMed.
- D. S. Raja, N. S. P. Bhuvanesh and K. Natarajan, Inorg. Chem., 2011, 50, 12852–12866 CrossRef CAS PubMed.
- F. Mancin and P. Tecilla, New J. Chem., 2007, 31, 800–817 RSC.
- S. Kathiresan, T. Anand, S. Mugesh and J. Annaraj, J. Photochem. Photobiol., B, 2015, 148, 290–301 CrossRef CAS PubMed.
- J. Tan, L. Zhu and B. Wang, Dalton Trans., 2009, 4722–4728 RSC.
- T. Jun, W. Bochua and Z. Liancai, Bioorg. Med. Chem. Lett., 2007, 17, 1197–1199 CrossRef PubMed.
- S. Parveen, S. Tabassum and F. Arjmand, J. Organomet. Chem., 2016, 823, 23–33 CrossRef CAS.
- I. Yousuf, F. Arjmand, S. Tabassum, L. Toupet, R. A. Khan and M. A. Siddiqui, Dalton Trans., 2015, 44, 10330–10342 RSC.
- K. Jeyalakshmi, Y. Arun, N. S. P. Bhuvanesh, P. T. Perumal, A. Sreekanth and R. Karvembu, Inorg. Chem. Front., 2015, 2, 780–798 RSC.
- G. Macindoe, L. Mavridis, V. Venkatraman, M. D. Devignes and D. W. Ritchie, Nucleic Acids Res., 2010, 38, 445–449 CrossRef PubMed.
Footnote |
| † Electronic supplementary information (ESI) available. See DOI: 10.1039/c6ra24770a |
| This journal is © The Royal Society of Chemistry 2017 |

