 Open Access Article
Application of dyes as doping agents in MALDI-MS matrices for the signal enhancement of proteins†
Arslan Alia,
Najia Shahida and
Syed Ghulam Musharraf *ab
*ab
aH.E.J. Research Institute of Chemistry, International Center for Chemical and Biological Sciences, University of Karachi, Karachi-75270, Pakistan. E-mail: musharraf1977@yahoo.com; Fax: +92 21 4819018; Fax: +92 21 4819019; Tel: +92 21 4824924 Tel: +92 21 4824925 Tel: +92 21 4819010
bDr. Panjwani Center for Molecular Medicine and Drug Research, International Center for Chemical and Biological Sciences, University of Karachi, Karachi-75270, Pakistan
First published on 20th January 2017
Abstract
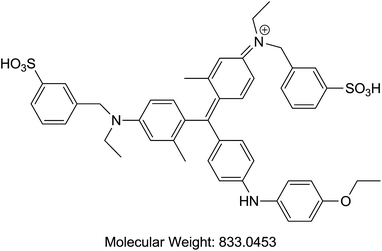
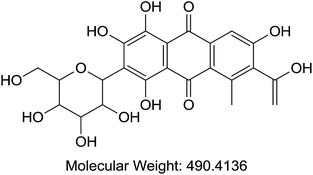
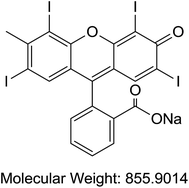
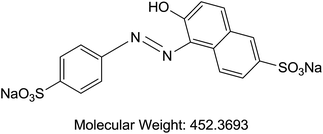
Matrix Assisted Laser Desorption Ionization Mass Spectrometry (MALDI-MS) is considered as a technique of choice for analysing proteins and peptides. Several modifications have been proposed to increase the sensitivity of MALDI-MS procedure so that low abundant proteins can be targeted. The present work describes the study of the possible increase in MALDI-MS sensitivity by increasing the ion generation via use of dopants in MALDI-MS matrices. These dopant constitutes commonly used dyes such as Coomassie Blue G-250 (A), Cochineal (B), Erythrosin B (C), Sunset yellow (D), and Acid Red 1 (E), which when employed in 0.1–100 pM range along with conventional MALDI-MS matrices such as α-cyano-4-hydroxycinnamic acid (HCCA), sinapic acid (SA) and 2,5-dihydroxybenzoic acid (DHB), can significantly increase (×2–35) the ion intensity of proteins such as bovine serum albumin (BSA), myoglobin, casein and insulin. Moreover, such effect remains consistent when applied to analyse real samples such as honey and egg white analysis.
Introduction
Due to features like high-throughput analysis, ease of use, sensitivity etc., Matrix Assisted Laser Desorption Ionization Mass Spectrometry (MALDI-MS) is an outstanding analytical tool for the analysis of proteins and peptides since its inception.1–5 In order to study the proteins and peptides, several attempts have been made to further improve the limits of detection of MALDI-MS technique by employing different methodologies. Efforts were made to increase sensitivity by improving the hardware of mass spectrometers. These include improving both the ionization techniques, and detection technologies, etc.6–10 However, changes in the instrument hardware are expensive and require cutting edge technologies.11–15One of the ways to improve ion formation is to modify the MALDI-MS analysis procedures. Several attempts have also been made to increase the efficiency of ion formation during MALDI-MS operations. These include designing new matrices, chromophoric tagging and introducing a variety of additives as co-matrices.16–23 Many of these methods include expensive or inaccessible materials, such as nanoparticles, etc.24 To prepare such matrices one may also require specialized skills and chemicals which limit the general acceptance of these approaches.25
Dyes show strong absorbance in the UV-Visible region and in most cases exhibits acidic or basic properties. Previous attempts have been made to use many dye materials as MALDI-MS matrix both for conventional analysis and MALDI-MS imaging.26–29 However, the use remains limited for either specific class of compounds, such as lipids, or these methods in most cases were not able to outperform, and thus replace, the ability of commonly used UV-MALDI-MS matrices such as as α-cyano-4-hydroxycinnamic acid (HCCA), sinapic acid (SA) and 2,5-dihydroxybenzoic acid (DHB). Detailed studies on the interaction of dyes with protein when added along with matrices were previously reported by Salih et al. which suggest the electrostatic interaction can occur between protein and dye molecules leading to the dye–protein complex formation and can induce other effects such as in-source and post source decay of the analyte ions.30 Kruger et al. have employed the use of dyes to observe analyte incorporation and ionization during MALDI-MS process31,32 which suggests that dyes when added in combination of matrix can induce considerable effect on the ionization process. Therefore, it is suggested that dyes may have the potential to be used as matrix additives, which can possibly mediate energy transfer between laser derived photons and the matrix molecules, and the proton transfer between matrix and analyte molecules.21,33 Another advantage of using dyes is their wide and cheap availability.
This study aims to evaluate the potential of five commonly used dyes (Coomassie Blue G-250, Cochineal, Erythrosin B, Sunset yellow and Acid Red 1) for their ability to influence the ionizability of proteins. Optimization of factors, such as types of dyes, effective concentration, laser fluence etc. was performed using commercially available protein standards.
The generality and validity of the use of these dyes was established by applying them for the analysis of proteins in samples, such as egg white, and honey. This newly established method will require almost no time to be adapted by the labs involved in protein analysis through laser desorption (LDI) techniques. Their use will not require any additional skills and training. It is also suggested that users involved in protein analysis, including research laboratories, regulatory authorities and organisations, clinical purposes, pharmaceutical industry etc. can benefit from this method.21,34–37 Scientists aiming for better understanding of ionization mechanism and/or analyte incorporation into the matrix during MALDI-MS operation might also find this study interesting. To the best of our knowledge, no study exploring the potential of commonly used dyes as dopants for the enhancement of signal intensity in MALDI-MS analysis has been published so far.
Experimental section
Chemicals
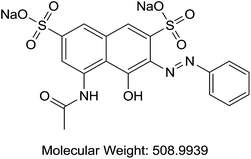
Acetonitrile and methanol were purchased from Tedia (Fairfield, OH, USA). Alpha cyano 4-hydroxy cinnamic acid (HCCA), sinapinic acid (SA), 2,5-dihydroxybenzoic acid (DHB), trifluoroaceti acid (TFA), and formic acid (FA) were purchased from Sigma-Aldrich (St. Louis, MO, USA). Coomassie Blue G-250 (A), purity > 90%, (TLC), Cochineal (B) purity ≥ 96.0% (HPLC), Erythrosin B (C), purity 98% (HPLC), Sunset yellow (D), purity 95% (HPLC), and Acid Red 1 (E) dye content 60% were also acquired from Sigma-Aldrich as sodium salts (St. Louis, MO, USA) (Table 1). Bovine Serum Albumin (BSA), myoglobin, casein, and insulin were purchased from Sigma-Aldrich (St. Louis, MO, USA). Samples of honey were purchased from Young's Foods, Karachi, Pakistan and chicken egg samples were acquired from the local market.Preparation of standard and sample solutions
All dyes were initially dissolved in methanol to attain 1 mM concentration, then diluted to 1 μM and then further diluted to the working solutions of 100, 10, 1 and 0.1 pM, respectively, in Milli-Q water. Standard protein solutions were made by dissolving BSA, myoglobin, casein, and insulin, in 0.1% TFA with 20 μM, 200 μM, 200 μM, and 200 μM concentrations, respectively. Myoglobin, casein and insulin solution were further diluted to 20 μM in 0.1% TFA. Egg white and honey sample were weighed 1 mg and diluted ×100 using ACN![[thin space (1/6-em)]](https://www.rsc.org/images/entities/char_2009.gif) :
:![[thin space (1/6-em)]](https://www.rsc.org/images/entities/char_2009.gif) H2O (1
H2O (1![[thin space (1/6-em)]](https://www.rsc.org/images/entities/char_2009.gif) :
:![[thin space (1/6-em)]](https://www.rsc.org/images/entities/char_2009.gif) 1) solutions. The details of statistical analysis and spotting plan generation are mentioned in the (ESI Method S1†).
1) solutions. The details of statistical analysis and spotting plan generation are mentioned in the (ESI Method S1†).
MALDI-MS analysis
Saturated solution of HCCA was prepared in ACN![[thin space (1/6-em)]](https://www.rsc.org/images/entities/char_2009.gif) :
:![[thin space (1/6-em)]](https://www.rsc.org/images/entities/char_2009.gif) acid in H2O, 2
acid in H2O, 2![[thin space (1/6-em)]](https://www.rsc.org/images/entities/char_2009.gif) :
:![[thin space (1/6-em)]](https://www.rsc.org/images/entities/char_2009.gif) 1 (v/v) with different acid concentrations (0.1% TFA, 0.01% TFA and 0.01% FA). Saturated solution of DHB was prepared by dissolving in mixture of ACN and 0.1% TFA in 1
1 (v/v) with different acid concentrations (0.1% TFA, 0.01% TFA and 0.01% FA). Saturated solution of DHB was prepared by dissolving in mixture of ACN and 0.1% TFA in 1![[thin space (1/6-em)]](https://www.rsc.org/images/entities/char_2009.gif) :
:![[thin space (1/6-em)]](https://www.rsc.org/images/entities/char_2009.gif) 1 (v/v) ratio, and the saturated solution of SA was prepared in in the mixture of ACN and 0.1% TFA in 1
1 (v/v) ratio, and the saturated solution of SA was prepared in in the mixture of ACN and 0.1% TFA in 1![[thin space (1/6-em)]](https://www.rsc.org/images/entities/char_2009.gif) :
:![[thin space (1/6-em)]](https://www.rsc.org/images/entities/char_2009.gif) 2 (v/v) ratios. Solutions were vortexed, then sonicated for 10 min and finally centrifuged at 7000 rpm for 5 min. Analysis was performed by applying 1 μL matrix solution, followed by addition of 1 μL standard protein solution, and then final addition of 1 μL dye solution. Each of the above mentioned addition was followed till the time until solution was completely dried. Once the spot is dried, the mass spectra were recorded by averaging, 1200 shots per spot. MALDI mass spectra were recorded using a Bruker Ultraflex III MALDI-TOF/TOF mass spectrometer (Bruker Daltonics, Bremen GmbH, Germany), equipped with Smartbeam Nd:YAG UV laser (355 nm, 5 ns laser pulse duration, 100 Hz). All standards were recorded in the linear mode, with 1200 laser shots with maintaining same laser energy for each protein standard, collected at random across each sample spot. In linear mode, the acceleration voltage, grid voltage, and delayed extraction time were set as 20 kV, 65%, and 190 ns, respectively. Data acquisition, and analysis were performed in positive polarity on Flex Control 1.3 and Flex Analysis 1.3 softwares (Bruker Daltonics, Bremen GmbH, Germany), respectively. Mass spectra of the honey samples and chicken egg white samples were also recorded using the above mentioned method.
2 (v/v) ratios. Solutions were vortexed, then sonicated for 10 min and finally centrifuged at 7000 rpm for 5 min. Analysis was performed by applying 1 μL matrix solution, followed by addition of 1 μL standard protein solution, and then final addition of 1 μL dye solution. Each of the above mentioned addition was followed till the time until solution was completely dried. Once the spot is dried, the mass spectra were recorded by averaging, 1200 shots per spot. MALDI mass spectra were recorded using a Bruker Ultraflex III MALDI-TOF/TOF mass spectrometer (Bruker Daltonics, Bremen GmbH, Germany), equipped with Smartbeam Nd:YAG UV laser (355 nm, 5 ns laser pulse duration, 100 Hz). All standards were recorded in the linear mode, with 1200 laser shots with maintaining same laser energy for each protein standard, collected at random across each sample spot. In linear mode, the acceleration voltage, grid voltage, and delayed extraction time were set as 20 kV, 65%, and 190 ns, respectively. Data acquisition, and analysis were performed in positive polarity on Flex Control 1.3 and Flex Analysis 1.3 softwares (Bruker Daltonics, Bremen GmbH, Germany), respectively. Mass spectra of the honey samples and chicken egg white samples were also recorded using the above mentioned method.
Results and discussion
Our analysis revealed that ion intensity of protein analyte can be influenced by adding dyes as doping agents at different mass ranges. Also, different dyes induced similar impact on the ionization efficiency of analytes when added to common MALDI matrices. As the ionization phenomena during MALDI-MS process is very complex and not well understood hence it is difficult to propose any probable mechanism of action of these dyes. However, there is a speculation that dyes might be able to harvest energy from laser fluence more efficiently then matrix molecules alone. Also, previous studies suggests that dyes may interact with proteins to form dye–protein complexes,32 which might show better ionization efficiency in comparison to proteins molecules due to the presence of strong acidic/basic groups present on a dye moiety. It is also possible that the incorporation of dyes into the MALDI-MS matrix results in change in the crystal structures thus behaving differently under ionization process. However, in order to validate these proposals further studies will be required.All possible combinations of 3 commonly used Matrices (HCCA, SA, and DHB) were studied with 5 common dyes (A, B, C, D, and E) with 4 levels of concentrations of the doping solutions (0.1, 1, 10, and 100 pM) of each dye used. Structures of dyes used in this study are given in Table 1. All combinations were used to analyse both standards (myoglobin, casein, BSA and insulin) and samples (egg white and honey) with each analysis recorded in triplicate. Four response factors such as signal intensity, area, signal-to-noise ratio (S/N) and resolution were evaluated against 3 variables that were thought to influence the analysis of proteins in the case of doping with dyes namely type of matrix, type of dye and concentration of dye. The summarized data with maximum peak intensity and acceptable peak shape is tabulated in ESI Tables S1–S4.†
Analysis of standard proteins
In this study, we have analysed four standards covering the approximate mass range of 5.7 kDa to 66.8 kDa. Our analysis revealed that the dyes with acid/base properties when doped in the concentration range of 0.1 to 100 pM can increase the ionization efficiency of protein analytes, thus, increasing the sensitivity of the MALDI-MS. The dyes which show best performance i.e. maximum ion intensities without compromising peak shape are summarized in Table 2. Analysis of BSA with HCCA reveals [M + H]+ at about m/z 66![[thin space (1/6-em)]](https://www.rsc.org/images/entities/char_2009.gif) 852.2 with maximum ion intensity of 0.3 × 10⁴ a.u. ion abundance. When this analysis was performed with the added dye such as B the ion intensity was increased by at least eight times (Fig. 1). Analysis performed with SA in combination with dye D resulted in 4× increase in signal, while analysis with DHB in combination with dye E resulted in 6× increase in the ion intensity (Table 2 and ESI Table S1†). The overall comparison reveals that maximum intensity of BSA was achieved using DHB with dye E. Fig. 2 presents the comparative analysis of BSA when all five different dyes were used in combination with the three common matrices.
852.2 with maximum ion intensity of 0.3 × 10⁴ a.u. ion abundance. When this analysis was performed with the added dye such as B the ion intensity was increased by at least eight times (Fig. 1). Analysis performed with SA in combination with dye D resulted in 4× increase in signal, while analysis with DHB in combination with dye E resulted in 6× increase in the ion intensity (Table 2 and ESI Table S1†). The overall comparison reveals that maximum intensity of BSA was achieved using DHB with dye E. Fig. 2 presents the comparative analysis of BSA when all five different dyes were used in combination with the three common matrices.
| Standard | Matrix | Approximate ion intensity (a.u.) | Ion intensity (with dye) (a.u.) | Approx. fold change |
|---|---|---|---|---|
| Bovine serum albumin (BSA) | HCCA | 0.3 × 10⁴ | 2.4 × 10⁴ (B) | 8× |
| SA | 0.25 × 10⁴ | 0.9 × 10⁴ (D) | ≤4× | |
| DHB | 0.8 × 10³ | 5.5 × 10³ (E) | ≤7× | |
| Myoglobin | HCCA | 0.4 × 10⁴ | 5.5 × 10⁴ (D) | ≤14× |
| SA | 0.35 × 10⁴ | 1.15 × 10⁴ (C) | ≥3× | |
| DHB | 0.5 × 10⁴ | 1.2 × 10³ (A) | ≥2× | |
| Insulin | HCCA | 0.4 × 10⁴ | 1.45 × 10⁵ (B) | ≥35× |
| SA | 0.3 × 10⁴ | 6 × 10⁴ (C) | 20× | |
| DHB | 0.3 × 10⁴ | 1.25 × 10⁴(C) | ≥4× | |
| Casein | HCCA | 0.3 × 10³ | 4.3 × 10³ (C) | ≥14× |
| SA | 0.75 × 10⁴ | 1.4 × 10⁴ (C) | 2× | |
| DHB | 0.4 × 10³ | 5 × 10³ (A) | ≥12× |
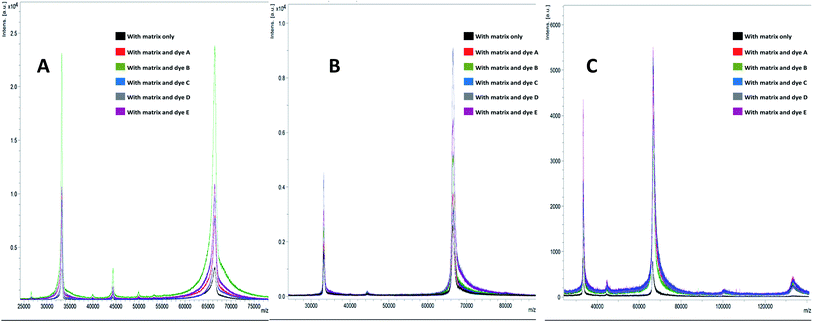 | ||
| Fig. 1 MALDI-MS spectra of bovine serum albumin (BSA) when analysed with matrices (A) HCCA, (B) SA and (C) DHB with dyes (A–E) and without dyes. | ||
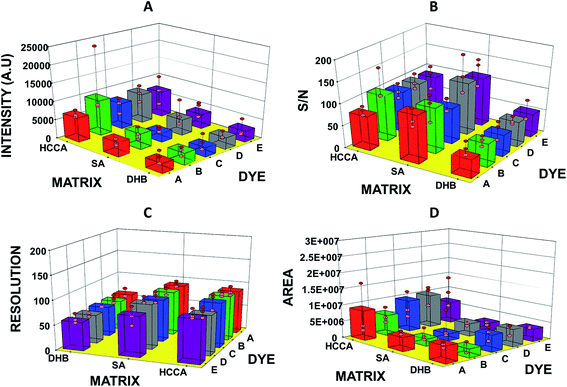 | ||
| Fig. 2 Graphs showing (A) intensity, (B) S/N ratio, (C) resolution, and (D) area of bovine serum albumin (BSA) observed in MADLI-MS spectra vs. matrix and dyes used for analysis. | ||
Analysis of myoglobin performed with the DHB produced maximum ion intensity. The intensity of 0.5 × 10⁴ a.u. was observed as compared to analysis with HCCA and SA matrices. Analysis of myoglobin with HCCA reveals [M + H]+ at about m/z 16![[thin space (1/6-em)]](https://www.rsc.org/images/entities/char_2009.gif) 872.7 with similar ion intensity of 0.4 × 10⁴ ion abundance (Table 2). When this analysis was performed with the added dye D with HCCA the ion intensity was increased to 5.5 × 10⁴ a.u. with approximately 14× increase (ESI Fig. S1†). Similar effects were observed on the peak area, peak height, S/N ratio, and resolution of the peak at the same m/z (ESI Fig. S2 and Table S2†).
872.7 with similar ion intensity of 0.4 × 10⁴ ion abundance (Table 2). When this analysis was performed with the added dye D with HCCA the ion intensity was increased to 5.5 × 10⁴ a.u. with approximately 14× increase (ESI Fig. S1†). Similar effects were observed on the peak area, peak height, S/N ratio, and resolution of the peak at the same m/z (ESI Fig. S2 and Table S2†).
During the analysis of insulin standard, maximum intensity was observed when insulin standard was analysed with the HCCA. Analysis of insulin with HCCA showed [M + H]+ at about m/z 5702.4 with ion intensity of 0.5 × 10⁴ a.u. (ESI Fig. S3†). When this analysis was performed with the added dye such as B the ion intensity was increased to 1.45 × 10⁵ a.u., a 35× increase (Table 2 and ESI S3†). Comparative analysis reveals that the maximum intensity was achieved by the above mentioned combination (ESI Fig. S4†).
Analysis of casein with SA showed [M + H]+ at about m/z 23![[thin space (1/6-em)]](https://www.rsc.org/images/entities/char_2009.gif) 894.1 with the maximum ion intensity of 0.75 × 10⁴ while analysis with HCCA resulted in the ion intensity of 0.3 × 10³ a.u. When this analysis was performed with the added dye such as C to matrix DHB, the twice ion intensity of 1.4 × 10⁴ a.u. was achieved in comparison to analysis with DHB and 13× increase was observed with respect to analysis with HCCA (Table 2 and ESI Fig. S5†). Statistical analysis suggests that the signal intensity and S/N ratio of casein were increased by all combinations, though, some combinations tend to produce more pronounced impact (ESI Data S6 and Table S4†).
894.1 with the maximum ion intensity of 0.75 × 10⁴ while analysis with HCCA resulted in the ion intensity of 0.3 × 10³ a.u. When this analysis was performed with the added dye such as C to matrix DHB, the twice ion intensity of 1.4 × 10⁴ a.u. was achieved in comparison to analysis with DHB and 13× increase was observed with respect to analysis with HCCA (Table 2 and ESI Fig. S5†). Statistical analysis suggests that the signal intensity and S/N ratio of casein were increased by all combinations, though, some combinations tend to produce more pronounced impact (ESI Data S6 and Table S4†).
Effect of types and concentration of dyes
Our studies revealed that all 5 dyes employed as additives showed similar influence on the ion intensity, S/N ratio, peak area of the analyte peak. With very few exceptions, there was similar increase of ion intensity, while resolution was found not to be affected significantly (ESI Data S1 to S4†). However, analysis of casein showed significant differences in the extent of increase in the ion intensity and S/N ratio were observed when different dyes were employed. It is also suggested that the dyes are effective between the concentration range of 0.1 pM and 100 pM. When used in this range, dyes showed similar impact i.e. similar enhancement of signals, on the ion intensity of the [M + H]+ of the protein standards. However, noticeable variations in ion intensities and peak areas were observed between replicate analyses along with broader peaks (Fig. 2, ESI S2–S6†). The broadening of peaks might be due to the complex formations/interactions between proteins and dye molecules as suggested by Salih et al.30 In house data suggests that higher concentrations (>10 nM) tend to decrease the ion intensity of the standards.Analysis of real samples
Relatively complex samples, such as egg white and natural honey were chosen to validate the inference that dyes can influence the ionization efficiency of analytes. It was found that when these samples were analysed without any pre-treatment (except dilution), the conventional MALDI procedures were not able to produce any significant signals while doping with dyes tend to give rise to several signals for mass range >1200 Da. All possible combinations of matrices and dyes (at 10 pM conc.) were employed to analyse the egg white samples, diluted to 100× using 1![[thin space (1/6-em)]](https://www.rsc.org/images/entities/char_2009.gif) :
:![[thin space (1/6-em)]](https://www.rsc.org/images/entities/char_2009.gif) 1 ACN
1 ACN![[thin space (1/6-em)]](https://www.rsc.org/images/entities/char_2009.gif) :
:![[thin space (1/6-em)]](https://www.rsc.org/images/entities/char_2009.gif) H2O mixture. Analysis revealed the presence of at least 6 signals in the range of 22 to 100 kDa, with the maximum ion intensity in the order of 1800 a.u. was observed with dye A doped to matrix SA. Whereas, similar analysis by standard MALDI-MS spotting procedures fail to give any results (Fig. 3 and ESI Fig. S7 and S8†).
H2O mixture. Analysis revealed the presence of at least 6 signals in the range of 22 to 100 kDa, with the maximum ion intensity in the order of 1800 a.u. was observed with dye A doped to matrix SA. Whereas, similar analysis by standard MALDI-MS spotting procedures fail to give any results (Fig. 3 and ESI Fig. S7 and S8†).
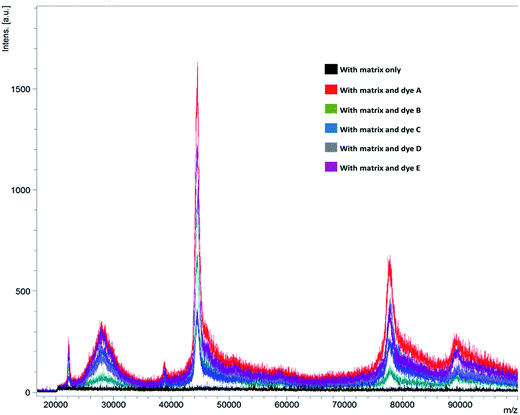 | ||
| Fig. 3 MALDI-MS spectra of egg white analysed with sinapic acid (SA) with and without dyes (A–E) for the possible detection of proteins. | ||
Analysis of natural honey samples, diluted to 100× using ACN![[thin space (1/6-em)]](https://www.rsc.org/images/entities/char_2009.gif) :
:![[thin space (1/6-em)]](https://www.rsc.org/images/entities/char_2009.gif) H2O, showed the presence of at least one broad signal in the range of 10 to 15 kDa with intensity between 1000 to 2000 a.u., while similar analysis by standard procedures yielded a signal intensity of 100 to 500 a.u. (ESI Fig. S9–S11†). However, it is not clear that the signals recoded are from the proteins and there is strong possibility that these signals might be due to the presence of polydisperse carbohydrates. The better response of DHB also supports this idea as DHB is considered good matrix for carbohydrates.
H2O, showed the presence of at least one broad signal in the range of 10 to 15 kDa with intensity between 1000 to 2000 a.u., while similar analysis by standard procedures yielded a signal intensity of 100 to 500 a.u. (ESI Fig. S9–S11†). However, it is not clear that the signals recoded are from the proteins and there is strong possibility that these signals might be due to the presence of polydisperse carbohydrates. The better response of DHB also supports this idea as DHB is considered good matrix for carbohydrates.
Conclusion
This study suggested that the doping of dyes along with the matrices regularly used for MALDI analysis can cause significant variations in the intensity, area and signal-to-noise ratio of the analytes. We have studied the effects of these dyes by varying types and concentrations of dopants on analytes signals representing different masses during MALDI-MS analysis. It is suggested that such doping agents tends to increase the intensity of the analyte signals thus making MALDI-MS procedure more sensitive for standard proteins such as BSA, myoglobin, insulin, and casein. In some instances we observed broadened peaks suggesting dye–protein complex formations along with the possibility of in-source and post source decay of analytes, which can limit the use of this procedure in case of complex mixture analysis. The analysis of diluted honey and chicken egg white sample with this procedure produced significantly better mass spectra than with the conventional procedure. We suggest that this method can be used to study low concentration proteins, such as in plasma, cell culture and in food samples such as honey, egg, etc. and to study mechanism of ionization process during MALDI-MS operations.Acknowledgements
The authors are thankful to the Organization for the Prohibition of Chemical Weapons (OPCW), the Netherland, for providing financial support for project no. L/ICA/ICB/173681/12.References
- C. Fenselau, Anal. Chem., 1997, 69, A661–A665 CrossRef.
- R. Beavis, T. Chaudhary and B. Chait, Org. Mass Spectrom., 1992, 27, 156–158 CrossRef CAS.
- R. Beavis and B. Chait, Proc. Natl. Acad. Sci. U. S. A., 1990, 87, 6873–6877 CrossRef CAS.
- U. Bahr, M. Karas and F. Hillenkamp, Fresenius' J. Anal. Chem., 1994, 348, 783–791 CrossRef CAS.
- M. Karas, D. Bachmann and F. Hillenkamp, Anal. Chem., 1985, 57, 2935–2939 CrossRef CAS.
- G. L. Andrews, B. L. Simons, J. B. Young, A. M. Hawkridge and D. C. Muddiman, Anal. Chem., 2011, 83, 5442–5446 CrossRef CAS PubMed.
- A. Michalski, E. Damoc, J.-P. Hauschild, O. Lange, A. Wieghaus, A. Makarov, N. Nagaraj, J. Cox, M. Mann and S. Horning, Mol. Cell. Proteomics, 2011, 10, M111.011015 Search PubMed.
- D. Debois, V. Bertrand, L. Quinton, M.-C. De Pauw-Gillet and E. De Pauw, Anal. Chem., 2010, 82, 4036–4045 CrossRef CAS PubMed.
- R. B. Cody, J. A. Laramée and H. D. Durst, Anal. Chem., 2005, 77, 2297–2302 CrossRef CAS PubMed.
- R. D. Smith, J. A. Loo, C. G. Edmonds, C. J. Barinaga and H. R. Udseth, Anal. Chem., 1990, 62, 882–899 CrossRef CAS PubMed.
- U. Bahr, J. Stahl-Zeng, E. Gleitsmann and M. Karas, J. Mass Spectrom., 1997, 32, 1111–1116 CrossRef CAS.
- A. Honda, H. Sonobe, A. Ogata and K. Suzuki, Chem. Commun., 2005, 42, 5340–5342 RSC.
- Y. Lin, C. Yang and Y. Chen, Rapid Commun. Mass Spectrom., 2004, 18, 313–318 CrossRef CAS PubMed.
- A. N. Krutchinsky, A. V. Loboda, V. L. Spicer, R. Dworschak, W. Ens and K. G. Standing, Rapid Commun. Mass Spectrom., 1998, 12, 508–518 CrossRef CAS.
- M. L. Vestal, P. Juhasz and S. A. Martin, Rapid Commun. Mass Spectrom., 1995, 9, 1044–1050 CrossRef CAS.
- J. Bailes, L. Vidal, D. Ivanov and M. Soloviev, J. Nanobiotechnol., 2009, 7, 10 CrossRef PubMed.
- R. Beavis and B. Chait, Rapid Commun. Mass Spectrom., 1989, 3, 432–435 CrossRef CAS PubMed.
- C. Chen and Y. Chen, Rapid Commun. Mass Spectrom., 2004, 18, 1956–1964 CrossRef CAS PubMed.
- C. Chen and Y. Chen, Anal. Chem., 2004, 76, 1453–1457 CrossRef CAS PubMed.
- A. I. Gusev, W. R. Wilkinson, A. Proctor and D. M. Hercules, Anal. Chem., 1995, 67, 1034–1041 CrossRef CAS.
- S. Okuno, M. Nakano, G. Matsubayashi, R. Arakawa and Y. Wada, Rapid Commun. Mass Spectrom., 2004, 18, 2811–2817 CrossRef CAS PubMed.
- T. Seino, H. Sato, A. Yamamoto, A. Nemoto, M. Torimura and H. Tao, Anal. Chem., 2007, 79, 4827–4832 CrossRef CAS PubMed.
- S. Wang, K. Ledingham, W. Jia and R. Singhal, Appl. Surf. Sci., 1996, 93, 205–210 CrossRef CAS.
- S. Eustis and M. A. El-Sayed, Chem. Soc. Rev., 2006, 35, 209–217 RSC.
- L. C. Chen, K. Mori, H. Hori and K. Hiraoka, Int. J. Mass Spectrom., 2009, 279, 41–46 CrossRef CAS.
- C. Yang, X. Hu, A. V. Loboda and R. H. Lipson, J. Am. Soc. Mass Spectrom., 2010, 21, 294–299 CrossRef CAS PubMed.
- C. J. Smith, S. Y. Chang and E. S. Yeung, J. Mass Spectrom., 1995, 30, 1765–1767 CrossRef CAS.
- X. K. Hu, D. Lacey, J. Li, C. Yang, A. V. Loboda and R. H. Lipson, Int. J. Mass Spectrom., 2008, 278, 69–74 CrossRef CAS.
- K. Arafah, R. Longuespée, A. Desmons, O. Kerdraon, I. Fournier and M. Salzet, OMICS: J. Integr. Biol., 2014, 18, 487–498 CrossRef CAS PubMed.
- B. Salih and R. Zenobi, Anal. Chem., 1998, 70, 1536–1543 CrossRef CAS PubMed.
- R. E. West Iii, J. B. Jacobs and D. Isailovic, Int. J. Mass Spectrom., 2015, 389, 39–46 CrossRef.
- R. Kruger, A. Pfenninger, I. Fournier, M. Gluckmann and M. Karas, Anal. Chem., 2001, 73, 5812–5821 CrossRef CAS PubMed.
- F. Luan, X. Xu, H. Liu and M. N. D. S. Cordeiro, Color. Technol., 2013, 129, 173–186 CAS.
- A. Croxatto, G. Prod'hom and G. Greub, FEMS Microbiol. Rev., 2012, 36, 380–407 CrossRef CAS PubMed.
- L. Marvin, M. Roberts and L. Fay, Clin. Chim. Acta, 2003, 337, 11–21 CrossRef CAS.
- K. Bombuwela, S. Kathirgamanathar, V. Thadhani, R. Jayalal, N. Adikaram, D. Wijesundara, R. Andersen, P. Wolseley and V. Karunaratne, J. Natl. Sci. Found. Sri Lanka, 2009, 36, 251–252 Search PubMed.
- M. Saugy, N. Robinson, C. Saudan, N. Baume, L. Avois and P. Mangin, Br. J. Sports Med., 2006, 40(1), i35–39 CrossRef PubMed.
Footnote |
| † Electronic supplementary information (ESI) available. See DOI: 10.1039/c6ra27156a |
| This journal is © The Royal Society of Chemistry 2017 |

