 Open Access Article
Creative Commons Attribution 3.0 Unported Licence
Establishment and application of a structure evolution model for aqueous foam based on fractal theory
Fei Wang,
Zhaomin Li*,
Hailong Chen and
Xibin Zhang
College of Petroleum Engineering, China University of Petroleum, Qingdao, 266580, Shandong, China. E-mail: lizhm@upc.edu.cn
First published on 13th January 2017
Abstract
The evaluation and simulation of foam-based materials are still matters of significant debate, despite the large number of available studies, due to the excellent properties of foam and its successful applications, especially in oil and gas field development. The properties of foam are substantially determined as a result of a dynamic structure, however few studies have been reported which investigate and perform measurements related to such a structure. In this work, a new model based on fractal theory is proposed for the simulation of aqueous foam. As a first step, the fractal characteristics of foam are confirmed using image processing and calculations. Accordingly, the foam structure is quantitatively studied by defining and calculating the foam fractal dimensions. Secondly, a foam structure evolution model is established, which reveals that the evolutional trend of the fractal dimensions of foam is non-linear with the changing of time, following an exponential equation. The model is then validated and a sensitivity analysis is also carried out. Finally, the applications of this model to the evaluation of foaming agents and the prediction of foam structures are discussed. These results are expected to be helpful for further understanding the dynamic characteristics of foam fluids and their advanced applications.
1 Introduction
Foam fluid is a gas–liquid dispersion system whose range of applications covers various fields due to its excellent properties, especially oil and gas field development,1 including enhanced oil recovery, matrix acidizing,2,3 gas breakthrough control, plugging removal, etc. The control of gas mobility and the liquid production profile show the great potential of foam as an intelligent fluid.4 Actually, a low permeability layer cannot be effectively developed in oil field production because of the heterogeneity of formation. Therefore, we inject foam liquid into the layers to improve reservoir heterogeneity. Foam liquid will get into the high permeability layer first and trap gas, creating a temporary plugging effect in the high permeability layer, and the whole process proceeds without human control. That is to say the bubble spontaneously finishes adjusting the injection profile, or is intelligent. Besides, the foam liquid can also smartly adjust the acid profile in the process of acidification, obtaining the same effect with less acid.Foam systems have the tendency to minimize the free energy by reducing the total interface surface area through foam coalescence. Previous studies have shown that the key to the successful use of foam in oil field development lies in its stability and ability to trap gas molecules.5–7 Therefore, it is important to evaluate the performance of foam fluid using model simulations prior to application, which has been extensively investigated in the available literature.
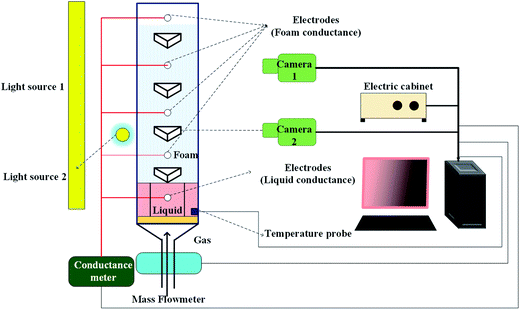
A number of methods have been employed for the performance evaluation of foam fluids,8 such as the Waring blender method9 and the Ross–Miles method.10 The advantages of employing the Waring blender method for the evaluation of the performance of foam fluids lie in its simplicity and reproducibility, as well as its capability to describe the foaming ability and stability of the foaming agent, however its results are somewhat too general to be employed in specific cases. In recent years, Foamscan equipment has been developed for the evaluation of foam fluid. Such equipment can measure the foam volume, the liquid volume, the liquid fraction and many other parameters, while monitoring the foam structure over time using a camera.
Foam fluid models are generally divided into static and dynamic models, the latter being more significant for practical applications. Research into dynamic models of foam fluid is mainly going in two directions. The first is foam drainage simulation; in this field, results from I. Saye Robert made a major contribution through describing the evolution of the foam membrane rearrangement, drainage, and rupture using a multi-scale model.11 The second research direction is toward foam flow simulations,12–43 which need to focus on the description of rheological characteristics in order to obtain successful results. Simulations of foam flow in pipes or porous media are widely used in petroleum engineering. A non-Newtonian fluid model was used for the simulation of foam flow in oil pipes, and rheological parameters were obtained experimentally.44 The simulation of foam flow in porous media can also be performed upon properly adapting the model to this system, but most methods for this task are based on a gas–liquid two-phase flow model.
The relative permeability and viscosity of a gas are known to vary during foam generation in porous media. Both parameters appear in the Darcy equation, and different methods have been employed to alter the mobility in various models, i.e., the reduction of the gas relative permeability, increasing the effective gas viscosity, or a combination of both. These models are generally divided into two types: local-equilibrium models and population balance models.41 Local-equilibrium models, especially the implicit texture model, involve a small number of parameters and are easy to solve, however they cannot properly account for the dynamic change in foam texture during foam transport in porous media, which influences foam mobility. On the other hand, population balance models can successfully achieve this goal, and are therefore widely used.
The evaluation methods for foam fluids usually allow the calculation of some macroscopic and static indexes, but fail to provide the dynamic characteristics which are essential for applications. Simulations of foam fluids have gradually taken foam structure into account. Furthermore, foam density has been introduced into population balance models to account for foam structure, although its value is based on empirical parameters. To summarize, the majority of models fail to provide a clear definition of foam structure, which is of primary importance for all foam fluid properties.
In this paper, we attempt to carry out a quantitative investigation of foam structure and present a new model, based on fractal theory, for foam simulation. This is mainly accomplished using image processing and derivations of the foam fractal dimensions. One of the primary objectives is to analyze the dynamic change in foam structure. Furthermore, we discuss a new evaluation method and foam structure prediction technique. Our results are of potential interest for dynamic studies of foam fluids and their advanced applications.
2 Establishment of the structure evolution model
2.1 Image acquisition and processing for aqueous foam
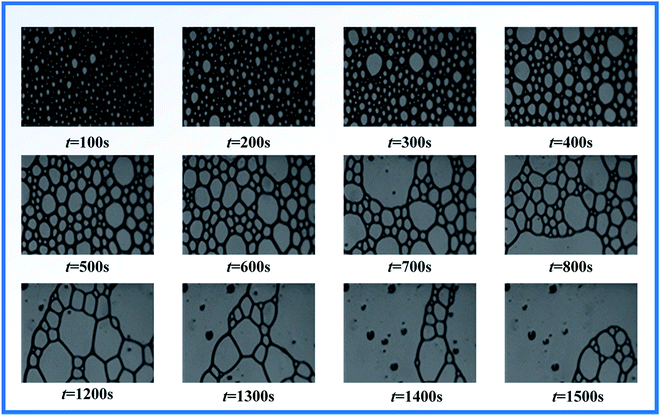
A visualization device is usually employed for aqueous foam image acquisition. In this work, we used Foamscan equipment, which monitors structural changes in foam while simultaneously analyzing some indexes, including foam volume, liquid volume, and liquid fraction.Images of the foaming and drainage processes for a SDS (sodium dodecyl sulfate) nitrogen foam, acquired using Foamscan, are shown in Fig. 2. These images track the evolution of the foam structure upon foaming, then upon changing from uniform small bubbles (time = 100 s) to coarsening bubbles (time = 1500 s). The draining, rupture and coalescence phases are clearly observable in the figure.
The first step is a gray-scale transformation to improve the clarity of the image. Such a transformation modifies the gray tone of each pixel, eventually changing the overall range and distribution of gray tones over the image in order to make the foam structure emerge more clearly.
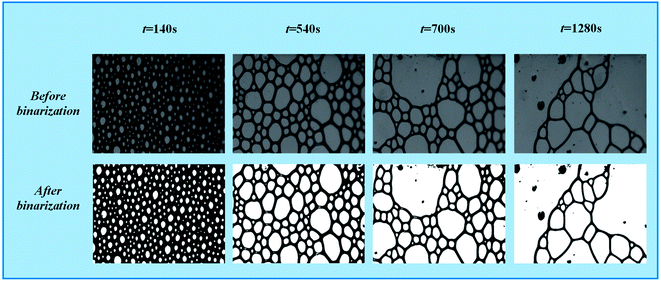
The second step consists of binarization processing which simplifies the image structure. Binary images are developed through selecting an appropriate threshold, which changes the brightness scale from the original 256-level scale to a simpler, bi-level scale. As a consequence, the boundary of the foam in the image becomes clearer. This process can be described using the following function.
 | (2.1) |
As shown in Fig. 3, the foam can be clearly divided into two parts after binarization, the bubble formed by gas (displayed in white in the figure) and the lamella formed by liquid (displayed in black).
2.2 Fractal characteristics of aqueous foam
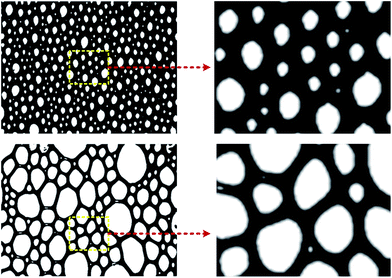
Fractal theory is a discipline that studies geometries, based on self-similarity, which are commonly found in a number of natural systems.45,46 In fact, almost all fractals are at least partially self-similar. This means that parts of the fractal are identical to the entire fractal on a smaller scale. Fractals attempt to model a complex iterative process by searching for the simpler processes underneath. From the images of foam after binarization, we can see that foam has an irregular structure which cannot be measured using conventional methods. However, foams are partially self-similar in a statistical sense, as shown in Fig. 4. In order to verify that the foam does have fractal characteristics, it is necessary to calculate the fractal dimensions of the foam.2.3 Fractal dimension calculations for aqueous foam
 | (2.2) |
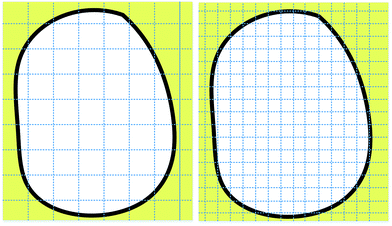 | ||
| Fig. 5 Sketch maps of two grid divisions for the box-counting dimension process, with different characteristic lengths. | ||
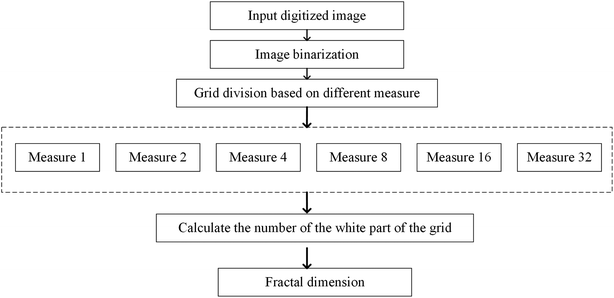
Since the characteristic length is a finite quantity, we can compare two basic graphical elements with different characteristic lengths to measure fractal graphics. Two sets of data, ri and Ni(ri), can be obtained through changing the characteristic length. Next, two double–logarithmic curves of the number of boxes are plotted as a function of the characteristic length. If the curve is linear, the foam structure possesses fractal characteristics, and the absolute value of the slope obtained using the least square method gives the fractal dimensions of the foam. If the curves are not linear, we can conclude that the foam structure does not possess fractal characteristics. A flow chart of the foam fractal dimension calculation process is presented in Fig. 6.
 | ||
| Fig. 7 Fractal dimension calculation curves for foam with 0.3 wt% SDS as a foaming agent at different times. (A) Time = 140 s; (B) time = 540 s; (C) time = 700 s; and (D) time = 1280 s. | ||
In general, the fractal dimensions identify the amount of space occupied by complex systems and measures the degree of irregularity. Since a foam fluid is a gas–liquid dispersion system, foam fractal dimensions can indicate the distribution of gas in a liquid, i.e., a smaller fractal dimension for a certain foam indicates a more uniform distribution of bubbles throughout the foam. Conversely, the bigger the fractal dimension, the larger the irregularity of gas distribution. The four curves displayed in Fig. 7 allow identification of the process of foam coalescence as the fractal dimension grows.
2.4 Establishment of a foam structure evolution model
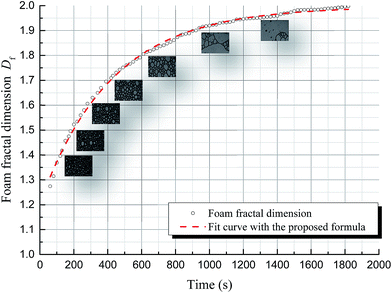
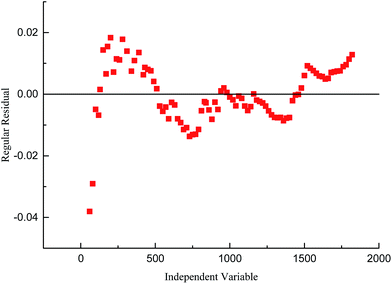
In the previous section, we used fractal dimensions to characterize the structure of foam. The dynamic change in the foam structure can then be simulated through studying the variation in fractal dimension with time.Fig. 8 shows the variation in SDS foam fractal dimension as a function of time, acquiring data for the calculations from Foamscan images, processed as discussed previously. The figure shows that the foam fractal dimension rapidly increases to 1.9, and gradually approaches 2 with a smaller slope. Non-linear correlation of this trend is observed. Using the function for exponential term curve fitting, the fitting error is about 2%, as shown in Fig. 9. Therefore, the fractal dimension of foam presents exponential behavior with the evolution of the foam structure (i.e., with time), leading to the following equation:
| Df = A + B(1 − e−kt) | (2.3) |
2.5 Model validation
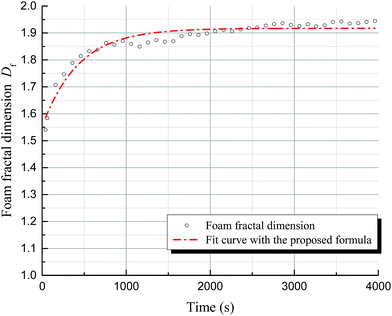
Since the development of the foam structure evolution model is based on SDS foam, in order to verify its applicability to other systems, we validated our model on other foaming agents, namely HY-2 (an ionic surfactant) and SDBS (sodium dodecyl benzene sulfonate). Fig. 10 shows the variation in the foam fractal dimension of HY-2 foam as a function of time. The fractal dimension of the foam and time show the same non-linear relationship as that found for SDS foam and the fitting error is about 4%, using the formula above.2.6 Sensitivity analysis
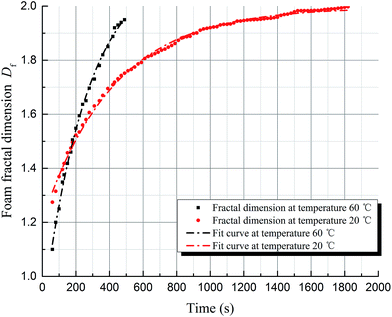
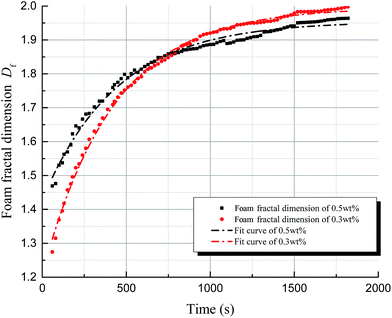
Foam structure is affected by various factors, including the type and concentration of foaming agent, the temperature and the pressure. In this part, we focus on the effects of temperature and concentration, which are the primary factors influencing the foam structure evolution model above.For convenient analysis, an effective interval of possible foam fractal dimension, E, is defined, which ranges from 1.5 to 1.85, according to the results discussed in the previous section. In this dimension range, the foam structure can be considered relatively stable. An effective time interval T can be defined as a lapse in time during which foam stability is maintained, i.e., the time range during which the fractal dimension belongs to the E interval.
| E = [1.5, 1.85] |
3 Application of the structure evolution model
3.1 Evaluation of foaming agents
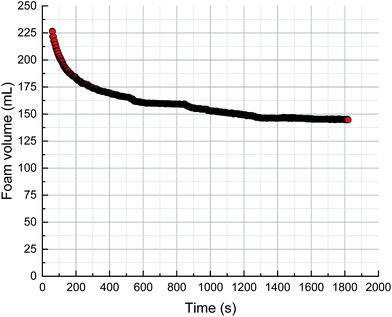
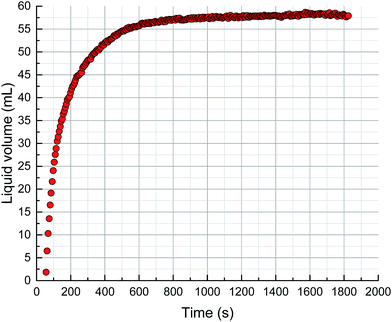
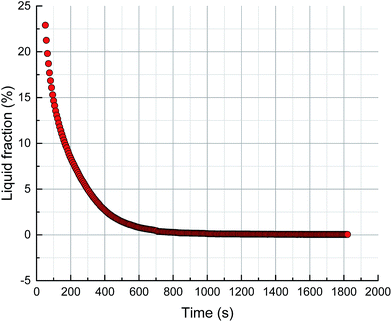
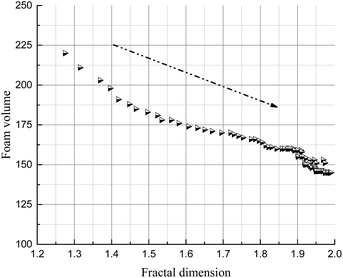
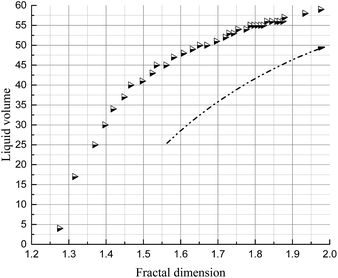
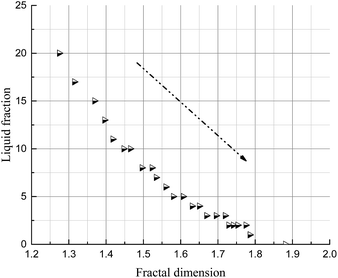
The foam volume, liquid volume and liquid fraction during drainage, analyzed using Foamscan, are shown in Fig. 13–15. An inspection of the trends shows that the foam volume initially exhibits a rapid drop and afterwards decreases slowly after 200 seconds. The liquid volume increases from nearly zero to the initial volume then remains stable, which simply indicates the drainage process. The liquid fraction rapidly falls to zero as the foam changes from wet to dry.As discussed in the previous sections, the key to the structure evolution model is the calculation of the foam fractal dimension, which is used to quantitatively characterize the foam structure. An analysis of correlation with foam fractal dimension is separately carried out between foam volume (Fig. 16), liquid volume (Fig. 17) and liquid fraction (Fig. 18), and foam fractal dimension. The foam fractal dimension monotonically changes with foam volume, liquid volume and liquid fraction, obtaining a linear correlation over a certain range. In particular, an increase in the fractal dimension leads to a decrease in the foam volume and to an increase in the liquid volume, while the liquid fraction approaches 0 as the foam fractal dimension increases.
In fact, a larger fractal dimension corresponds to coarser foam, which is formed through longer time for drainage. Meanwhile, the longer the drainage time, the greater the liquid volume. Thus, a larger fractal dimension corresponds to greater liquid volume (Fig. 17). Furthermore, the more liquid volume drained from the foam, the less liquid in the foam (liquid fraction), so a larger fractal dimension corresponds to a smaller liquid fraction (Fig. 18). Moreover, a smaller liquid fraction means a more dry foam, which causes there to be less surfactant in the lamella. Then, the foam becomes more unstable and the foam volume will decrease with more coalescence and a rupture of the foam (Fig. 16).
As a result, it is possible to replace conventional foam evaluation criteria by using the foam fractal dimension to evaluate foam properties.
3.2 Prediction of foam structure
The foam structure evolution model can also be employed to predict the structure of foam. Eqn (2.3) demonstrates the possibility of predicting the evolution of foam structure as a function of time. To account for multiple parameters which can influence the structure, we can extend this equation by introducing a parameter vector![[small alpha, Greek, vector]](https://www.rsc.org/images/entities/i_char_e118.gif) and expressing the time evolution of the foam fractal dimension through the following equation.
and expressing the time evolution of the foam fractal dimension through the following equation.
Df = A(![[small alpha, Greek, vector]](https://www.rsc.org/images/entities/i_char_e118.gif) ) + B( ) + B(![[small alpha, Greek, vector]](https://www.rsc.org/images/entities/i_char_e118.gif) )(1 − e−k( )(1 − e−k(![[small alpha, Greek, vector]](https://www.rsc.org/images/entities/i_char_e118.gif) )t), )t), ![[small alpha, Greek, vector]](https://www.rsc.org/images/entities/i_char_e118.gif) = (x1, x2, x3, …) = (x1, x2, x3, …)
| (3.1) |
![[small alpha, Greek, vector]](https://www.rsc.org/images/entities/i_char_e118.gif) is a vector containing the parameters which affect the foam structure, such as temperature and concentration, which have been analyzed above.
is a vector containing the parameters which affect the foam structure, such as temperature and concentration, which have been analyzed above.
By using this equation, we can obtain the distribution of foam structure upon foam coalescence and rupture, and the rate of these processes can also be evaluated. The coefficients A, B and k can be determined experimentally, and the appropriate parameters should be inserted in the vector ![[small alpha, Greek, vector]](https://www.rsc.org/images/entities/i_char_e118.gif) . Using this method, the relationship between foam fractal dimension and time can eventually be determined. Therefore, once the parameters of the foam and the environment are given, the structure of the foam may be predicted at any time.
. Using this method, the relationship between foam fractal dimension and time can eventually be determined. Therefore, once the parameters of the foam and the environment are given, the structure of the foam may be predicted at any time.
4 Conclusions
(1) In this work, we demonstrated that foam fluids have fractal characteristics, exhibiting a box-counting fractal dimension ranging from 1 to 2 based on 2-dimensional images. The fractal dimension of the foam increases gradually upon coalescence.(2) A structure evolution model based on fractal theory was established for foam structure. The model shows that the fractal dimensions of aqueous foam correlate non-linearly with the changing of time and follow an exponential equation. Two factors affecting the foam structure, namely temperature and concentration, were separately analyzed using this model. The results show that a higher temperature leads to faster evolution of foam structure, whereas a greater concentration of foaming agent leads to a longer effective time of stability for the foam.
(3) The fractal dimensions change monotonically with foam volume, liquid volume and liquid fraction. As a result, a new foam structure evaluation method was determined based on the fractal dimensions of foam.
(4) The foam structure evolution model can be used to predict foam structure under different conditions, and can further be extended to simulate foam fluids in porous media.
Acknowledgements
This work was financially supported by the National Natural Science Foundation of China (51274228) and the Fundamental Research Funds for the Central Universities (15CX06032A). We sincerely thank other people in the Foam Research Center in the China University of Petroleum (East China) for helping with the experimental research.References
- Z. L. Li and W. D. Qian, Survey on the application of foam fluid in China oil field, Drill. Fluid Completion Fluid, 1994, 11(1), 1–5 Search PubMed.
- W. R. Rossen and M. W. Wang, Modeling Foams for Acid Diversion, SPE J., 1999, 4, 92–100 CrossRef.
- D. K. Kennedy, F. W. Kitziger and B. E. Hall, Case study on the effectiveness of nitrogen foams and water-zone diverting agents in multistage matrix acid treatments, SPE Prod. Eng., 1992, 7(2), 203–211 CrossRef CAS.
- S. Li, Z. Li and R. Lin, et al., Research and Application of Mathematical Model for Foam Diversion Acidizing, SPE Western Regional and Pacific Section AAPG Joint Meeting, Society of Petroleum Engineers, 2008 Search PubMed.
- Q. Sun, Z. Li and S. Li, et al., Utilization of surfactant-stabilized foam for enhanced oil recovery by adding nanoparticles, Energy Fuels, 2014, 28(4), 2384–2394 CrossRef CAS.
- Q. Sun, Z. Li and J. Wang, et al., Aqueous foam stabilized by partially hydrophobic nanoparticles in the presence of surfactant, Colloids Surf., A, 2015, 471, 54–64 CrossRef CAS.
- Q. Sun, Z. Li and J. Wang, et al., Properties of multi-phase foam and its flow behavior in porous media, RSC Adv., 2015, 5(83), 67676–67689 RSC.
- P. M. Kruglyakov, S. I. Karakashev, A. V. Nguyenb and N. G. Vilkovaa, Foam drainage, Curr. Opin. Colloid Interface Sci., 2008, 13(3), 163–170 CrossRef CAS.
- M. M. Hashem, et al., Foaming Agent, US Pat., 4524002, 1985, vol. 7, p. 18.
- ASTM, D 1173–53(80), ASTM Committee, Apr., 1985.
- R. I. Saye and J. A. Sethian, Multiscale modeling of membrane rearrangement, drainage and rupture in evolving foams, Science, 2013, 340(6133), 720–724 CrossRef CAS PubMed.
- J. Hou, Q. Du and Z. Li, et al., Experiments on foam texture under high pressure in porous media, Flow Meas. Instrum., 2013, 33, 68–76 CrossRef.
- Z. Li, W. R. Rossen and Q. P. Nguyen, Three-Dimensional Modeling of Tracer Experiments to Determine Gas Trapping in Foam in Porous Media, Energy Fuels, 2010, 24, 3239–3250 CrossRef CAS.
- K. Ma, J. L. Lopez-Salinas and M. C. Puerto, et al., Estimation of Parameters for the Simulation of Foam Flow through Porous Media. Part 1: The Dry-Out Effect, Energy Fuels, 2013, 27, 2363–2375 CrossRef CAS.
- C. U. Ikoku and H. J. Ramey, Flow of Foam in Porous Media, Soc. Pet. Eng., 1978, SPE-7192 Search PubMed.
- C. H. Marfoe and H. Kazemi, Numerical Simulation of Foam Flow in Porous Media, SPE Annual Technical Conference and Exhibition, Society of Petroleum Engineers, 1987 Search PubMed.
- A. H. Falls, G. J. Hirasakl and T. W. Patzek, et al., Development of a Mechanistic Foam Simulator: The Population Balance and Generation by Snap-Off, SPE Reservoir Eng., 1988, 3(3), 884–892 CrossRef CAS.
- A. W. Fisher and R. W. S. Foulser, Mathematical Modeling of Foam Flooding, SPE/DOE Enhanced Oil Recovery Symposium, Society of Petroleum Engineers, 1990 Search PubMed.
- S. I. Chou, Percolation Theory of Foam in Porous Media, SPE/DOE Enhanced Oil Recovery Symposium, Society of Petroleum Engineers, 1990 Search PubMed.
- F. Friedmann, W. H. Chem and P. A. Gauglltz, Experimental and Simulation Study of High-Temperature Foam Displacement in Porous Media, SPE Reservoir Eng., 1991, 6(1), 37–45 CrossRef CAS.
- A. R. Kovscek, T. W. Patzek and C. J. Radke, Simulation of Foam Transport in Porous Media, SPE Annual Technical Conference and Exhibition, Society of Petroleum Engineers, 1993 Search PubMed.
- A. R. Kovscek, T. W. Patzek and C. J. Radke, A Mechanistic Population Balance Model for Transient and Steady-State Foam Flow in Boise Sandstone, Chem. Eng. Sci., 1995, 23, 3783–3799 CrossRef.
- W. R. Rossen, S. C. Zeilinger and J. Shi, et al., Simplified Mechanistic Simulation of Foam Processes in Porous Media, SPE J., 1999, 4(3), 279–287 CrossRef.
- W. R. Rossen and Z. H. Zhou, Modeling Foam Mobility at the “Limiting Capillary Pressure”, SPE adv. Technol., 1995, 3(1), 146–153 CrossRef.
- Z. H. Zhou and W. R. Rossen, Applying Fractional-Flow Theory to Foam Processes at the “Limiting Capillary Pressure”, SPE Advanced Technology Series, 1995, 3(01), 154–162 CrossRef.
- Z. H. Zhou and W. R. Rossen, Applying Fractional-Flow Theory to Foams for Diversion in Matrix Acidization, SPE Prod. Facil., 1994, 9(01), 29–35 CrossRef CAS.
- J. A. Robert and M. G. Mack, Foam Diversion Modeling and Simulation, SPE Prod. Facil., 1997, 12(02), 123–128 CrossRef CAS.
- A. R. Kovscek, T. W. Patzek and C. J. Radke, Mechanistic Foam Flow Simulation in Heterogeneous and Multidimensional Porous Media, SPE J., 1997, 2(04), 511–526 CrossRef.
- J. X. Shi and W. R. Rossen, Simulation of Gravity Override in Foam Processes in Porous Media, SPE Reservoir Eval. Eng., 1998, 1(2), 148–154 CrossRef CAS.
- H. J. Bertin, M. Y. Quintard and L. M. Castanier, Development of a Bubble-Population Correlation for Foam-Flow Modeling in Porous Media, SPE J., 1998, 3(04), 356–362 CrossRef.
- L. Cheng, A. B. Reme, D. Shan, et al., Simulating Foam Processes at High and Low Foam Qualities, SPE/DOE Improved Oil Recovery Symposium, Society of Petroleum Engineers, 2000 Search PubMed.
- L. Cheng, S. I. Kam, M. Delshad, et al., Simulation of Dynamic Foam-Acid Diversion Processes, SPE European Formation Damage Conference, Society of Petroleum Engineers, 2001 Search PubMed.
- L. Cheng, S. I. Kam and M. Delshad, et al., Simulation of Dynamic Foam-Acid Diversion Processes, SPE J., 2002, 7(03), 316–324 CrossRef CAS.
- P. J. Zitha, Foam Drainage in Porous Media, Transp. Porous Media, 2003, 52, 1–16 CrossRef.
- S. I. Kam and W. R. Rossen, A Model for Foam Generation in Homogeneous Media, SPE J., 2003, 8(04), 417–425 CrossRef.
- S. I. Kam, Q. P. Nguyen and Q. Li, et al., Dynamic Simulations with an Improved Model for Foam Generation, SPE J., 2007, 12(01), 35–48 CrossRef CAS.
- P. A. Gauglitz, F. Friedmann and S. I. Kam, et al., Foam generation in homogeneous porous media, Chem. Eng. Sci., 2002, 57, 4037–4052 CrossRef CAS.
- Z. F. Dholkawala, H. K. Sarma and S. I. Kam, Application of fractional flow theory to foams in porous media, J. Pet. Sci. Eng., 2007, 57, 152–165 CrossRef CAS.
- Q. Chen, M. G. Gerritsen and A. R. Kovscek, Modeling Foam Displacement with the Local-Equilibrium Approximation: Theory and Experimental Verification, SPE J., 2010, 15(01), 171–183 CrossRef.
- R. Farajzadeh, B. M. Wassing and P. M. Boerrigte, Foam assisted gas–oil graity drainage in naturally-fractured reservoirs, J. Pet. Sci. Eng., 2012, 94–95, 112–122 CrossRef CAS.
- E. Ashoori, D. Marchesin and W. R. Rossen, Dynamic foam behavior in the entrance region of a porous medium, Colloids Surf., A, 2011, 377, 217–227 CrossRef CAS.
- H. O. Balan, M. T. Balhoff and Q. P. Nguyen, et al., Network Modeling of Gas Trapping and Mobility in Foam Enhanced Oil Recovery, Energy Fuels, 2011, 25, 3974–3987 CrossRef CAS.
- A. R. Edrisi and S. I. Kam, A New Foam Model in Pipes for Drilling and Fracturing Applications, SPE J., 2014, 19(04), 576–585 CrossRef.
- K. Ma, G. Ren and K. Mateen, et al., Modeling Techniques for Foam Flow in Porous Media, SPE J., 2015, 20(03), 453–470 CrossRef CAS.
- B. B. Mandelbrot, How long is the coast of Britain? Statistical self-similarity and fractional dimension, Science, 1967, 156, 636–638 CAS.
- B. B. Mandelbrot, Self-Affine Fractals and Fractal Dimension, Phys. Scr., 2006, 32(4), 257–260 CrossRef.
- N. Sarkar and B. B. Chaudhuri, An efficient differential box-counting approach to compute fractal dimension of image, IEEE Trans. Syst. Man Cybern., 1994, 24(1), 115–120 CrossRef.
| This journal is © The Royal Society of Chemistry 2017 |

