 Open Access Article
Creative Commons Attribution 3.0 Unported Licence
‘Aggregation induced emission’ active iridium(III) complexes with applications in mitochondrial staining†
Parvej Alama,
Subhra Dashb,
Claudia Climentc,
Gurpreet Kaurd,
Angshuman Roy Choudhuryd,
David Casanovae,
Pere Alemanyc,
Rajdeep Chowdhury*b and
Inamur Rahaman Laskar*a
aDepartment of Chemistry, Birla Institute of Technology and Science, Pilani Campus, Pilani, Rajasthan, India. E-mail: ir_laskar@bits-pilani.ac.in
bDepartment of Biology, Birla Institute of Technology and Science, Pilani Campus, Pilani, Rajasthan, India. E-mail: rajdeep.chowdhury@pilani.bits-pilani.ac.in
cDepartament de Ciència de Materials i Química Física and Institut de Química Teòrica i Computacional (IQTCUB), Universitat de Barcelona, Martí i Franquès 1-11, Barcelona 08028, Spain. E-mail: p.alemany@ub.edu
dDepartment of Chemical Sciences, Indian Institute of Science Education and Research (IISER), Sector 81, S. A. S. Nagar, Manauli PO, Mohali, Punjab 140306, India. E-mail: angshurc@iisermohali.ac.in
eKimika Fakultatea, Euskal Herriko Unibertsitatea (UPV/EHU), Donostia International Physics Center, Paseo Manuel de Lardiazabal, 4, Donostia 20018, Euskadi, Spain
First published on 17th January 2017
Abstract
Two new bis-cyclometalated iridium(III) complexes, [Ir(F2ppy)2(L)] and [Ir(ppy)2(L)], where F2ppy = 2-(2′,4′-difluoro)phenylpyridine, ppy = 2-phenylpyridine and L = 1,2-((pyridin-2-ylimino)methyl)phenol, have been designed and synthesized by a convenient route. We have univocally characterized their structure by 1H NMR, 19F NMR, HRMS and SXRD. Both complexes exhibit strong ‘Aggregation Induced Emission (AIE)’ activity, which has been investigated using spectroscopy measurements, ab initio quantum chemical calculations and by analysing their crystal packing. One of the complexes has been shown to have a potential application as a non-toxic bio-imaging probe for mitochondrial staining.
Introduction
Mitochondria, the power houses of cells, are eminent for energy production and apoptosis regulation.1,2 The organelles found in all eukaryotic organisms are the central hub for many other processes such as lipid modification, redox balance, calcium balance, cellular differentiation, the cell cycle, and innate immunity. In addition, reactive oxygen species (ROS) such as peroxides, the superoxide anion, the hydroxyl radical or singlet oxygen are important cellular signaling species produced by mitochondria.3,4 These ROS are also associated with several human diseases such as osteoporosis,5 Alzheimer disease,6 bowel disease7 or cardiovascular diseases.8 According to the recent studies, the morphological change in mitochondria can be affected by the protein involved in apoptosis.9–13 Hence, the specific imaging of mitochondria has a great importance in the biomedical field. The usual dyes employed for mitochondria imaging are rhodamine 123, Janus green B, Mito Tracker® and Green FM (MTG).14 Unfortunately, all these dyes suffer from a poor photostability, small Stokes shifts, short fluorescence lifetimes and the accompanying concentration-quenching effect. All these facts boosted the search for efficient solid emitters that could alleviate all these problems for such an application.Solid state luminescent materials have attracted a great deal of attention from the scientific community because of their many practical applications. Unfortunately, the majority of known luminescent materials are highly emissive in solution while becoming much less emissive or non emissive at all in solid state. This is a quite common effect observed for many luminescent molecules that has been termed ‘Aggregation Caused Quenching (ACQ)’15 in the literature and has been a great obstacle that has greatly limited the development of solid state applications for many luminophores. In 2001, Tang and co-workers discovered a material that exhibited exactly the contrary behavior: while it was highly emissive in the solid state it showed no fluorescent emission at all when dissolved in common organic solvents.16 This fantastic effect was termed ‘Aggregation Induced Emission (AIE)’, and it was immediately recognized that it could open the door to a brand new platform for efficient solid state emitters. Worldwide many researchers have been working enthusiastically on the design and synthesis of new AIE materials and their applications.17–19 In spite of all these efforts, the mechanism behind AIE is only partially understood and a vivid debate is still ongoing in the literature. The field has been recently reviewed by Tang and co-workers.20 Probably, the most accepted mechanism for AIE is the restriction of internal motion (RIM) and particularly the restriction of internal rotations.21 Although this mechanism has found to explain the AIE effect in many cases, it has been shown that it cannot explain the emergence of AIE for all known AIE-active molecules and alternative, more specific mechanisms have been proposed in some cases. Apart from RIM, the appearance of AIE is sometimes explained based on the transition to an intramolecular charge transfer (ICT)22 or twisted intramolecular charge transfer (TICT)23 state, a cis–trans isomerisation,24 molecular planarization,25 or the formation of J-type aggregates.20,26–31
Besides the development of new organic AIE materials and their applications, the last decade has been dedicated to the development of efficient solid state emitting materials, especially heavy metal complexes20,32,33 showing phosphorescence instead of fluorescence. Among those heavy metal luminescent compounds, Ir(III) complexes are renowned for their potential applications in the fields of organic light-emitting diodes (OLEDs),34,35 bioimaging,36,37 chemosensors38,39 and vapoluminescent40 materials because of their superior photophysical properties, long luminescence lifetimes (100 ns to ms), high quantum yields and large Stokes shifts (hundreds of nm).41 Recently, our group has developed a variety of AIE active iridium(III) based metal complexes.42–45 Despite all this efforts, the overall development of efficient solid state emitting iridium(III) complexes is still limited and much more work is needed in this direction.
In this report, we have synthesized two new AIE active Ir(III) based complexes (1 and 2), which belong to the same family of compounds synthesized by Li et al.46,47 and by S. Y. Park and co-workers.48 Complex 2 has been used for specific mitochondrial imaging and the MTT cytotoxicity study has been carried out.
Experimental section
Characterization
1H NMR and 19F NMR spectra were recorded in a 400 MHz Brucker spectrometer using CDCl3 as solvent and tetramethylsilane (TMS, δ = 0 for 1H and 13C NMR) as internal standard. UV-vis absorption spectra were recorded in a Shimadzu Spectrophotometer (model UV-1800). The emission spectra were recorded in a Horiba Jobin Yvon (Fluoro Max-4) Spectrofluorometer. Quantum efficiency (QE) in solution was measured with respect to coumarin 153 (in degassed ethanol, QE = 0.38, excitation; 420 nm). The solid state quantum yield for the film samples was measured using a calibrated integrating sphere in a Gemini Spectrophotometer (model Gemini 180). Particle sizes of the nano-aggregates were determined on a Malvern Zetasizer (MAL1040152).Materials and method
Iridium(III) chloride hydrate and 2-ethoxyethanol were purchased from the Sigma Aldrich Chemical Company Ltd. The 2-(2,4-difluorophenyl)pyridine (F2ppy) and the bridged complexes ([Ir(ppy)2(μ-Cl]2 and [Ir(F2ppy)2(μ-Cl]2) were prepared according to the procedure reported in the literature.45 The ligand (L), 2-((pyridin-2-ylimino)methyl)phenol was synthesized as indicated in ref. 21. The UV-vis grade solvents (DCM, hexane, ethyl acetate) were procured from Merck Company.Computational details
Electronic structure calculations have been performed within the density functional theory (DFT) framework with the B3LYP energy functional,49 a basis set of double-ζ quality (LANL2DZ) and the effective core potential of Hay and Wadt for iridium, while the standard 6-31G(d) basis set was used for the rest of atoms in the complex.50–52 All calculations have been done with the Gaussian program.53General syntheses of [Ir(F2ppy)2L], 1 and [Ir(ppy)2L], 2
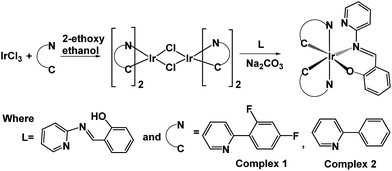
In a two-necked round bottom flask (50 mL), 2-((pyridin-2-ylimino)methyl)phenol [L] (0.261 mmol), [Ir(F2ppy)2(μ-Cl)]2 (or [Ir(ppy)2(μ-Cl)]2 (0.087 mmol), and Na2CO3 (0.261 mmol) were mixed in 10 mL of 2-ethoxy ethanol. The mixture was heated at 135 °C for 3 hours under an atmosphere of N2 gas. The solution mixture was evaporated to dryness and the residue purified by column chromatography using MeOH–DCM–hexane (10![[thin space (1/6-em)]](https://www.rsc.org/images/entities/char_2009.gif) :
:![[thin space (1/6-em)]](https://www.rsc.org/images/entities/char_2009.gif) 90) as the eluent, getting a yellow/red solid product (Scheme 1).
90) as the eluent, getting a yellow/red solid product (Scheme 1).
ESI-HRMS calculated: C34H22F4IrN4O ([M + H]+): m/z, 771.1359, found; ([M + H]+): m/z, 771.1331, pale yellow solid; yield, 65.00% (Fig. S2†).
Fabrication of thin-films on substrate for PL measurements
A 10−3 M solution of each of the complexes (in THF) was prepared. 2–3 drops of these solutions were placed on thin glass substrates (2 × 2 cm2). The solvent was allowed to evaporate slowly.X-ray single crystal diffraction study
Single crystal X-ray diffraction data for 2 was recorded on a Bruker AXS KAPPA APEX-II CCD and a Rigaku54 Mercury 375/M CD (XtaLAB mini) diffractometer respectively by using graphite Monochromated Mo-Kα radiation at 100.0(1) K with an Oxford cryosystem. The data sets collected on Bruker AXS KAPPA APEX-II Kappa were collected using Bruker APEX-II suite, data reduction and integration were performed by SAINT V7.685A12 (Bruker AXS, 2009) and absorption corrections and scaling was done using SADABS V2008/112 (Bruker AXS). The data sets, which were collected on XtaLAB mini diffractometer, were processed with Rigaku Crystal Clear suite 2.0. The crystal structures were solved by using SHELXS2013 (ref. 55) and were refined using SHELXL2013 available within Olex2.56 All the hydrogen atoms have been geometrically fixed and refined using the riding model except the hydride anion, co-ordinating the iridium(III) atom, which has been located from the difference Fourier map and refined isotropically. All the diagrams have been generated using Mercury 3.1.1.57 Geometric calculations have been done using PARST.58MTT assay
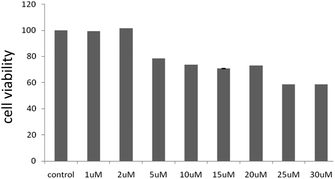
For determining the in vitro cytotoxicity, HOS cells (obtained from NCCS Pune) cultured in minimum essential media (Hi media, # 41500-067) containing 10% FBS (Invitrogen, #26140-079) and 1% penicillin-streptomycin mixture (Invitrogen, # 10378-016) were grown in log phase. Cells were then seeded at a density of 4000 cells per well in 96 well plate and incubated overnight with 5% CO2 at 37 °C. The next day 2 was added at concentrations – 1 μM, 2 μM, 5 μM, 10 μM, 15 μM, 20 μM, 25 μM, 30 μM (in triplicates) diluted with DMSO (SDFCL, # 20323 L05) for 24 h with respective control where no compound was added. Following treatment, MTT (Stock concentration 5 mg mL−1) (MTT: Sigma, #M5655) 20 μL was added and incubated for 4 h post which formazan crystals were solubilized using DMSO and readings were obtained at 495 nm with a differential filter at 690 nm using an enzyme-linked immune-sorbent assay (ELISA) micro-plate reader (Start-fax 2100).Percentage of viable cells was calculated using the following formula:
| Viability (%) = (mean absorbance value of drug treated cells)/(mean absorbance value of control) × 100 |
Cell imaging
For the bio-imaging experiment, HOS cells were seeded at a density of 2 × 10⁴ per cover slip and incubated with 5% CO2 at 37 °C for 24 h. Following incubation, 2 dissolved in DMSO (25 μM) was added to the cells grown on a coverslip and kept inside the incubator for another 24 h. Cells were then fixed in chilled methanol for 10 min at −20 °C, counter stained with DAPI (0.2 μg mL−1, Sigma), and incubated for 10 min followed by three PBS washes. Coverslips were then mounted with glycerol on glass slide and observed at 100× under a fluorescence microscope (OLYMPUS, U-25ND25).To study the organelle specific localization of 2, mitochondrial staining was done. Cells grown in a coverslip which were pre-treated as above with 2 for 24 hours. Mito Tracker (RedFM, Invitrogen # M22425) was added at a concentration of 300 nM μL−1 in serum free media and incubated at 37 °C for 30 min followed by three PBS washes. Cells were then fixed in 4% paraformaldehyde (in PBS) and incubated at 37 °C for 15 minutes. Following fixation cells were washed several times with PBS followed by glycerol mounting and observation under fluorescence microscope.
Measurement of ROS generation
The generation of ROS was measured using the cell-permeable fluorescent dye 2′-7'-dichlorofluorescein-diacetate (H2DCFDA) (Sigma-Aldrich, USA), a non-fluorescent compound, which is converted into highly fluorescent dichloro-fluorescein (DCF) by cellular peroxides. Briefly, HOS cells were exposed to the 2 for the indicated times and then were loaded with H2DCFDA (20 μM) dissolved in PBS. Following incubation at 37 °C for 1 h, the cells were washed with PBS and fluorescence was monitored with a fluorimeter (Fluroskan Asent, Thermo Scientific) at an excitation wavelength of 485 nm and emission wavelength of 530 nm. The fluorescence emitted by untreated cells loaded with DCF-DA was taken as a control and the treated values were plotted accordingly.Results and discussion
Complexes 1 and 2 were characterized by 1H NMR, HRMS and SXRD. The 1H signal of the imine C–H group shifts to δ = 8.28 ppm and 8.34 ppm for 1 and 2, respectively, with respect to the signal obtained for the pristine ligand 2-((pyridin-2-ylimino)methyl)phenol (δ = 9.46 ppm). The 19F NMR shows four doublet signals in between −108.67 < δ < −111.77 ppm because of F–F coupling. The HRMS spectrum exhibits major fragments as [M + H]+ at m/z 771.1331 and 699.2612 for 1 and 2, respectively. Furthermore, complex 2 has been authenticated by SXRD (Fig. 1).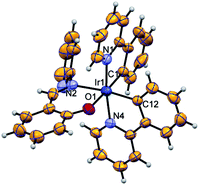 | ||
| Fig. 1 ORTEP diagram of structure 2 drawn using 50% probability ellipsoid, showing the octahedral coordination geometry for iridium(III). | ||
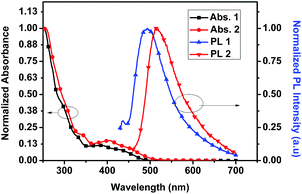
Photophysical properties in solution
The UV-vis absorption spectra of 1 and 2 were recorded in degassed DCM. Absorbance profiles show an intense absorption band at ca. 270–310 nm that our electronic structure calculations assign to ligand-centered (LC) and charge transfer (CT) transitions involving ppy and Schiff base (SB) ligands, moderate bands at 330–450 nm corresponding to 1MLCT (d(Ir) → π*(ppy or SB)), 1MLLCT (d(Ir) + π(SB) → π*(ppy)) and 1MLCT/LC states (d(Ir) + π(SB) → π*(SB)) and a less intense tailing band beyond 450 nm that can be attributed to spin-forbidden transitions of mainly 3MLCT character (Fig. 2). Similar absorption spectra were observed in different organic solvents (Fig. S5†). However, the solid state absorption spectra of both the complexes showed a broad absorbance band in the visible range (400–520 nm) (Fig. S4†). These complexes are almost non emissive under excitation at 365 nm in organic solvents at ambient temperature. The recorded phosphorescent emission spectra of 1 in degassed DCM showed an emission with λmax = 495 nm, while 2 exhibited a λmax at 515 nm at room temperature.DFT based calculations indicate that the lowest emissive triplet state of complexes 1 and 2 can be described as the single electron occupation of the ground state HOMO, obtained as a combination of a d-orbital on the iridium atom and π-orbital of the Schiff base (L) ligand, and the LUMO+1, corresponding to a π* orbital centered on the L ligand (Fig. 3). Therefore, the phosphorescent states of 1 and 2 can be qualitatively described as mixed metal-to-ligand charge transfer and ligand centered (3MLCT/3LC).
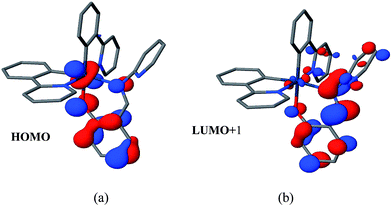 | ||
| Fig. 3 (a) HOMO and (b) LUMO+1 of complex 2 corresponding to the molecular orbitals bearing the unpaired electrons in the lowest triplet state. | ||
Further, the emission spectra of complex 2 did not show an obvious change in presence of different organic solvents. These facts suggest that the lowest excited state of 2 is of predominantly LC character along with a lesser contribution from MLCT states (Fig. S6†).
Aggregation induced emission
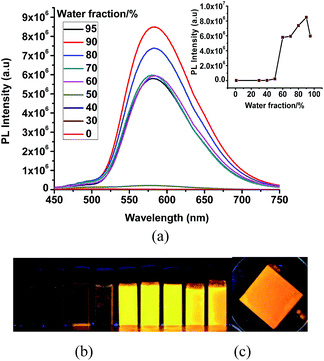
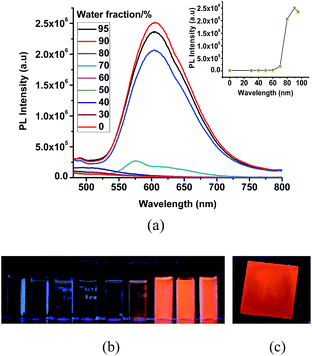
The very weak emission intensities observed for complexes 1 and 2 in common organic solvents increase significantly upon aggregation. The solid state emission spectra of 1 and 2 show a red shifted emission with respect to the emission band recorded in solution and found at 600 nm and 610 nm, respectively (Fig. S7†). The AIE effect for these complexes is investigated using solvent mixtures with different fractions of water (fw) and methanol. The maximum PL intensity for 1 and 2 is recorded at fw = 90, which is ∼125 and ∼950 times higher than for pure methanol solutions, respectively. The observed PL maxima of 1 at 495 nm in methanol shifts to 581 nm at fw = 95% (Fig. 4), while the maximum emission of 2 was found at 515 nm in methanol and at 605 nm for fw = 95% (Fig. 5). The large red shifted emission in aggregated or solid state in comparison to solution state may be attributed to π–π stacking in adjacent phenyl pyridine rings (Fig. 6b).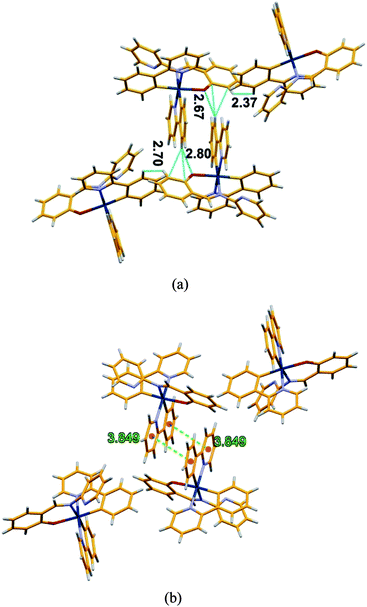 | ||
| Fig. 6 (a) Packing diagram of 2 showing the different short contacts (b) packing diagram of 2 showing π–π stacking interaction between aromatics ring. | ||
In order to get some insight into the weak interactions that are present in the aggregated state we used the crystal structure of 2 as a qualitative reference. Analyzing the crystal packing in crystals of 2 different types of short contacts (C–H⋯π and C–H⋯N) in the range of 2.37–2.80 Å, are evident. The causes of AIE in bis cyclometalated iridium(III) salicylaldimine complexes has been controversial46,47 but a recent paper59 has clarified the mechanism involving restriction of a tilting motion of the salicylimine ligand in the aggregated state. An additional π–π interaction between two fused aromatic rings is also observed at a distance of 3.85 Å between ring centroids (Fig. 6). The presence of all these interactions enforce molecular rigidity in the solid state, enhancing the efficiency of RIM processes blocking the non radiative deactivation of the emitting state with the overall result of a strong emission in solid and aggregated states. The sizes of nanoaggregates for 1 and 2 at fw = 90% have been measured by dynamic light scattering (DLS) and the results indicate the formation of particles in the range of 350–395 nm and 410–476 nm, respectively (Fig. S8†). The aggregate formation was further supported by absorption spectra recorded in different water fraction (fw) resulted a level-off tail (at fw = 90%) in the longer wavelength region (400–650 nm) (Fig. S9†). However, the recorded excitation spectra at different fw showed major peak in the range of 350–370 nm (Fig. S10†).
The absolute PL quantum yields for 1 and 2 have been found to be 6.39% and 6.03%, which are almost ∼60 times and ∼35 times higher than in solution, respectively. These observations support the remarkable AIE nature of these complexes.
Effect of iridium complex on cell viability of osteosarcoma cells
HOS cells were treated (detail treatment was described in materials and methods) with 2 for 24 h and then the cell viability was determined. As shown in Fig. 7, 2 inhibited the cell viability of HOS cell line in a dose-dependent manner. The IC50 of the compound was found to be around 25 μM. The compound showed cytotoxicity only at higher concentrations. In association to the reduced cytotoxicity shown by these compounds, we did not observe a significant increase in reactive oxygen species levels upon exposure of the cells with the compound (data not shown). It is worth mentioning here that many anti-cancer agents induce apoptosis mediated cell death in cancer cells by an increase in cellular ROS levels.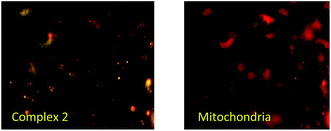 | ||
| Fig. 7 Bio-imaging of HOS cells after 24 h incubation with complex 2 then counter stained with Mito Tracker to check the localization of compound, magnification 100×. Scale bar (5 μm). | ||
This provided us with the hint that these compounds can be effectively used for bio-imaging purposes. Hence, this complex was successfully applied in bio-imaging. The complex 2 was successfully internalized by the cells and being an AIE compound, the complex following incubation with cancer cells exhibited good fluorescence inside the cells depicting high cell membrane permeability and AIE properties (Fig. 7). The compound though entered the cells, but was not able to enter the nucleus. We were therefore interested in knowing the probable sub-cellular localization of the aggregated compound. A mitochondrial staining with commercially available fluorescent dye, Mito Tracker showed co-localization of the AIE-induced fluorescence and mitochondrial dye emitted fluorescence (Fig. 7). Due to its comparatively low cytotoxicity (Fig. 8), cellular internalization property and enhanced AIE characteristics this compound can be a potential bio-imaging agent. Future studies directed towards functionalization of this compound with specifically cancer cell targeting moieties, like folic acid can have huge impact on cancer diagnostics and treatment.
Conclusions
We have reported the synthesis and characterization of two new AIE active iridium(III) complexes with using a simple Schiff base type supporting ligand. From the mechanistic point of view, the AIE effect is suggested to originate from restriction of internal motion (RIM) consistent with previous studies.59 Finally, complex 2 has been successfully employed as a bioimaging probe, which selectively stain the mitochondria.Acknowledgements
We thank the ‘Department of Science and Technology (DST)’ and ‘Council of Scientific and Industrial Research (CSIR)’, Govt. of India to support this work financially under the following projects with project numbers, SB/S1/IC-13/2014 and 01/2551/12/EMR-II, respectively. The ‘UGC-SAP’ and DST-FIST program for the chemistry department has been acknowledged for instrumental support. This work has also been supported by the Basque Government (project IT588-13) and the Spanish Government (project CTQ2015-64579-C3-3-P). D. C. thanks IKERBASQUE, Basque Foundation for Science, for financial support. C. C. is indebted to the Spanish ‘Ministerio de Economía y Competitividad’ for a predoctoral FPI grant.Notes and references
- Y. Chen, L. Qiao, B. Yu, G. Li, C. Liu, L. Ji and H. Chao, Chem. Commun., 2013, 49, 11095–11097 RSC.
- B. Wang, Y. Liang, H. Dong, T. Tan, B. Zhan, J. Cheng, K. K.-W. Lo, Y. W. Lam and S. H. Cheng, ChemBioChem, 2012, 13, 2729–2737 CrossRef CAS PubMed.
- Y. You, Curr. Opin. Chem. Biol., 2013, 17, 699–707 CrossRef CAS PubMed.
- Q. Zhao, C. Huang and F. Li, Chem. Soc. Rev., 2011, 40, 2508–2524 RSC.
- J. A. Kanis, D. Black, C. Cooper, P. Dargent, B. Dawson-Hughes, C. D. Laet, P. Delmas, J. Eisman, O. Johnell, B. Jonsson, L. Melton, A. Oden, S. Papapoulos, H. Pols, R. Rizzoli, A. Silman and A. Tenenhouse, Osteoporosis Int., 2002, 13, 527–536 CrossRef CAS PubMed.
- W. J. Strittmatter, A. M. Saunders, D. Schmechel, M. Pericak-Vance, J. Enghild, G. S. Salvesen and A. D. Roses, Proc. Natl. Acad. Sci. U. S. A., 1993, 90, 1977–1981 CrossRef CAS.
- E. V. Loftus Jr, Gastroenterology, 2004, 126, 1504–1517 CrossRef.
- H. Cai and D. G. Harrison, Circ. Res., 2000, 87, 840–844 CrossRef CAS PubMed.
- K. K.-W. Lo, A. W.-T. Choi and W. H.-T. Law, Dalton Trans., 2012, 41, 6021–6047 RSC.
- Y. Li, C.-P. Tan, W. Zhang, L. He, L.-N. Ji and Z.-W. Mao, Biomaterials, 2015, 39, 95–104 CrossRef CAS PubMed.
- P. K. Sasmal, C. N. Streu and E. Meggers, Chem. Commun., 2013, 49, 1581–1587 RSC.
- S. P.-Y. Li, C. T.-S. Lau, M.-W. Louie, Y.-W. Lam, S. H. Cheng and K. K.-W. Lo, Biomaterials, 2013, 34, 7519–7532 CrossRef CAS PubMed.
- R. Cao, J. Jia, X. Ma, M. Zhou and H. Fei, J. Med. Chem., 2013, 56, 3636–3644 CrossRef CAS PubMed.
- W. Pendergrass, N. Wolf and M. Poot, Cytometry, Part A, 2004, 61, 162–169 CrossRef CAS PubMed.
- G. V. Bünau, Ber. Bunsen-Ges. Phys. Chem., 1970, 74, 1294–1295 Search PubMed.
- J. Luo, Z. Xie, J. W. Y. Lam, L. Cheng, H. Chen, C. Qiu, H. S. Kwok, X. Zhan, Y. Liu, D. Zhu and B. Z. Tang, Chem. Commun., 2001, 1740–1741, 10.1039/b105159h.
- Z. Zhao, B. He and B. Z. Tang, Chem. Sci., 2015, 6, 5347–5365 RSC.
- H. Wang, E. Zhao, J. W. Y. Lam and B. Z. Tang, Mater. Today, 2015, 18, 365–377 CrossRef CAS.
- Y. Hong, J. W. Y. Lam and B. Z. Tang, Chem. Commun., 2009, 4332–4353, 10.1039/b904665h.
- J. Mei, N. L. C. Leung, R. T. K. Kwok, J. W. Y. Lam and B. Z. Tang, Chem. Rev., 2015, 115, 11718–11940 CrossRef CAS PubMed.
- P. Alam, V. Kachwal and I. R. Laskar, Sens. Actuators, B, 2016, 228, 539–550 CrossRef CAS.
- W. Z. Yuan, Y. Gong, S. Chen, X. Y. Shen, J. W. Y. Lam, P. Lu, Y. Lu, Z. Wang, R. Hu, N. Xie, H. S. Kwok, Y. Zhang, J. Z. Sun and B. Z. Tang, Chem. Mater., 2012, 24, 1518–1528 CrossRef CAS.
- E. Wang, J. W. Y. Lam, R. Hu, C. Zhang, Y. S. Zhao and B. Z. Tang, J. Mater. Chem. C, 2014, 2, 1801–1807 RSC.
- X. Zhang, J. Ye, L. Xu, L. Yang, D. Deng and G. Ning, J. Lumin., 2013, 139, 28–34 CrossRef CAS.
- Y. Zhang, H. Li, G. Zhang, X. Xu, L. Kong, X. Tao, Y. Tian and J. Yang, J. Mater. Chem. C, 2016, 4, 2971–2978 RSC.
- R. T. K. Kwok, C. W. T. Leung, J. W. Y. Lam and B. Z. Tang, Chem. Soc. Rev., 2015, 44, 4228–4238 RSC.
- J. Mei, Y. Hong, J. W. Y. Lam, A. Qin, Y. Tang and B. Z. Tang, Adv. Mater., 2014, 26, 5429–5479 CrossRef CAS PubMed.
- N. L. C. Leung, N. Xie, W. Yuan, Y. Liu, Q. Wu, Q. Peng, Q. Miao, J. W. Y. Lam and B. Z. Tang, Chem.–Eur. J., 2014, 20, 15349–15353 CrossRef CAS PubMed.
- Y. Chen, M. Li, Y. Hong, J. W. Y. Lam, Q. Zheng and B. Z. Tang, ACS Appl. Mater. Interfaces, 2014, 6, 10783–10791 CAS.
- J. Liang, H. Shi, R. T. K. Kwok, M. Gao, Y. Yuan, W. Zhang, B. Z. Tang and B. Liu, J. Mater. Chem. B, 2014, 2, 4363–4370 RSC.
- R. Hu, E. Lager, A. Aguilar-Aguilar, J. Liu, J. W. Y. Lam, H. H. Y. Sung, I. D. Williams, Y. Zhong, K. S. Wong, E. Peña-Cabrera and B. Z. Tang, J. Phys. Chem. C, 2009, 113, 15845–15853 CAS.
- P. Alam, I. R. Laskar, C. Climent, D. Casanova, P. Alemany, M. Karanam, A. R. Choudhury and J. Raymond Butcher, Polyhedron, 2013, 53, 286–294 CrossRef CAS.
- P. Alam, C. Climent, G. Kaur, D. Casanova, A. Roy Choudhury, A. Gupta, P. Alemany and I. R. Laskar, Cryst. Growth Des., 2016, 16, 5738–5752 CAS.
- D. Kourkoulos, C. Karakus, D. Hertel, R. Alle, S. Schmeding, J. Hummel, N. Risch, E. Holder and K. Meerholz, Dalton Trans., 2013, 42, 13612–13621 RSC.
- C.-H. Yang, M. Mauro, F. Polo, S. Watanabe, I. Muenster, R. Fröhlich and L. De Cola, Chem. Mater., 2012, 24, 3684–3695 CrossRef CAS.
- K. Zhang, S. Liu, Q. Zhao, F. Li and W. Huang, in Luminescent and Photoactive Transition Metal Complexes as Biomolecular Probes and Cellular Reagents, ed. K. K.-W. Lo, Springer, Berlin Heidelberg, 2015, vol. 165, ch. 166, pp. 131–180 Search PubMed.
- R. D. Costa, E. Ortí, H. J. Bolink, F. Monti, G. Accorsi and N. Armaroli, Angew. Chem., Int. Ed., 2012, 51, 8178–8211 CrossRef CAS PubMed.
- Y. Zhou and J. Yoon, Chem. Soc. Rev., 2012, 41, 52–67 RSC.
- J. F. Zhang, Y. Zhou, J. Yoon and J. S. Kim, Chem. Soc. Rev., 2011, 40, 3416–3429 RSC.
- P. Alam, M. Karanam, D. Bandyopadhyay, A. R. Choudhury and I. R. Laskar, Eur. J. Inorg. Chem., 2014, 2014, 3710–3719 CrossRef CAS.
- S. Lamansky, P. Djurovich, D. Murphy, F. Abdel-Razzaq, H.-E. Lee, C. Adachi, P. E. Burrows, S. R. Forrest and M. E. Thompson, J. Am. Chem. Soc., 2001, 123, 4304–4312 CrossRef CAS PubMed.
- P. Alam, G. Kaur, A. Sarmah, R. K. Roy, A. R. Choudhury and I. R. Laskar, Organometallics, 2015, 34, 4480–4490 CrossRef CAS.
- P. Alam, P. Das, C. Climent, M. Karanam, D. Casanova, A. R. Choudhury, P. Alemany, N. R. Jana and I. R. Laskar, J. Mater. Chem. C, 2014, 2, 5615–5628 RSC.
- P. Alam, G. Kaur, S. Chakraborty, A. Roy Choudhury and I. R. Laskar, Dalton Trans., 2015, 44, 6581–6592 RSC.
- P. Alam, G. Kaur, C. Climent, S. Pasha, D. Casanova, P. Alemany, A. Roy Choudhury and I. R. Laskar, Dalton Trans., 2014, 43, 16431–16440 RSC.
- K. Huang, H. Wu, M. Shi, F. Li, T. Yi and C. Huang, Chem. Commun., 2009, 1243–1245, 10.1039/B816056B.
- Q. Zhao, L. Li, F. Li, M. Yu, Z. Liu, T. Yi and C. Huang, Chem. Commun., 2008, 685–687, 10.1039/b712416c.
- Y. You, H. S. Huh, K. S. Kim, S. W. Lee, D. Kim and S. Y. Park, Chem. Commun., 2008, 3998–4000, 10.1039/b806541a.
- A. D. Becke, J. Chem. Phys., 1993, 98, 5648–5652 CrossRef CAS.
- P. J. Hay and W. R. Wadt, J. Chem. Phys., 1985, 82, 270–283 CrossRef CAS.
- W. R. Wadt and P. J. Hay, J. Chem. Phys., 1985, 82, 284–298 CrossRef CAS.
- P. J. Hay and W. R. Wadt, J. Chem. Phys., 1985, 82, 299–310 CrossRef CAS.
- M. J. Frisch, G. W. Trucks, H. B. Schlegel, G. E. Scuseria, M. A. Robb, J. R. Cheeseman, G. Scalmani, V. Barone, B. Mennucci, G. A. Petersson, H. Nakatsuji, M. Caricato, X. Li, H. P. Hratchian, A. F. Izmaylov, J. Bloino, G. Zheng, J. L. Sonnenberg, M. Hada, M. Ehara, K. Toyota, R. Fukuda, J. Hasegawa, M. Ishida, T. Nakajima, Y. Honda, O. Kitao, H. Nakai, T. Vreven, J. A. Montgomery Jr, J. E. Peralta, F. Ogliaro, M. J. Bearpark, J. Heyd, E. N. Brothers, K. N. Kudin, V. N. Staroverov, R. Kobayashi, J. Normand, K. Raghavachari, A. P. Rendell, J. C. Burant, S. S. Iyengar, J. Tomasi, M. Cossi, N. Rega, N. J. Millam, M. Klene, J. E. Knox, J. B. Cross, V. Bakken, C. Adamo, J. Jaramillo, R. Gomperts, R. E. Stratmann, O. Yazyev, A. J. Austin, R. Cammi, C. Pomelli, J. W. Ochterski, R. L. Martin, K. Morokuma, V. G. Zakrzewski, G. A. Voth, P. Salvador, J. J. Dannenberg, S. Dapprich, A. D. Daniels, Ö. Farkas, J. B. Foresman, J. V. Ortiz, J. Cioslowski and D. J. Fox, Gaussian 09, Revision E 01, Gaussian, Inc., Wallingford, CT, 2009 Search PubMed.
- CrystalClear 2.0, Rigaku Corporation, Tokyo, Japan, 2016 Search PubMed.
- G. Sheldrick, Acta Crystallogr., Sect. A: Found. Crystallogr., 2008, 64, 112–122 CrossRef CAS PubMed.
- O. V. Dolomanov, L. J. Bourhis, R. J. Gildea, J. A. K. Howard and H. Puschmann, J. Appl. Crystallogr., 2009, 42, 339–341 CrossRef CAS.
- A. Spek, Acta Crystallogr., Sect. D: Biol. Crystallogr., 2009, 65, 148–155 CrossRef CAS PubMed.
- M. Nardelli, J. Appl. Crystallogr., 1995, 28, 659 CrossRef CAS.
- A. J. Howarth, R. Patia, D. L. Davies, F. Lelj, M. O. Wolf and K. Singh, Eur. J. Inorg. Chem., 2014, 2014, 3657–3664 CrossRef CAS.
Footnote |
| † Electronic supplementary information (ESI) available: Crystal data for complex 2. CCDC 1505831. For ESI and crystallographic data in CIF or other electronic format see DOI: 10.1039/c6ra24792j |
| This journal is © The Royal Society of Chemistry 2017 |

