 Open Access Article
Creative Commons Attribution 3.0 Unported Licence
Study on the synthesis of bio-based epoxy curing agent derived from myrcene and castor oil and the properties of the cured products
Xuejuan Yanga,
Chunpeng Wangab,
Shouhai Li*ab,
Kun Huangab,
Mei Liab,
Wei Maoa,
Shan Caoa and
Jianling Xia*ab
aInstitute of Chemical Industry of Forestry Products, CAF, Key Lab. of Biomass Energy and Material, Jiangsu Province, National Engineering Lab. for Biomass Chemical Utilization, Key and Lab. on Forest Chemical Engineering, SFA, Nanjing 210042, China. E-mail: yangxuejuan2008@126.com; lishouhai1979@163.com; xiajianling@126.com; Fax: +86-025-85482454; Tel: +86-025-85482453
bInstitute of Forest New Technology, CAF, Beijing 100091, China
First published on 22nd December 2016
Abstract
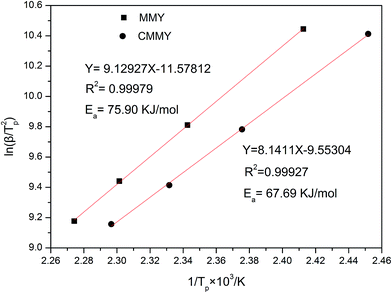
Two novel bio-based epoxy curing agents derived from myrcene (MMY) and castor oil (CMMY) were prepared, respectively. Their chemical structures were confirmed by Fourier transform infrared spectrometry (FTIR) and 1H nuclear magnetic resonance (1HNMR). The two curing agents were used to cure a commercial epoxy resin (E-51). The MMY-cured epoxy resin had very poor toughness while the CMMY-cured epoxy resin had low strength, so the two curing agents were mixed at different weight ratios to form new curing agents for the E-51 epoxy resin. The tensile strength, impact strength, dynamic mechanical properties, thermal stability, micro-morphology of fracture surfaces and gel content of the cured epoxies were all investigated. The curing behaviors of the cured epoxies were studied by differential scanning calorimetry (DSC). Results show that the elongation at break is increased and the tensile strength and glass transition temperature are decreased with increasing weight ratio of CMMY, while the impact strength is increased gradually. The initial degradation temperatures of all the cured epoxy resins were above 367 °C. The gel contents of the epoxy resins cured with the mixed curing agents were above 87%. The activation energies for the systems with MMY and CMMY were 75.90 and 67.69 kJ mol−1, respectively.
1. Introduction
Epoxy resin, which is an important type of thermosetting polymer with a history of more than 60 years, is widely used in protective coatings, adhesives, castings, composites, microelectronic encapsulated materials and printed circuit boards due to their advantages of versatility, moisture, solvent and chemical resistance, mechanical properties, adhesion and electrical properties.1–3 Nowadays, the most common and important class is the epoxy resin synthesized from bisphenol A and epichlorohydrin. Before curing, epoxy monomers or oligomers have at least two epoxy groups, but after curing, they become cross-linked networks due to the reaction with a suitable curing agent or catalyst.4 Amine-type and anhydride-type curing agents are commonly used for epoxy resin and they act as an important role since the weight ratio of curing agents can go up as high as 50 wt% in the epoxy formulations and can determine the ultimate properties of the cured resin in large extent.5Chemicals and materials derived from renewable resources have received considerable attention in recent years as the petroleum depletion and environmental problem become increasingly serious.6,7 For this reason, many biobased epoxy curing agents have been prepared. For example, a novel vegetable-oil-based polyamine was prepared from grape seed oil using cysteamine chloride by thiol–ene.8 Differential scanning calorimetry (DSC) showed that the light-color cardanol-based epoxy curing agent, synthesized from cardanol butyl ether, formaldehyde and diethylenetriamine, was less reactive than phenalkamine and had markedly higher impact strength and lap shear strength attributed to the cavities formed in the curing process.9 Rosin-derived amine curing agent containing an imide structure displayed a similar modulus but higher glass transition temperature than the commercial aromatic amine curing agent.10 The fully biobased epoxy resins prepared from terpene maleic anhydride and maleopimaric acid have comparable or even better mechanical properties and thermal stability than the bisphenol A type epoxies cured by petroleum-based curing agents.5
Terpenes, which are natural monomers containing carbon skeletons of isoprene, can be extracted from many essential oils and used as a versatile chemical feedstock.11 The chemical structures of several common terpenes and their derivatives are shown in Fig. 1. β-Myrcene, a monoterpene that bears three double bonds including conjugated diene, is extracted from the essential oils of many plants, such as laurel, verbena, cypress and hop.12,13 Myrcene is commercially prepared from the cracking of β-pinene (production of 26![[thin space (1/6-em)]](https://www.rsc.org/images/entities/char_2009.gif) 000 tons), which is obtained from turpentine oil.14 Myrcene can react with different dienophiles to form a variety of fragrant compounds and pharmaceutical intermediates.15,16 For example, one fragrance that could be used in deodorants was recently synthesized from myrcene, and the optimal catalyst for the addition of methanol to myrcene was AlCl3.17 Moreover, one biobased thermosetting resin was prepared from the reaction of myrcene with 1,10-(methylenedi-4,1-phenylene)bismaleimide, and its thermal, mechanical and water-resistance properties were investigated.18
000 tons), which is obtained from turpentine oil.14 Myrcene can react with different dienophiles to form a variety of fragrant compounds and pharmaceutical intermediates.15,16 For example, one fragrance that could be used in deodorants was recently synthesized from myrcene, and the optimal catalyst for the addition of methanol to myrcene was AlCl3.17 Moreover, one biobased thermosetting resin was prepared from the reaction of myrcene with 1,10-(methylenedi-4,1-phenylene)bismaleimide, and its thermal, mechanical and water-resistance properties were investigated.18
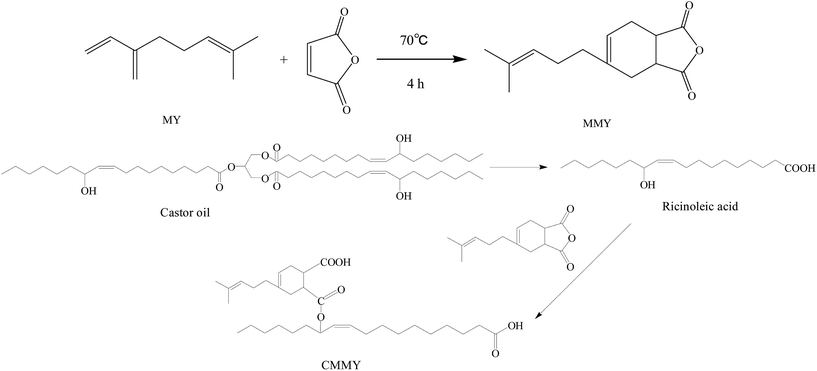
In this study, a Diels–Alder adduct of myrcene and maleic anhydride was synthesized and used to cure epoxy E-51. Despite the excellent strength and modulus, the cured epoxy resin had poor impact property and very low elongation at break. As we all know, the toughness of epoxy resins can be improved by incorporating a flexible epoxy resin, curing agent or reactive additive into the network during curing.19 Castor oil is extensively used in varnishes, paints, coatings and a variety of other products. Because of the long aliphatic chains in the triglyceride section, the materials prepared from castor oil have excellent flexibility, while the strength was poor. Ricinoleic acid obtained from the hydrolysis of castor oil was used to modify the myrcene-based adduct. The modified myrcene-based adduct was also used as the curing agent for epoxy E-51. The cured epoxy resins had excellent flexibility, but too poor strength, which limited their applications. Therefore, the two curing agents at different weight ratios were mixed and used to co-cure epoxy E-51, and the cured epoxy material was supposed to have the balanced strength and flexibility. The tensile properties, dynamic mechanical properties, curing kinetics, thermostability and fracture morphology of the cured resins were also studied.
2. Experimental
2.1 Materials and chemicals
Castor oil (>97%), 2,4,6-tris(dimethylaminomethyl)phenol were purchased from Aladdin Industrial Corporation. Myrcene was purchased from Jiangxi global natural spices Co., contains about 79% of myrcene. Maleic anhydride (stabilized, 99.5%), benzyltriethylamine chloride (≥98.0%), sodium hydrate, hydrochloric acid and ethyl alcohol were purchased from the Group chemical reagent Co. Distilled water was prepared in our laboratory. Epoxy resin E-51 (epoxy value was 0.51/100 g) was provided by Nanjing science and technology development corporation of institute of chemical industry of forestry products. All the reagents were used as received.2.2 Synthesis
![[thin space (1/6-em)]](https://www.rsc.org/images/entities/char_2009.gif) :
:![[thin space (1/6-em)]](https://www.rsc.org/images/entities/char_2009.gif) 1, v/v), and then the mixture was introduced into a 1000 mL four-necked round-bottom flask equipped with a mechanical stirrer and a thermometer. When the mixture was heated to 70 °C, 311.15 g (0.33 mol) of castor oil was slowly added to the above reaction system with a dropping funnel over half an hour. Reaction continued at 70 °C for 2.0 h. After that, the reacting system was adjusted to pH = 2–3 by slowly adding a certain amount of 5 mol L−1 HCl, and the reaction continued at 70 °C for 1.0 h. After standing for 30 min, the supernatant ricinoleic acid was taken out. The final product was washed with H2O. Finally, the residual H2O was removed by vacuum distillation. Then 270.86 g (yield: 89.14%) of light yellow liquid of pure ricinoleic acid was obtained, the acid value is 173.84 (theoretical value 193.15 mg g−1, conversion is 90.00%).
1, v/v), and then the mixture was introduced into a 1000 mL four-necked round-bottom flask equipped with a mechanical stirrer and a thermometer. When the mixture was heated to 70 °C, 311.15 g (0.33 mol) of castor oil was slowly added to the above reaction system with a dropping funnel over half an hour. Reaction continued at 70 °C for 2.0 h. After that, the reacting system was adjusted to pH = 2–3 by slowly adding a certain amount of 5 mol L−1 HCl, and the reaction continued at 70 °C for 1.0 h. After standing for 30 min, the supernatant ricinoleic acid was taken out. The final product was washed with H2O. Finally, the residual H2O was removed by vacuum distillation. Then 270.86 g (yield: 89.14%) of light yellow liquid of pure ricinoleic acid was obtained, the acid value is 173.84 (theoretical value 193.15 mg g−1, conversion is 90.00%).80.00 g (0.27 mol) of ricinoleic acid and 62.79 g (0.27 mol) of adduct of myrcene and maleic anhydride were charged to a 250 mL flask, the mixture reacted at 120 °C for 2 h. Then the castor oil modified adduct of myrcene and maleic anhydride was obtained. The synthesis route was shown in Fig. 2.
![[thin space (1/6-em)]](https://www.rsc.org/images/entities/char_2009.gif) :
:![[thin space (1/6-em)]](https://www.rsc.org/images/entities/char_2009.gif) 1), and 2,4,6-tris(dimethylaminomethyl)phenol (DMP-30) (1 wt% on the basis of the total weight of curing agent and epoxy) used as the catalyst, all the formulations were listed in Table 1. Then the mixtures were poured into the polytetrafluoroethylene mold. The curing reaction was performed at 120 °C for 2 h and 160 °C for 3 h. At last the cured samples were carefully removed from the mold and polished for further test.
1), and 2,4,6-tris(dimethylaminomethyl)phenol (DMP-30) (1 wt% on the basis of the total weight of curing agent and epoxy) used as the catalyst, all the formulations were listed in Table 1. Then the mixtures were poured into the polytetrafluoroethylene mold. The curing reaction was performed at 120 °C for 2 h and 160 °C for 3 h. At last the cured samples were carefully removed from the mold and polished for further test.
| Sample | E-51 (g) | MMY | CMMY | DMP-30 (g) |
|---|---|---|---|---|
| MMY100 | 33.48 | 40.00 | 0 | 0.73 |
| MMY75/CMMY25 | 32.46 | 30.00 | 10.00 | 0.72 |
| MMY50/CMMY50 | 31.46 | 20.00 | 20.00 | 0.71 |
| MMY25/CMMY75 | 30.46 | 10.00 | 30.00 | 0.70 |
| CMMY100 | 29.46 | 0 | 40.00 | 0.69 |
Tensile property test was performed following ASTM D638-03 using a CMT4303 universal test machine (SANS, China) with the test speed of 3 mm min−1. Impact strength was test following GB/T 1043.1 using ZBC1400-C impact tester. For the sake of accuracy, five replicates were measured and the average values were obtained. All the samples were tested at 25 °C.
Non-isothermal curing kinetics was studied by differential scanning analysis (DSC) using a 2920 MDSC (TA instruments). Samples were scanned from 25 to 230 °C at heating rates of 5, 10, 15, 20 °C min−1, respectively.
The dynamic mechanical analysis (DMA) was performed on a Q800 dynamic mechanical thermal analyzer (TA, USA). Samples were test in double cantilever mode with a frequency of 1 Hz and the dimension of the samples were 60 × 10 × 4 mm3. All the tests were swept from −70 to 150 °C at a heating rate of 3 °C min−1.
The degree of cure of each sample was tested by the Soxhlet extraction. 1.5 g of cured sample was extracted for 24 h, using 200 ml acetone as solvent. For the accuracy, each sample tested three times.
Thermogravimetric analysis (TGA) was performed using a 409 PC thermogravimetric analyzer (Netzsch, Germany). Each sample was tested from 25 to 700 °C at a heating rate of 10 °C min−1 under a nitrogen atmosphere.
The fracture surfaces of epoxy resin cured with different MMY/CMMY ratios were observed with the scanning electron microscopy (SEM). A thin gold layer which is a few nanometers thick was coated on the fracture surfaces to aid in feature resolution. Then a S-3400N scanning electron microscopy (Hitachi, Japan) was used to collect SEM images for all samples.
3. Results and discussion
3.1 Fourier transform infrared spectrometry (FTIR)
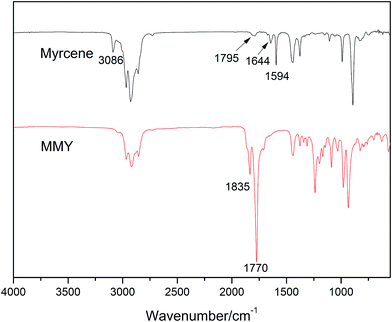
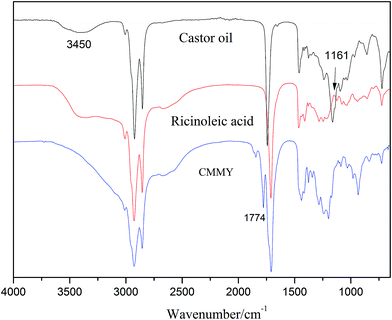
The spectra of myrcene and MMY are shown in Fig. 3. The spectrum of myrcene shows several characteristic peaks corresponding to the conjugated double bonds (1644 and 1594 cm−1), terminal vinyl group (3086 and 1795 cm−1) and isolated double bond (1644 cm−1).20 All these peaks clearly verify the molecular structure of myrcene. The spectrum of MMY shows the peaks characteristic of carbonyl in the cyclic anhydride (1835 and 1770 cm−1) and the bending vibration of C–H in the hexatomic ring (1311 cm−1). However, the peaks at 3086, 1795 and 1594 cm−1 appearing on the spectrum of myrcene have basically disappeared. These evidences confirm the occurrence of the Diels–Alder reaction between myrcene and maleic anhydride.The FTIR spectra of castor oil, ricinoleic acid and CMMY are shown in Fig. 4. The spectrum of castor oil shows the peaks attributed to the stretching vibration of –OH in fatty acid chain (3450 cm−1) and the stretching vibration of C–O–C in the triglyceride section of castor oil (1161 cm−1). Compared with castor oil, the spectrum of ricinoleic acid shows no peak of C–O–C at 1161 cm−1, but a new peak at 3400–2500 cm−1 attributed to the stretching vibration of –OH in carboxyl group. The hydrogen bonding association makes the absorption peak wide and overlapped with the peaks of –CH3 and –CH2 at 3015, 2927 and 2854 cm−1. In spectrum of CMMY, the associated absorption peak is intensified obviously and a new peak assigned to the C![[double bond, length as m-dash]](https://www.rsc.org/images/entities/char_e001.gif) O of ester group appears at 1774 cm−1. These changes of absorption peaks suggest the successful synthesis of the target object.
O of ester group appears at 1774 cm−1. These changes of absorption peaks suggest the successful synthesis of the target object.
3.2 1H nuclear magnetic resonance (1HNMR)
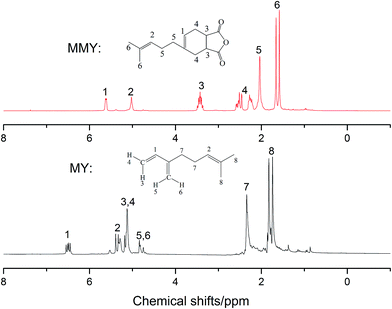
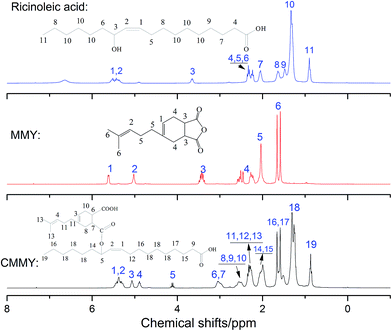
The 1HNMR spectra of MMY and CMMY are shown in Fig. 5 and 6. MY: (CDCl3, δ ppm) 6.43–6.53 (t, 1H), 5.24–5.35 (t, 1H), 5.03–5.18 (d, 2H), 4.70–4.85 (q, 2H), 2.18–2.36 (m, 4H), 1.67–1.85 (m, 6H).3.3 Curing kinetics analysis
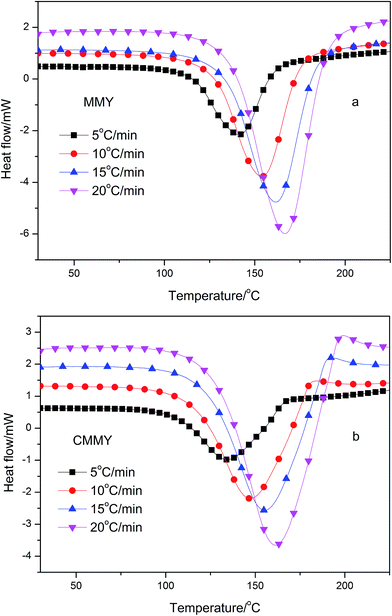
The nonisothermal DSC thermograms of the co-cured samples are shown in Fig. 7, and the DSC results are summarised in Table 2. Clearly, each sample exhibits only one exothermic peak during the curing procedure. As the heating rate increases, the initial temperature (Ti), peak exothermic temperature (Tp), and temperature at curing end (Te) all rise and the exothermic peak becomes sharper, which indicate a much more focused exothermic process and a quicker curing reaction. The shift in the curing temperature is probably more methodological. The whole curing process is composed of different elementary reactions depending on the heating rates,21,22 while the DSC measures the overall reaction enthalpy. Therefore, without comprehensive analysis of possible elementary reactions, DSC alone provides very limited information on the mechanism. Nevertheless, the effects of curing rates on curing reaction can be eliminated by linear extrapolating the heating rate to infinitely slow,23,24 so that the curing temperature at zero heating rate is determined. The Ti, Tp and Te at zero heating rate are listed in Table 2, ranging from 110.38 to 134.92 °C for MMY and 103.47 to 127.48 °C for CMMY. These data are references for temperature setting in study on isothermal curing. The total reaction enthalpy (ΔH) of the two system changed little with the heating rate (Table 2). The enthalpy of E-51/MMY is close to the DGEAPA/NMA and DGEDA/NMA system report by Huang et al., while the enthalpy of E-51/CMMY system is lower than that.25| Sample | β (°C min−1) | Ti (°C) | Tp (°C) | Te (°C) | ΔH (J g−1) | ΔHa (kJ mol−1) |
|---|---|---|---|---|---|---|
| a On the basis of per mole of epoxide. | ||||||
| MMY | 0 | 110.38 | 134.92 | 152.52 | — | — |
| 5 | 115.61 | 141.34 | 159.74 | 245.60 | 48.16 | |
| 10 | 127.20 | 153.72 | 174.19 | 237.70 | 46.67 | |
| 15 | 133.84 | 161.36 | 183.12 | 232.31 | 45.55 | |
| 20 | 137.67 | 166.56 | 188.64 | 210.95 | 41.36 | |
| CMMY | 0 | 103.47 | 127.48 | 157.28 | — | — |
| 5 | 109.46 | 134.72 | 165.16 | 169.48 | 33.23 | |
| 10 | 117.07 | 147.80 | 179.52 | 174.04 | 34.13 | |
| 15 | 123.76 | 155.74 | 188.35 | 173.51 | 34.02 | |
| 20 | 129.06 | 162.28 | 195.28 | 179.54 | 35.20 | |
The activation energy can be computed from various methods. In our study, Kissinger's equation was used:26,27
| ln(β/Tp2) = ln(AR/Ea) − (Ea/RTp) |
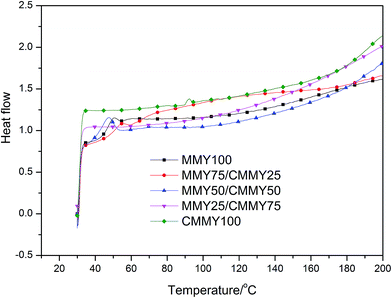
Besides, the cured samples were checked by DSC, the DSC thermograms of them are shown in Fig. 9. There were no exothermic peaks noted except a little peak at the DSC curve of CMMY. This little peak was probably due to the crystalline part melting peak of cured sample. The DSC results imply that the sample have already cured completely. It is worthy noting that there were no peaks on DSC curves of MMY100 and MMY75/CMMY25-cured sample. This was probably due to the tested Tg of the two samples were lower than the initial testing temperature, thus, they were can not been detected.
3.4 Dynamic mechanical analysis (DMA)
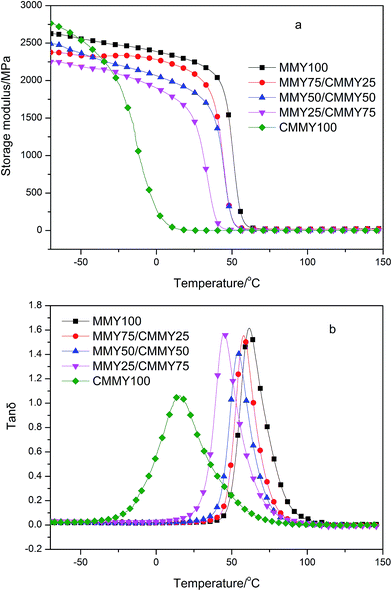
Fig. 10 shows the storage modulus curve (a) and loss factor (tan![[thin space (1/6-em)]](https://www.rsc.org/images/entities/char_2009.gif) δ, b) curve of the cured epoxy resins with different MMY/CMMY weight ratios. The peak temperature of tan
δ, b) curve of the cured epoxy resins with different MMY/CMMY weight ratios. The peak temperature of tan![[thin space (1/6-em)]](https://www.rsc.org/images/entities/char_2009.gif) δ is defined as the glass transition temperature (Tg). Storage modulus (E′) in the rubbery state can be used to calculate the crosslink density according to the rubber elasticity theory:29,30
δ is defined as the glass transition temperature (Tg). Storage modulus (E′) in the rubbery state can be used to calculate the crosslink density according to the rubber elasticity theory:29,30| E′ = 3νeRT |
| Sample | Tg (°C) | E′ at Tg + 30 °C (MPa) | νe/(mol m−3) | Gel content (%) |
|---|---|---|---|---|
| MMY100 | 61.59 | 19.06 | 2096 | 84.46 ± 1.20 |
| MMY75/CMMY25 | 58.03 | 19.00 | 2110 | 87.34 ± 0.96 |
| MMY50/CMMY50 | 54.03 | 4.18 | 469 | 91.89 ± 1.03 |
| MMY25/CMMY75 | 45.09 | 2.72 | 313 | 88.22 ± 0.86 |
| CMMY100 | 15.14 | 1.11 | 140 | 57.71 ± 0.98 |
Clearly, all the cured samples show one Tg, and the storage modulus of the cured resins are elevated with the increase of MMY weight ratio, particularly above −25 °C (Fig. 10a). This is because with the increase of MMY weight ratio, the proportion of rigid alicyclic structure is improved, which enhances the hardness and rigidity of the cured resins. Under a given load, the network containing more rigid alicyclic structure is more resistant against deformation and thus has a higher storage modulus. Besides the crosslink density is increased with the increasing content of MMY when the MMY content is less than 75% wt. The higher crosslink density positively contributes to higher storage modulus.31 On the other hand, with the increase of CMMY weight ratio, the gel content first rises and then declines (Table 3). This is probably because the steric hindrance effect of cycloaliphatic structure in MMY is gradually weakened with the decrease of MMY weight ratio. As the CMMY weight ratio exceeds 50 wt%, the influence of steric effect is weakened, while the chemical activities of the anhydride and carboxyl groups play a dominant role in the curing process.
Nevertheless, the pure-CMMY-cured sample exhibits higher storage modulus than other samples at low temperature. This is probably because the long-aliphatic-chain moieties in CMMY are packed more regularly. The optimally compacted configuration has very high interaction and cohesive energy, which improves the modulus of the cured epoxy resin.32,33 However, the non-covalent interaction is weakened, as the flexible chains get enough kinetic energy to overcome the energetic barrier for their motion with the temperature rises. Under this circumstance, the storage modulus decreases dramatically.
With the increase of CMMY weight ratio, Tg decreases from 61.59 to 15.14 °C, this is because the long flexible aliphatic chains and esters in CMMY increase the free volume in the cured epoxy networks. With the temperature rises, the ester group and the flexible aliphatic segment move more freely at lower temperature. Thus, the sample containing more CMMY has a relatively lower Tg. Besides, the tan![[thin space (1/6-em)]](https://www.rsc.org/images/entities/char_2009.gif) δ peak of pure CMMY-cured sample is more wider than that of other samples, this is because under the alternative stress, the flexible segments in CMMY could begin to move at lower temperature than the alicyclic moieties do. In other words, the E-51/CMMY100 system is more heterogeneous than other system.
δ peak of pure CMMY-cured sample is more wider than that of other samples, this is because under the alternative stress, the flexible segments in CMMY could begin to move at lower temperature than the alicyclic moieties do. In other words, the E-51/CMMY100 system is more heterogeneous than other system.
3.5 Tensile properties
The tensile curves of the co-cured epoxy resins are shown in Fig. 11 and the detailed data of tensile and impact property are listed in Table 4. Clearly, the samples containing more than 50 wt% of MMY exhibit a rigid behavior and an elongation at break below 8%, while the samples containing less than 50 wt% of MMY show a flexible behavior without a yielding point. The pure-MMY-cured sample has a tensile strength of 48.74 MPa, an elongation at break of 7.54% and impact strength of 8.55 kJ m−2. Although the strength is lower than a reported commercial glycidyl ether type epoxy DER332, the elongation at break is 20% improved and the impact strength is 11% improved.34 With the increase of MMY weight ratio, the tensile strength is improved while the elongation at break first decreases and then increases. When the CMMY weight ratio is less than 50 wt%, the elongation at break is low (6.47–7.54%) and does not vary largely. In addition, with the CMMY weight ratio increasing from 50 to 75 wt%, the tensile strength is decreased by more than two-thirds from 35.55 to 11.11 MPa, while the elongation at break is dramatically increased by 40 times from 6.60 to 259.43%. The reason is that CMMY contains a long aliphatic chain and an ester group which could enhance the flexibility of the cured epoxy resins. When the cured samples are stretched, the long chain could move more freely to offset and balance with the external forces, so the samples containing more CMMY are more extendable. Although MMY and CMMY have the same numbers of reactive groups, CMMY has a molecule weight about 2.3 times larger than MMY. Besides, the gel content of sample cured with CMMY is much lower than that cured with MMY. Therefore, the crosslink density of an MMY-cured sample is higher than that of a CMMY-cured sample. In turn, a higher crosslink density would improve the strength and decrease the elongation at break. Moreover, the structure of MMY contains a hexatomic ring, which could bestow the cured epoxy resin with high strength and rigidity. Thus the tensile strength is enhanced gradually with the increase of MMY weight ratio.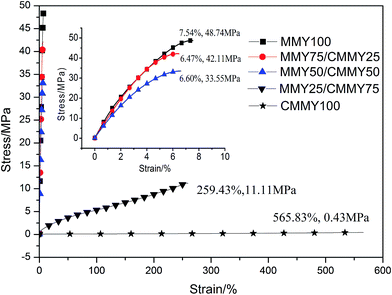 | ||
| Fig. 11 The tensile stress–strain of the cured epoxy resin with different curing agents weight ratios. | ||
| Samples | Tensile strength (MPa) | Elongation at break (%) | Impact strength (kJ m−2) |
|---|---|---|---|
| MMY100 | 48.74 ± 1.18 | 7.54 ± 0.53 | 8.55 ± 0.80 |
| MMY75/CMMY25 | 42.11 ± 0.92 | 6.47 ± 0.42 | 13.87 ± 0.66 |
| MMY50/CMMY50 | 35.55 ± 0.56 | 6.60 ± 0.40 | 17.29 ± 1.10 |
| MMY25/CMMY75 | 11.11 ± 0.34 | 259.43 ± 2.30 | 62.51 ± 1.32 |
| CMMY100 | 0.43 ± 0.05 | 565.83 ± 8.23 | Unbroken |
The impact strength is improved gradually with the increasing of CMMY content, this is also mainly due to the long aliphatic chain in the ricinoleic acid part. The flexible aliphatic chain can move more freely when the sample is impacted, which could consume large amount of impact energy. The impact test results are in accordance with the tensile and DMA analysis discussed above.
3.6 Thermal gravimetric analysis (TGA)
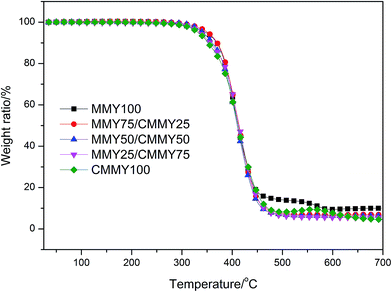
The curves of weight ratio against temperature are displayed in Fig. 12 and the details are listed in Table 5. Clearly, all the cured samples show one-stage degradation. The initial degradation temperatures (Ti) of the samples are all very close and around 370 °C. The T5% (temperature corresponding to 5% of weight loss) of the samples cured with the different MMY/CMMY weight ratios rises with the increase of MMY weight ratio. This is because the alicyclic structure in the MMY is more stable than the aliphatic structure in CMMY. However, the T5% of the pure-MMY-cured sample is slightly lower than that of the MMY75/CMMY25 cured sample. This is probably because the latter has a better cross-linked network than the former. Usually, the char yield is inversely proportional to the hydrogen content of cured resins.35 As CMMY contains more methyls and methylenes than MMY does, the char yield decreases with the increase of CMMY weight ratio.| Sample | Ti (°C) | T5% (°C) | Char yield (%) |
|---|---|---|---|
| MMY100 | 372.60 | 347.93 | 10.06 |
| MMY75/CMMY25 | 374.70 | 351.53 | 6.93 |
| MMY50/CMMY50 | 370.30 | 341.88 | 6.46 |
| MMY25/CMMY75 | 373.90 | 336.21 | 5.47 |
| CMMY100 | 367.30 | 332.72 | 4.57 |
3.7 Morphology
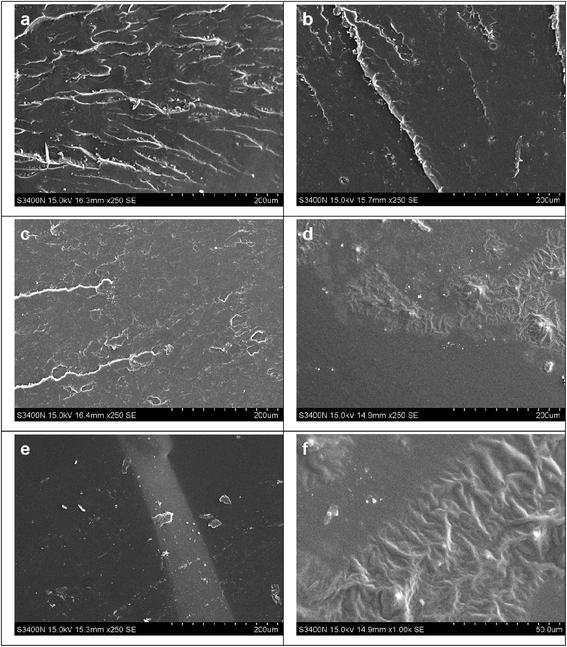
Fig. 13 shows the tensile fracture surface morphology of epoxy resins cured with different MMY/CMMY weight ratios. The fracture surface of MMY-cured sample (Fig. 13a) presents ladder-like structure. This ladder-like structure was due to the concentration of stress during the stretch which in turn would causing crack propagated along different directions.36 On the contary, the fracture surface of pure CMMY-cured sample (Fig. 11e) is flat and featureless. On one hand, this is because the Tg of the pure CMMY-cured sample is 15.14 °C, which is lower than room temperature, thus, when the fracture occurs, the sample is in the rubbery state. Under this circumstance, the molecular chain could move freely under the external tension, the cured sample shows a fracture behavior like rubber, thus the crack propagated in a planar manner under the tensile loading.37 On the other hand, the flexible aliphatic chains in CMMY can move more freely which will facilitate the stress dispersion, and with the increasing of stress the fracture happened at the most vulnerable place. In this case, the tensile fracture surface is flat and the cured sample is elastic. With the decreasing content of MMY, the fracture surfaces became more smooth and the ladder-like region decreased significantly. Moreover, when the MMY/CMMY weight ratio was 75/25, the SEM image (Fig. 13d) exhibited different characteristic with others, the fracture surface was composed by smooth and rough regions. The combined structure made the cured sample with excellent toughness and strength. The same sample at higher magnification (Fig. 13f) was also observed, the rough area dispersed domain with gullies which will dissipate energy by tensile yielding and got a relatively higher elongation at break.4. Conclusions
Myrcene-derived and castor oil-derived curing agents (MMY and CMMY) were synthesized. Their structures were characterized by 1HNMR and FTIR. They were used to cure epoxy resin E-51. The pure-MMY-cured epoxy resin was brittle while the pure-CMMY-cured sample was very flexible. Thus the two curing agents were mixed with different weight ratios. With the increase of CMMY weight ratio, the tensile strength and Tg were decreased while the elongation at break increased. At the MMY/CMMY weight ratio of 25/75, the tensile strength, impact strength, elongation at break, and glass transition temperature were 11.11 MPa, 62.51 MPa, 259.43% and 45.09 °C, respectively. The initial degradation temperatures of the cured epoxy resin were all above 367 °C. The gel contents of the epoxy resins cured with the mixed curing agents were above 87%. The activation energies for the systems with MMY and CMMY were 75.90 and 67.69 kJ mol−1, respectively. The use of biobased raw materials to synthesize curing agents reduces the reliance on petroleum-based resources. Moreover, the significantly enhanced toughness of the cured epoxy resins indicates that vegetable-oil-based curing agents can be applied in preparation of flexible epoxy materials.Acknowledgements
This research project was supported by Five-year science and technology support project (Grant number: 2015BAD15B04), the Basic research funding earmarked for the Key Lab of Biomass Energy and Material of Jiangsu Province, China (Grant number: JSBEM-S-201508) and National Nonprofit Institute Research Grant of CAFINT (Grant number: CAFINT2014C08).References
- N. Kinjo, M. Ogata, K. Nishi, A. Kaneda and K. Dušek, Speciality Polymers/Polymer Physics, Springer, 1989, pp. 1–48 Search PubMed.
- D. Foix, X. Ramis, A. Serra and M. Sangermano, Polymer, 2011, 52, 3269–3276 CrossRef CAS.
- C. Xie, B. Zeng, H. Gao, Y. Xu, W. Luo, X. Liu and L. Dai, Polym. Eng. Sci., 2014, 54, 1192–1200 CAS.
- J. Wan, B. Gan, C. Li, J. Molina-Aldareguia, E. N. Kalali, X. Wang and D.-Y. Wang, Chem. Eng. J., 2016, 284, 1080–1093 CrossRef CAS.
- R. Chang, J. Qin and J. Gao, J. Polym. Res., 2014, 21, 1–7 Search PubMed.
- R. Auvergne, S. Caillol, G. David, B. Boutevin and J.-P. Pascault, Chem. Rev., 2013, 114, 1082–1115 CrossRef PubMed.
- C. Ding and A. S. Matharu, ACS Sustainable Chem. Eng., 2014, 2, 2217–2236 CrossRef CAS.
- M. Stemmelen, F. Pessel, V. Lapinte, S. Caillol, J. P. Habas and J. J. Robin, J. Polym. Sci., Part A: Polym. Chem., 2011, 49, 2434–2444 CrossRef CAS.
- K. Huang, Y. Zhang, M. Li, J. Lian, X. Yang and J. Xia, Prog. Org. Coat., 2012, 74, 240–247 CrossRef CAS.
- H. Wang, H. Wang and G. Zhou, Polym. Int., 2011, 60, 557–563 CrossRef CAS.
- M. Firdaus, L. Montero de Espinosa and M. A. Meier, Macromolecules, 2011, 44, 7253–7262 CrossRef CAS.
- D. Daferera, C. Pappas, P. Tarantilis and M. Polissiou, Food Chem., 2002, 77, 511–515 CrossRef CAS.
- H. Schewe, M. A. Mirata, D. Holtmann and J. Schrader, Process Biochem., 2011, 46, 1885–1899 CrossRef CAS.
- D. Yin, D. Yin, Z. Fu and Q. Li, J. Mol. Catal. A: Chem., 1999, 148, 87–95 CrossRef CAS.
- K. Kogami, O. Takahashi and J. Kumanotani, Can. J. Chem., 1974, 52, 125–128 CrossRef CAS.
- V. V. Veselovsky, A. S. Gybin, A. V. Lozanova, A. M. Moiseenkov, W. A. Smit and R. Caple, Tetrahedron Lett., 1988, 29, 175–178 CrossRef.
- A. Behr, L. Johnen and P. Neubert, Catal. Sci. Technol., 2012, 2, 88–92 CAS.
- M. Shibata and M. Asano, J. Appl. Polym. Sci., 2013, 129, 301–309 CrossRef CAS.
- H. Miyagawa, M. Misra, L. T. Drzal and A. K. Mohanty, Polym. Eng. Sci., 2005, 45, 487–495 CAS.
- X. Yao,Spectral analysis of organic compounds, China medical science press, 2004–11, pp. 66–76, ISBN: 9787506728546 Search PubMed.
- V. Zvetkov, Polymer, 2001, 42, 6687–6697 CrossRef CAS.
- J. Wan, C. Li, Z.-Y. Bu, H. Fan and B.-G. Li, Mater. Chem. Phys., 2013, 138, 303–312 CrossRef CAS.
- S. Sourour and M. Kamal, Thermochim. Acta, 1976, 14, 41–59 CrossRef CAS.
- S. Vyazovkin and C. Wight, Annu. Rev. Phys. Chem., 1997, 48, 125–149 CrossRef CAS PubMed.
- K. Huang, J. Zhang, M. Li, J. Xia and Y. Zhou, Ind. Crops Prod., 2013, 49, 497–505 CrossRef CAS.
- H. E. Kissinger, J. Res. Natl. Bur. Stand., 1956, 57, 217–221 CrossRef CAS.
- H. E. Kissinger, Anal. Chem., 1957, 29, 1702–1706 CrossRef CAS.
- S. Li, K. Huang, X. Yang, M. Li and J. Xia, RSC Adv., 2014, 4, 44741–44749 RSC.
- A. Asif, W. Shi, X. Shen and K. Nie, Polymer, 2005, 46, 11066–11078 CrossRef CAS.
- J. Lu, S. Khot and R. P. Wool, Polymer, 2005, 46, 71–80 CrossRef CAS.
- T. F. Scott, W. D. Cook and J. S. Forsythe, Eur. Polym. J., 2002, 38, 705–716 CrossRef CAS.
- S. Cukierman, J. L. Halary and L. Monnerie, Polym. Eng. Sci., 1991, 31, 1476–1482 CAS.
- M. Aldridge, A. Wineman, A. Waas and J. Kieffer, Macromolecules, 2014, 47, 8368–8376 CrossRef CAS.
- K. Huang, P. Zhang, J. Zhang, S. Li, M. Li, J. Xia and Y. Zhou, Green Chem., 2013, 15, 2466–2475 RSC.
- E. Jakab, F. Till, T. Szekely, S. Kozhabekov and B. Zhubanov, J. Anal. Appl. Pyrolysis, 1992, 23, 229–243 CrossRef CAS.
- X. Feng, S. Zhang, S. Zhu, K. Han, M. Jiao, J. Song, Y. Ma and M. Yu, RSC Adv., 2013, 3, 11738–11744 RSC.
- O. Fenollar, D. García, L. Sánchez, J. López and R. Balart, Eur. Polym. J., 2009, 45, 2674–2684 CrossRef CAS.
| This journal is © The Royal Society of Chemistry 2017 |


