 Open Access Article
Creative Commons Attribution 3.0 Unported Licence
Hydrothermal fabrication of natural sun light active Dy2WO6 doped ZnO and its enhanced photo-electrocatalytic activity and self-cleaning properties†
Kuppulingam Thirumalaia,
Manohar Shanthia and
Meenakshisundaram Swaminathan*ab
aPhotocatalysis Laboratory, Department of Chemistry, Annamalai University, Annamalai Nagar–608 002, Tamil Nadu, India. E-mail: chemres50@gmail.com; m.swaminathan@klu.ac.in; Fax: +91-4144-220572; Tel: +91-4144-220572
bNanomaterials Laboratory, International Research Centre, Kalasalingam University, Krishnan Kovil–626126, India
First published on 23rd January 2017
Abstract
In this article we report the fabrication of 3 wt% Dy2WO6 doped ZnO via a template-free hydrothermal process and its photocatalytic activity against azo dyes Rhodamine-B (Rh-B) and Trypan Blue (TB) in solar light irradiation. The as prepared Dy2WO6 doped ZnO was characterised by X-ray diffraction (XRD), field emission scanning electron microscopy (FE-SEM), high resolution scanning electron microscopy (HR-SEM) field emission transmission electron microscopy (FE-TEM), X-ray photoelectron spectroscopy (XPS), diffused reflectance (DRS) and photoluminescence (PL) spectroscopy. The results suggested that rare earth tungstate doping, with Dy2WO6, on ZnO has a great influence on the photocatalytic activity. Dy2WO6-ZnO possesses high reusability without appreciable loss of catalytic activity up to four runs and exhibits higher electrocatalytic activity than the prepared ZnO for methanol electrooxidation in alkaline medium, revealing its promising potential as the anode catalyst in direct methanol fuel cells. Hydrophobicity of ZnO increases on doping with Dy2WO6.
Introduction
The semiconductor photocatalytic process has been widely applied as an eco-friendly technique for the destruction of organic pollutants in wastewater because of its advantages of photocatalytic activity in both UV and solar light.1,2 Among various semiconductor nanomaterials, the II–VI semiconductor ZnO possesses a special place due to its several interesting properties and broad applications. The metal oxide, ZnO, a wideband-gap semiconductor with a large exciton binding energy of 60 meV at room temperature, is rationally expected to be a promising candidate for heterogeneous catalysis under solar light and optoelectronics due to its long-term stability and biocompatibility.3 However, it's large band gap energy (3.2 eV), hampers its widespread practical applications. Thus, the photocatalytic activity of ZnO requires to be further improved.Doping of ZnO nanomaterials significantly increases the surface defects which can presumably shift the absorption towards visible region. The enhancement in optical absorption due to surface defects by doping has been studied by several research groups using different transition metals such as Cd,4 Cu,5 Co,6 Mn,7 Sr,8 Fe,9 V and W,10 Mg,11 Pd12 etc. and metal oxide such as CdO,13 WO3,14 Bi2O3,15 BiVO4.16 Metal tungstates as ancestors of multicomponent metal oxide compounds, have been well thought-out largely due to their fascinating structures, interesting physic–chemical behavior, as well as their extensive range of applications in various fields specifically in photocatalysis.17–22 Nowadays research is focussed on doping of ZnO with rare earth metals and their oxides for the enhancement of photocatalytic activity of ZnO.23–27
In this connection here we introduced a rare earth metal tungstate, Dy2WO6, doped ZnO nanoparticles, synthesised by simple hydrothermal method and analysed its photocatalytic activity under natural sun light irradiation in the degradation of two azo dyes (Rhodamine-B and Trypan Blue).
As heterostructured nanocomposites show good hydrophobicity and electrocatalytic activity, these characteristics of Dy2WO6-ZnO were analysed. We believe that our results can open a new and effective avenue to further improve the solar photocatalytic activity, self cleaning and electrocatalytic applications of rare earth metal tungstate coupled ZnO systems.
Experimental procedure
Materials
Zinc nitrate hexahydrate (Zn(NO3)2·6H2O), dysprosium nitrate hexahydrate Dy(NO3)3·6H2O, sodium tungstate dihydrate (Na2WO4·2H2O), oxalic acid dihydrate (C2H2O4·2H2O), methanol (CH3OH) (HPLC grade) were obtained from Himedia chemicals. Rhodamine-B (Rh-B, molecular formula C28H31ClN2O3 and molecular weight: 479.01), Trypan Blue (TB, molecular formula C34H28N6O14S4 and molecular weight: 872.88) from Colour Chem, Pondicherry and ZnO (surface area 5 m2 g−1, particle size 4.80 μm) from Merck chemicals were used as received. Deionized distilled water was employed throughout the experiments.Preparation of Dy2WO6-ZnO
1.649 g of Na2WO4·2H2O (0.05 M) was dissolved in 100 mL of deionized water. Under vigorous agitation, 0.243 g of Dy (NO3)3·6H2O solution (0.05 M) was added into the Na2WO4 solution at room temperature. The pH of the solution was adjusted to 10 with NaOH for the complete precipitation of Dy2WO6. The Dy2WO6 suspension was mixed with 100 mL of 0.4 M Zn(NO3)2·6H2O (11.90 g) solution and stirred for 30 min. 100 mL of oxalic acid in distilled water (0.6 M) was introduced to the above solution drop wise and stirred for 4 h to ensure complete precipitation of zinc oxalate. The mixed precipitate of zinc oxalate and Dy2WO6 was treated hydrothermally in a Teflon lined stainless steel autoclave at 115 °C for 12 h with the pressure of 18 psi. Hydrothermally treated precipitate was dried in air at 90 °C for 12 h and calcined at 450 °C for 12 h in a muffle furnace to obtain 3 wt% of Dy2WO6 in ZnO. In the above procedure, appropriate amounts of Dy(NO3)3·6H2O and Na2WO4·2H2O were used to get 1 wt% and 5 wt% of Dy2WO6 in ZnO.Catalyst characterization
X-ray diffraction (XRD) patterns were recorded with a Siemens D5005 diffractometer using Cu Kα (k = 0.151418 nm) radiation. Maximum peak positions were compared with the standard files to identity the crystalline phase. The surface morphology of the Dy2WO6-ZnO was studied by using a field emission scanning electron microscope (FE-SEM) and high resolution scanning electron microscope (HR-SEM) (Model ULTRA-55). EDS analysis was performed on gold coated samples using a FE-SEM (Model ULTRA-55). HR-TEM images were taken from 200 kV ultra high resolution transmission electron microscope (JEOL-2010). X-Ray photoelectron spectra (XPS) of the catalysts were recorded in an ESCA-3 Mark II spectrometer (VG Scientific Ltd, England) using Al Kα (1486.6 eV) radiation as the source. The spectra were referenced to the binding energy of C (1s) (285 eV). A Perkin Elmer LS 55 fluorescence spectrometer was employed to record the photoluminescence (PL) spectra at room temperature. Diffuse reflectance spectra were recorded with Shimadzu UV-2450. UV absorbance measurements were taken using Hitachi-U-2001 spectrometer. The water contact angles were measured using a Drop Shape Analyzer (DSA) (Kruass GmbH, Germany).Photocatalytic experiment
Photocatalytic experiments were performed under similar conditions on sunny days of April–May 2015 between 11 am and 2 pm. An open borosilicate glass tube of 40 cm height and 20 mm diameter was used as the reaction vessel. The suspensions were magnetically stirred in the dark for 30 min to attain adsorption–desorption equilibrium between the dye and Dy2WO6-ZnO. Irradiation was carried out in the open air condition. 50 mL of dye solution with Dy2WO6-ZnO was continuously aerated by a pump to provide oxygen and for the complete mixing of reaction solution. During the illumination time no volatility of the solvent was observed. Heat produced in the experiment was dissipated by natural convection using a cooling fan. After dark adsorption the first sample was taken. At specific time intervals, 2 mL of the sample was withdrawn and centrifuged to separate the catalyst. 1 mL of the centrifugate was diluted to 10 mL and its absorbance was measured at 259 and 236 nm for Rh-B and TB dyes respectively. The absorbance at 259 and 236 nm represents the aromatic content of Rh-B and TB respectively and the decrease indicates the degradation of dye. Solar light intensity was measured for every 30 min and the average light intensity over the duration of each experiment was calculated. The sensor was always set in the position of maximum intensity. The intensity of solar light was measured using LT Lutron LX-10/A Digital Lux meter and the intensity was 1250 × 100 ± 100 lux. The intensity was nearly constant during the experiments.Contact angle measurements
Coatings with catalysts and tetra ethoxyorthosilane (TEOS) were successfully fabricated on a glass substrates using spin coating method at room temperature. Catalysts coated substrates were sintered at 125 °C for 3 h with heating rate of 5 °C min−1 in programmed furnace to ensure densification of the gel network. A water droplet of 4 μL was placed on the coating and its water contact angle was measured. The average of 5 measurements is reported as the water contact angle (WCA) on the substrate.Electrochemical studies
Cyclic voltammetry (CV) was performed with a CHI660 electrochemical workstation (CH Instruments, USA). Cyclic voltammetry has three-electrodes, Ag/AgCl electrode as the reference electrode (saturated KCl reference electrode), a platinum wire as a counter electrode and the modified glassy carbon electrode (GCE) as the working electrode. GCEs were polished before the experiments in sequence with 1, 0.30 and 0.05 micron aluminium/water slurry on micro cloth pads, followed by careful cleaning in 1![[thin space (1/6-em)]](https://www.rsc.org/images/entities/char_2009.gif) :
:![[thin space (1/6-em)]](https://www.rsc.org/images/entities/char_2009.gif) 1 HNO3–H2O (v/v), ethanol, and water via ultrasonication. The working electrode was prepared by spraying the catalyst dispersed in iso-propyl alcohol. Cyclic voltammograms were obtained between +1.0 and −0.1 V at a scan rate of 50 mV s−1. All potentials were reported with respect to the reversible hydrogen electrode. The CO stripping voltammetry curves were obtained after adsorption of CO on catalysts at −0.2 V. For methanol electro-oxidation, 0.5 M methanol solution in 0.5 M NaOH solution was used as the electrolyte.
1 HNO3–H2O (v/v), ethanol, and water via ultrasonication. The working electrode was prepared by spraying the catalyst dispersed in iso-propyl alcohol. Cyclic voltammograms were obtained between +1.0 and −0.1 V at a scan rate of 50 mV s−1. All potentials were reported with respect to the reversible hydrogen electrode. The CO stripping voltammetry curves were obtained after adsorption of CO on catalysts at −0.2 V. For methanol electro-oxidation, 0.5 M methanol solution in 0.5 M NaOH solution was used as the electrolyte.
Results and discussion
Preliminary study on the degradation of Rh-B and TB with 1 wt%, 3 wt% and 5 wt% of Dy2WO6 in ZnO catalysts was carried out. The percentages of Rh-B degradation with 1, 3 and 5 wt% of Dy2WO6 in ZnO were found to be 68, 98 and 75 respectively for 75 minutes irradiation. The maximum efficiency (98%) was observed with 3 wt% Dy2WO6 in ZnO. Similar trend was observed for the degradation TB. Hence this 3 wt% Dy2WO6 in ZnO was characterized and used for further experiments.XRD can be used as an effective non destructive tool for qualitative and quantitative analysis of the phase structure. Fig. 1a shows XRD pattern of the prepared ZnO. The diffraction peaks of ZnO at 31.82, 34.55, 36.55, 47.84, 56.75, 62.74, 66.77, 67.85, 69.50, 72.77, and 77.32° correspond to (100), (002), (101), (101), (110), (103), (220), (112), (201), (004) and (202) planes of wurtzite ZnO (JCPDS card no. 36-1451).28 The new peaks appeared in the XRD patterns of 1, 3 and 5 wt% of Dy2WO6-ZnO as seen in Fig. 1b–d respectively. The 2θ values at 22.89, 23.74, 24.21, 28.70, 30.52, 38.26, 41.28, 53.85, 64.73 and 74.17 for the planes (011), (211), (130), (321), (231), (320), (132), (741), (441) and (622) in Fig. 1d (5 wt% Dy2WO6-ZnO) are due to the monoclinic body cantered structure of Dy2WO6 which is confirmed by JCPDS card no. 26-0595 and 01-079-1722.29,30 It should be noted in Fig. 1b–d that 2θ angles of (100), (002) and (101) planes for pure ZnO were gradually shifted to the lower diffraction values with increasing Dy2WO6 concentration. This is because of expansion of ZnO lattice caused by the larger radius of Dy3+ (0.91 Å) than that of Zn2+ (0.74 Å). The increase in lattice parameter and the shift to lower angle of the XRD peaks with increasing in Dy2WO6 concentration were expected to have the influence on the lattice deformation and strain resulting from Dy2WO6 doping.31,32 The Scherrer formula (eqn (1)) was used for the calculation of the average crystallite size of Dy2WO6-ZnO.
 | (1) |
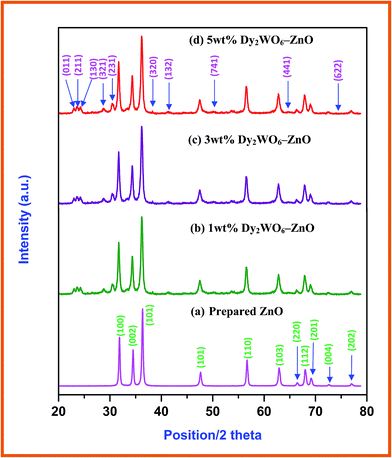 | ||
| Fig. 1 XRD patterns of (a) prepared ZnO, (b) 1 wt% Dy2WO6-ZnO, (c) 3 wt% Dy2WO6-ZnO and (d) 5 wt% Dy2WO6-ZnO. | ||
Electronic microscopy is a technique widely used in structural and chemical characterizations of materials. It provides information about morphology, grain size, chemical composition, crystallinity, and identification of the phases in the coated materials. Fig. 2 displays typical information about morphological features of the Dy2WO6-ZnO through FE-SEM and HR-SEM images. FE-SEM images of Dy2WO6-ZnO, shown in Fig. 2a and b, clearly prove that the pure Dy2WO6-ZnO has a highly ordered porous structure in three dimensions over a range of micrometers. The HR-SEM images (Fig. 2c) further confirm the prepared photocatalyst Dy2WO6-ZnO present in the form of combination of nanochain (Fig. 2d) and sandwich-like mesoporous microstructure clustered together (Fig. 2e). The size of Dy2WO6-ZnO clusters is around 100 nm. These different morphologies of Dy2WO6-ZnO may enhance photoactivity of the catalyst.
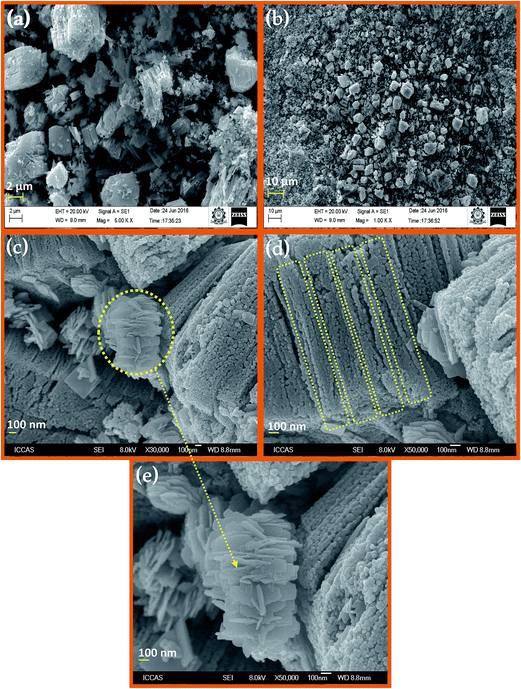 | ||
| Fig. 2 FESEM and HR-SEM images of Dy2WO6-ZnO (a) FE-SEM image at 2 μm, (b) 10 μm and 2 (c–e) HR-SEM images at 100 nm. | ||
Elemental composition of prepared Dy2WO6-ZnO was determined using energy dispersive X-ray (EDX) spectroscopy. FE-SEM elemental colour mapping (Fig. 3a) clearly depicts the distribution of Dy, Zn, W and O on the surface of the catalyst. From Fig. 3a, it is clear that Zn and O are present in higher density and there is a homogenous distribution of Dy, Zn, W and O. Thus elemental mapping reveals that catalyst is composed of Dy, Zn, W and O. Individual element contribution is displayed in Fig. 3b–e for Dy, Zn, W and O respectively. This also indicates the purity of the prepared catalyst Dy2WO6-ZnO. The EDX analysis (Fig. S2†) confirmed the constituents of Dy2WO6-ZnO as Dy, Zn, W and O with appropriate ratio.
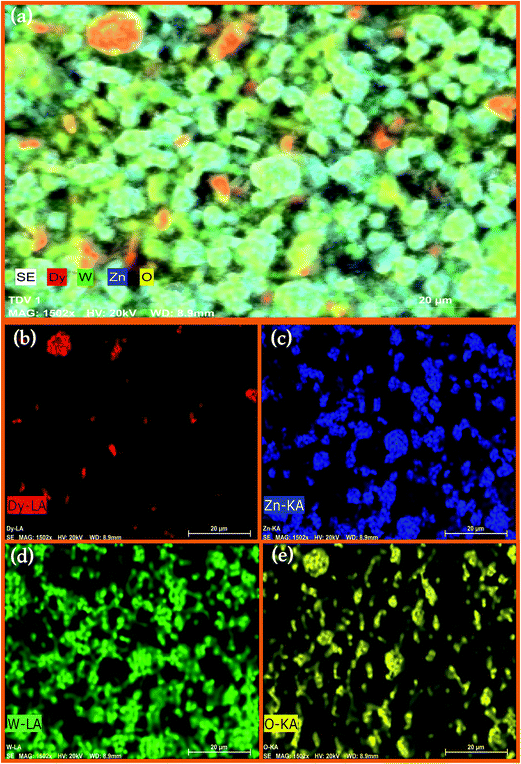 | ||
| Fig. 3 Elemental colour mapping images of Dy2WO6-ZnO (a) Dy2WO6-ZnO composition (b) Dy (c) Zn (d) W and (e) O. | ||
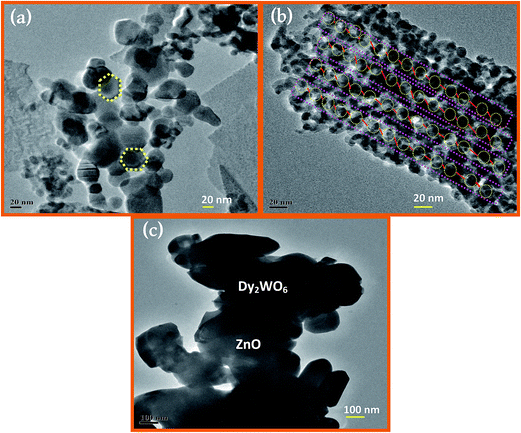
The FE-TEM images (Fig. 4a–c) reveal that the core and the shell are separated, and there is a strong contrast between the core (Dy2WO6-dark) and shell (ZnO-bright).33 As can be seen from Fig. 4a, prepared catalyst has particles with hexagonal structure. Fig. 4b clearly displays a large number of regular-shaped hollow spherical-like particles with a diameter of 20 nm. It further proves that the lattice structure of prepared photocatalyst Dy2WO6-ZnO is highly ordered. The sizes particles are in the range of 15 to 20 nm.
AFM images of Dy2WO6-ZnO with 5 μm × 5 μm regions are shown Fig. 5. They clearly indicate the surface roughness and porosity of the catalyst. The observation from AFM analyses confirms that the particles are nanosized. The existence of nanosized particles in the Dy2WO6 doped ZnO nanomaterial is more clearly reflected in its 2D AFM image (Fig. 5a). The surface roughness of the prepared Dy2WO6 doped ZnO is also shown in 3D AFM image (Fig. 5b). The average surface roughness was found as 87.4 nm. Higher surface roughness and lower size of the particle imply that the surface is highly porous in nature. The surface porosity and roughness in the photocatalysts permit the adsorption of dye molecules on to the surface, thereby increasing the photodegradation rate.
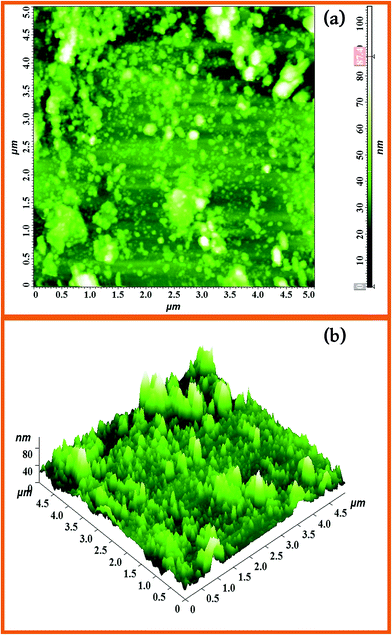 | ||
| Fig. 5 AFM images of the surface morphology of 5 μm × 5 μm region of the Dy2WO6-ZnO (a) 2D image and (b) 3D image of Dy2WO6-ZnO. | ||
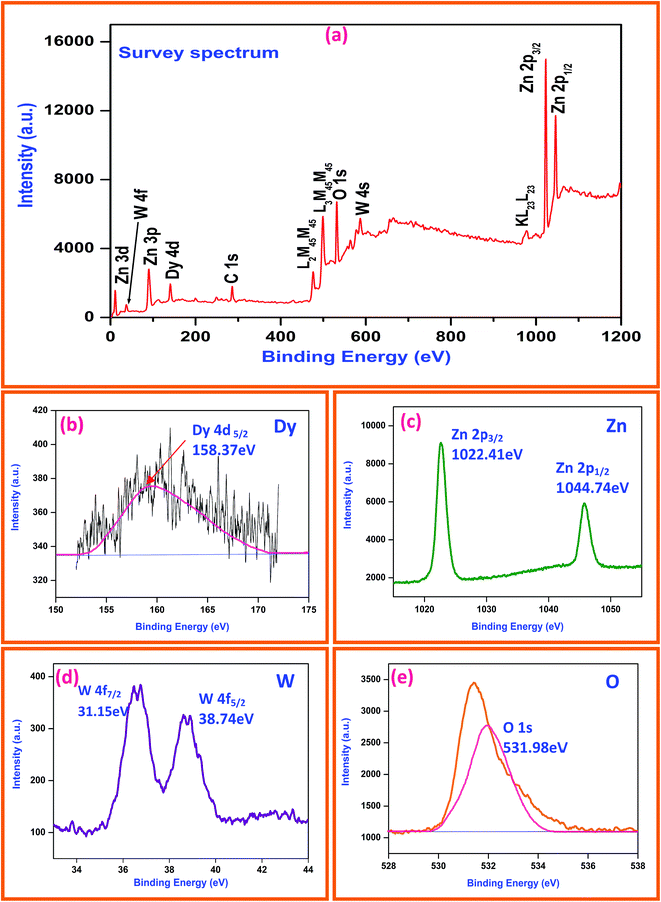
XPS is a selective and sensitive surface characterization technique to determine the chemical compositions of materials, and it is also effective in investigating the characteristics (valence) of the constituent atoms (ions) by monitoring their binding energies. Fig. 6a reveals the survey spectrum of Dy2WO6-ZnO photocatalyst and it mainly consists of dysprosium (Dy), zinc (Zn), oxygen (O), tungsten (W) along with weak carbon (C) peak and no peaks of other elements are observed. Fig. 6b shows the XPS binding energy peak at 158.37 eV for Dy 4d5/2. This indicates dysprosium (Dy) ion is present in +3 oxidation state.30 XPS spectra of Zn 2p is shown in Fig. 6c and the peak positions of Zn 2p1/2 and Zn 2p3/2 orbitals locate at 1044.74 and 1022.41 eV respectively.34 From these peaks, we can conclude that Zn is in the oxidation state of Zn2+. From the Fig. 6d we can observe that one set of lines for W (4f7/2) and W (4f5/2) at binding energies of 31.15 and 38.74 eV, respectively. The peak energies are consistent with W6+ standard peaks.35 Binding energy peak of O 1s is asymmetric and can be fitted to two symmetrical peaks (locating at 528.86 and 531.2 eV), for two different kinds of O species in the sample (Fig. 6e). These two peaks should be associated with the lattice oxygen (OL) of Dy2WO6-ZnO and chemisorbed oxygen (OH) caused by the surface hydroxyl groups.36
To find out the optical characteristics, UV-Vis diffuse reflectance and photoluminescence spectra for the ZnO and Dy2WO6-ZnO catalysts were recorded. Fig. S3† shows the DRS spectrum of Dy2WO6-ZnO. Any impurity in the semiconductor oxide can form intermittent band energy levels and this leads to the decrease of bandgap energy, which increases the UV-visible absorption. The prepared ZnO presents a sharp absorption edge at 380 nm. From the Fig. S3,† prepared photocatalyst shows an increased absorption over the undoped ZnO material both in the visible and the ultraviolet regions. Hence the band gap energy is reduced relative to prepared ZnO and it serves as a support to resist the recombination process together with the f orbitals of dysprosium tungstate, which traps the electrons excited during the photodegradation process. These would facilitate the reaction of the separated hole with the water molecules to produce OH free radicals, thus enhancing the efficiency of the photodegradation of the organic dye molecule by the prepared photocatalyst. UV-Vis spectra in the diffuse reflectance mode (R) were transformed to the Kubelka–Munk function F(R) to separate the extent of light absorption from scattering. The band gap energy was obtained from the plot of the modified Kubelka–Munk function (F(R)E)1/2 versus the energy of the absorbed light E (eqn (2))
 | (2) |
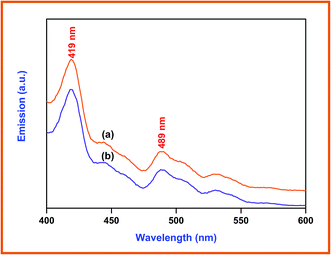
Photocatalysts generate electrons and holes after being activated by light, and recombination of some electrons and holes can release energy in the form of fluorescence emission. Lower fluorescence emission intensity implies lower electron–hole recombination rate. The fluorescence emission is mostly from the recombination of the photogenerated electron–hole pairs, and a strong correlation between PL intensity and photocatalytic activity has been previously reported.37 Fig. 7 presents the photoluminescence spectra of the prepared ZnO (a), and Dy2WO6-ZnO (b). The excitation wavelength is 380 nm and two emission bands occur at 419 and 489 nm. It can be seen that the positions of the peaks are similar, while PL intensities are different. The PL intensity of prepared ZnO at 419 nm, which is due to electron–hole recombination, is higher than Dy2WO6-ZnO. The electron capture by the loaded Dy2WO6 will decrease the electron–hole recombination and cause a decrease in emission intensity of Dy2WO6-ZnO as reported for Pr6O11-ZnO.23 Higher photocatalytic activity of Dy2WO6-ZnO reveals that the decrease in emission intensity is due to suppression of electron–hole recombination by the loaded Dy2WO6.15,38 Reduction in electron–hole recombination leads to the increased availability of electrons and holes for the production of radicals for degradation.
Photocatalytic activity of Dy2WO6 doped ZnO
Photocatalytic degradation of Rh-B under different conditions with increasing irradiation times is displayed in Fig. 8. Dye is resistant to self photolysis and for the same experiment with Dy2WO6 in the dark, a decrease (8%) in dye concentration was observed due to the adsorption of dye on the catalyst. Rh-B undergoes 98% degradation in the presence of Dy2WO6-ZnO under natural sunlight in 75 min. But, prepared ZnO, TiO2, TiO2–P25, and undoped Dy2WO6 shows 72%, 57%, 68% and 64% degradations, respectively in 75 min. These results show that prepared 3 wt% Dy2WO6-ZnO nanomaterial is most efficient for degradation of Rh-B dye than other photocatalysts (Fig. 8). 3 wt% Dy2WO6-ZnO shows higher activity (98%) than other 5 wt% Dy2WO6-ZnO (80%). It is obvious that the higher photocatalytic activity of Dy2WO6-ZnO is due to the support of Dy2WO6. To test the effectiveness of the catalyst on the degradations of other azo dyes, we had carried out the experiments on the degradation of TB under the same conditions. Fig. S4† shows the comparative studies of degradations of Rh-B and TB using Dy2WO6-ZnO at different irradiation times. Rh-B and TB undergo 98% and 94% degradation respectively in 75 min, revealing that this catalyst is efficient in the degradation of azo dyes.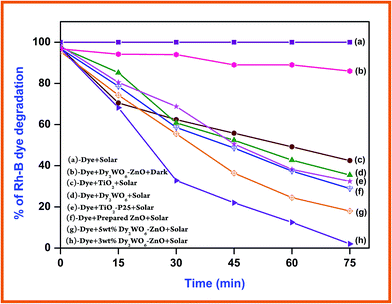 | ||
| Fig. 8 Primary analysis: Rh-B dye concentration = 3 × 10⁻⁴ M, catalyst suspended = 3 g L−1, pH = 7, airflow rate = 8.1 mL s−1 and irradiation time 75 min, Isolar = 1250 × 100 lux ± 100. | ||
The solution pH plays a crucial role in the photocatalytic degradation. The effect of pH on the photodegradation of Rh-B was studied in the pH range 3–11 and the results are shown in Fig. S5.† The degradation efficiency is high at pH 7 and it decreases when the pH is above or below 7. Low removal efficiency at acidic pH range may be due to the dissolution of ZnO in Dy2WO6-ZnO. It shows prepared catalyst is more advantageous than undoped ZnO in the degradation of Rh-B because it has maximum efficiency at the neutral pH 7.
The reusability of Dy2WO6-ZnO was tested for the degradation of Rh-B dye under the same reaction environment. After complete degradation, the catalyst was separated and washed with deionized water. The recovered catalyst was dried in hot air oven at 100 °C for 3 h and used for a second run. Fig. S6† shows the result of Rh-B degradation for four successive runs. Dy2WO6-ZnO gives enhanced activity in Rh-B dye degradation percentages as 98.0, 97.4, 96.0 and 96.0 for 75 min in the first, second, third and fourth run respectively. There is no significant change in the degradation efficiency of Dy2WO6-ZnO after second run.
Mechanism for dye degradation
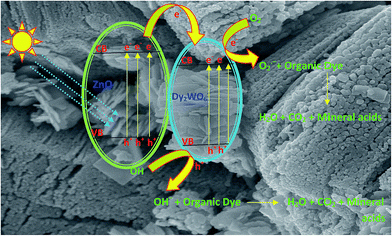
The dysprosium is a rare earth metal belongs to lanthanide group and the element possessing f shells and they are capable of trapping the electrons generated due to presence of f–f transition at visible light by the photocatalyst.39 The transitions of 4f electrons of lanthanides lead to the implementation of the optical adsorption of catalysts and support the separation of photogenerated electron–hole pairs. In the case of dysprosium dopant, it can exist as Dy3+ and Dy4+. Thus, Dy3+ may give an electron to O2 adsorbed on the surface of Dy2WO6-doped ZnO to form ˙O2− by transforming into Dy4+, favouring a charged migration to O2 and an enhancement of the photoreaction rate in comparison with that of pure ZnO.27 The mechanism of electron capture and transfer is displayed in Scheme 1. The decreased PL intensity in Dy2WO6-ZnO, reveals that the recombination of electron is suppressed by Dy2WO6 particles, indicating that an appropriate amount of Dy2WO6 could significantly reduce the irradiative recombination rate of photogenerated electrons and holes in ZnO. The band gap energy obtained by Kubelka–Munk function is comparatively lower than pure undoped ZnO. AFM studies also prove that the surface of the synthesized photocatalyst is very rough and porous in nature and this may assist the absorption of organic molecules on the surface of the catalyst.Electrochemical methanol oxidation
The electronic structure of the electrode greatly influences its electrocatalytic activity. It has been proved that the electro-oxidation of methanol is a surface-sensitive reaction. Pt and Ag/AgCl electrodes are normally used as the counter and reference electrodes, respectively. Fig. 9a and b shows the cyclic voltammograms (CVs) of glassy carbon electrode coated with prepared ZnO and Dy2WO6-ZnO, taken in N2 saturated 0.5 M NaOH solution at a scan rate of 50 mV s−1. Typical potential regions for hydrogen adsorption/desorption and the formation/reduction of surfaces of metal oxide or metal–OHads of ZnO, and Dy2WO6-ZnO are clearly seen in Fig. 9a and b.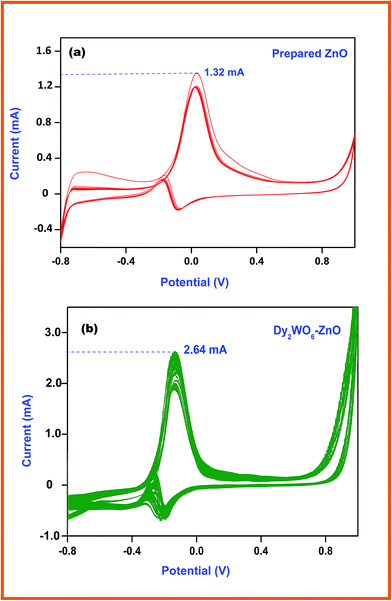 | ||
| Fig. 9 Cyclic voltammogram of (a) prepared ZnO (b) and Dy2WO6-ZnO in N2 and saturated 0.5 M NaOH + 0.5 M CH3OH solution at a scan rate of 50 mV s−1 at 25 °C. | ||
Anodic and cathodic reactions of methanol fuel cell are given below. Water is consumed at the anode and generated at the cathode. Electrons pass through externally from anode to cathode, producing the current.
| Anode: CH3OH + H2O → CO2 + 6H+ + 6e− |
| Cathode: O2 + 4H+ + 4e− → 2H2O |
| Overall: CH3OH + 3/2O2 → CO2 + 2H2O |
Fig. 9a shows the typical cyclic voltammograms of prepared ZnO for methanol electrochemical oxidation up to 20 segments. The current cathodic oxidation peak at −0.27 V (vs. Ag/AgCl) in the forward scan and the reduction peak appearing at −0.037 V correspond to the methanol oxidation and removal of the CO species adsorbed on the catalyst surface respectively. Therefore, the peak potential and current density of the forward anodic oxidation peak can be used to evaluate the catalytic activity of the electrocatalyst. Fig. 9b depicts cyclic voltammogram of Dy2WO6-ZnO, and it clearly explains the effect of Dy2WO6 on ZnO in methanol oxidation. The sharp anodic peak at −0.13 V due to oxidation of methanol and the current efficiency reached around 2.64 mA, which is two times higher than prepared ZnO (1.32 mA). This enhanced electrochemical activity of Dy2WO6-ZnO reveals that the catalyst will be useful in fuel cell application.
The electrochemical stability of the catalysts for methanol electro-oxidation was investigated by chronoamperometric experiments at −0.1 V in 0.5 M NaOH + 0.5 M CH3OH solution and the curves are shown in Fig. S7a–c.† All these catalysts initially show a rapid decrease in current for the oxidation of methanol, and then a relatively steady current is achieved. The rapid current decay is due to the poisoning of intermediate and various poisoning species formed during methanol oxidation reaction in alkaline medium.40,41 It is clear from the Fig. S7a† that the current decay for the reaction on the Dy2WO6-ZnO nanomaterial is significantly less (4.8 mA to 2.64 mA) than that on the prepared ZnO (Fig. S7c,† 4.8 mA to 1.5 mA) and Dy2WO6 (Fig. S7b,† 4.8 mA to 2.1 mA) and the steady current is reached at 2.64 mA for Dy2WO6-ZnO. This indicates that Dy2WO6-ZnO attained stability earlier than other catalysts and the improvement in the electrochemical constancy for methanol electro-oxidation in alkaline medium.
Contact angle measurements
Surface non-wettability or the hydrophobicity of the catalyst is exposed by water contact angle. If a surface has a contact angle with water that is greater than 90°, then the surface is classed as hydrophobic and if the contact angle is less than 90°, the surface is hydrophilic. Water contact angles were determined using glass slides coated with TEOS, TEOS + ZnO and TEOS + Dy2WO6-ZnO to investigate the hydrophobicity of the catalysts. Fig. 10 shows the images of water drops on coated and uncoated glass slides. Water contact angle (WCA) of 28.5° on uncoated glass slide shows the hydrophilicity and this WCA increases gradually on glass slides coated with TEOS (50.2°), TEOS + ZnO (73.6°) and TEOS + Dy2WO6-ZnO (98.9°). Surface coated with TEOS + Dy2WO6-ZnO has more hydrophobic character. In TEOS, the O–Si–O groups are modified by Dy2WO6-ZnO to make the surface rougher, stable and non-wettable. Hence the contact angle increases above 90° exhibiting the hydrophobicity of the catalyst. This surface non-wettability leads to a self cleaning property of the catalyst.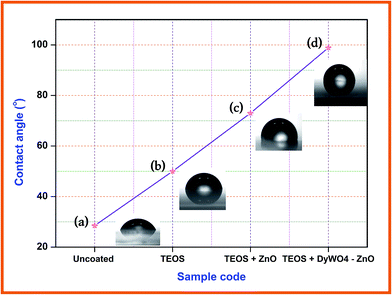 | ||
| Fig. 10 Water contact angle measurements (a) uncoated glass slide, (b) TEOS coated glass slide, (c) TEOS + ZnO coated glass slide and (d) TEOS + Dy2WO6-ZnO coated glass slide. | ||
Conclusion
In conclusion, a new sunlight active Dy2WO6-ZnO photocatalyst was synthesized by a simple hydrothermal-thermal decomposition method and characterized by the various analytical techniques. The XRD pattern confirms that ZnO has wurtzite structure with good crystallinity and Dy2WO6 has body-centered monoclinic structure with crystallite size of 18.5 nm. The HRSEM images of Dy2WO6-ZnO indicate a sandwich-like microstructure loosely clustered together, and the average size of Dy2WO6-ZnO particles is about 100 nm. FETEM further proves the morphology of prepared Dy2WO6 doped ZnO as hexagonal and regular sphere shaped particles. Elemental colour mapping studies reveal the homogeneous distribution of Dy, Zn, W and O in the catalyst. Dy2WO6-ZnO shows enhanced activity in the degradation of azo dyes Rh-B and TB compared to the prepared ZnO, Dy2WO6, TiO2, and TiO2–P25. This catalyst was found to be stable and reusable. Electrocatalytic activity of Dy2WO6-ZnO exhibited enhanced current production by electrochemical methanol oxidation under room temperature. Hydrophobicity of Dy2WO6-ZnO makes it useful for industrial self-cleaning material.Acknowledgements
Authors are thankful to the CSIR, New Delhi, for the financial support through research Grant no. 02 (0144)/13/EMR-II. Authors are grateful to International Research Centre, Kalasalingam University for FESEM facility.References
- M. R. Hoffmann, S. T. Martin, W. Choi and D. W. Bahnemann, Chem. Rev., 1995, 95, 69–96 CrossRef CAS.
- M. Muruganandham, R. P. S. Suri, M. Sillanpaa, J. J. Wu, B. Ahmmad, S. Balachandran and M. Swaminathan, J. Nanosci. Nanotechnol., 2014, 14, 1898–1910 CrossRef CAS PubMed.
- G. Kumar, R. Kumar, S. W. Hwang and A. Umar, J. Nanosci. Nanotechnol., 2014, 14, 7161–7166 CrossRef CAS PubMed.
- D. Zhang and F. Zeng, J. Mater. Sci., 2012, 47, 2155–2161 CrossRef CAS.
- Z. F. Wu, K. Cheng, F. Zhang, R. F. Guan, X. M. Wu and L. J. Zhuge, J. Alloys Compd., 2014, 615, 521–525 CrossRef CAS.
- V. Rajendar, T. Dayakar, K. Shobhan, I. Srikanth and K. V. Rao, Superlattices Microstruct., 2014, 75, 551–563 CrossRef CAS.
- W. H. Kim and J. Y. Son, Mater. Lett., 2014, 133, 101–104 CrossRef CAS.
- R. Yousefi, F. J. Sheini, M. Cheraghizade, S. K. Gandomani, A. Sáaedi, N. M. H. W. J. Basirun and M. Azarang, Mater. Sci. Semicond. Process., 2015, 32, 152–159 CrossRef CAS.
- S. Xiao, L. Zhao and J. Lian, Catal. Lett., 2014, 144, 347–354 CrossRef CAS.
- P. V. Adhyapak, S. P. Meshram, A. A. Pawar, D. P. Amalnerkar, U. P. Mulik and I. S. Mulla, Ceram. Int., 2014, 40(8), 12105–12115 CrossRef CAS.
- N. C. S. Selvam, S. Narayanan, L. John Kennedy and J. Judith Vijaya, J. Environ. Sci., 2013, 25(10), 2157–2167 CrossRef CAS.
- N. Guy, S. Çakar and M. Ozacar, J. Colloid Interface Sci., 2016, 466, 128–137 CrossRef CAS PubMed.
- R. Saravanana, H. Shankara, T. Prakasha, V. Narayanan and A. Stephen, Mater. Chem. Phys., 2011, 125, 277–280 CrossRef.
- X. Zhang, X. Lu, Y. Shen, J. Han, L. Yuan, L. Gong, Z. Xu, X. Bai, M. Wei, Y. Tong, Y. Gao, J. Chen, J. Zhou and Z. L. Wang, Chem. Commun., 2011, 47, 5804–5806 RSC.
- S. Balachandran and M. Swaminathan, J. Phys. Chem. C, 2012, 116, 26306–26312 CAS.
- S. Balachandran, N. Prakash, K. Thirumalai, M. Muruganandham, M. Sillanpaa and M. Swaminathan, Ind. Eng. Chem. Res., 2014, 53(20), 8346–8356 CrossRef CAS.
- E. T. Deva Kumar, K. Thirumalai, R. Aravindhan, M. Swaminathan, J. Raghava Rao and B. U. Nair, RSC Adv., 2015, 5, 60926–60937 RSC.
- G. Colon, S. Murcia Lopez, M. C. Hidalgo and J. A. Navio, Chem. Commun., 2010, 46, 4809–4811 RSC.
- D. Li, R. Shi, C. Pan, Y. Zhu and H. Zhao, CrystEngComm, 2011, 13, 4695–4700 RSC.
- B. Hu, L. H. Wu, S. J. Liu, H. B. Yao, H. Y. Shi, G. P. Li and S. H. Yu, Chem. Commun., 2010, 46, 2277–2279 RSC.
- N. Tian, Y. Zhang, H. Huang, Y. He and Y. Guo, J. Phys. Chem. C, 2014, 118, 15640–15648 CAS.
- Z. Zhang and W. Wang, Dalton Trans., 2013, 42, 12072–12074 RSC.
- S. Balachandran, K. Thirumalai and M. Swaminathan, RSC Adv., 2014, 4, 27642–27653 RSC.
- L. Honglin, L. Yingbo, L. Jinzhu and Y. Ke, J. Alloys Compd., 2014, 617, 102–107 CrossRef.
- M. Khatamian, A. A. Khandar, B. Divband, M. Haghighi and S. Ebrahimiasl, J. Mol. Catal. A: Chem., 2012, 365, 120–127 CrossRef CAS.
- P. V. Korake, A. N. Kadam and K. M. Garadkar, J. Rare Earths, 2014, 32(4), 306–313 CrossRef CAS.
- A. Khataee, R. D. C. Soltani, Y. Hanifehpour, M. Safarpour, H. G. Ranjbar and S. W. Joo, Ind. Eng. Chem. Res., 2014, 53, 1924–1932 CrossRef CAS.
- U. Ozgur, Y. I. Alivov, C. Liu, A. Teke, M. A. Reshchikov, S. Dogan, V. Avrutin, S. J. Cho and H. Morkoc, J. Appl. Phys., 2005, 98, 041301 CrossRef.
- M. M. Ivanova and E. M. Reznik, Inorg. Mater., 1972, 8, 863–867 Search PubMed.
- G. A. Suganya Josephine and A. Sivasamy, Environ. Sci. Technol. Lett., 2014, 1, 172–178 CrossRef.
- H. Huang, Y. Ou, S. Xu, G. Fang, M. Li and X. Z. Zhao, Appl. Surf. Sci., 2008, 254, 2013–2016 CrossRef CAS.
- H. Huang, X. Ruan, G. Fang, M. Li and X. Z. Zhao, J. Phys. D: Appl. Phys., 2007, 40, 7041–7045 CrossRef CAS.
- Y. He, J. Cai, T. Li, Y. Wu, Y. Yi, M. Luo and L. Zhao, Ind. Eng. Chem. Res., 2012, 51, 14729–14737 CrossRef CAS.
- S. A. Ansari, M. M. Khan, M. O. Ansari, J. Lee and M. H. Cho, J. Phys. Chem. C, 2013, 117, 27023–27030 CAS.
- P. Biloen and G. T. Pott, X-ray photoelectron spectroscopy study of supported tungsten oxide, J. Catal., 1973, 30, 169–174 CrossRef CAS.
- J. J. F. Moudler, W. F. Stickle, P. E. Sobol and K. D. Bomben, Handbook of X-ray Photoelectron Spectroscopy, ed. J. Chastain and R. C. King Jr, Physical Electronics Division, Perkin– Elmer Corp, Eden Prairie, MN, 1995 Search PubMed.
- F. B. Li and X. Z. Li, Appl. Catal., A, 2002, 228, 15–27 CrossRef CAS.
- B. Subash, B. Krishnakumar, M. Swaminathan and M. Shanthi, J. Mol. Catal. A: Chem., 2013, 366, 54–63 CrossRef CAS.
- G. A. Suganya Josephine and A. Sivasamy, Appl. Catal., B, 2014, 150–151, 288–297 CrossRef.
- H. Li, G. Chang, Y. Zhang, J. Tian, S. Liu, Y. Luo, A. M. Asiri, A. O. Al-Youbi and X. Sun, Catal. Sci. Technol., 2012, 2, 1153–1156 CAS.
- K. Thirumalai, S. Balachandran and M. Swaminathan, Mater. Chem. Phys., 2016, 183, 191–200 CrossRef CAS.
Footnote |
| † Electronic supplementary information (ESI) available. See DOI: 10.1039/c6ra24843h |
| This journal is © The Royal Society of Chemistry 2017 |

