 Open Access Article
Creative Commons Attribution 3.0 Unported Licence
Facile synthesis of low-cost biomass-based γ-Fe2O3/C for efficient adsorption and catalytic degradation of methylene blue in aqueous solution†
Tao Chen,
Yuhao Xiong,
Yuemei Qin,
Haiguan Yang,
Peng Zhang and
Fanggui Ye *
*
State Key Laboratory for the Chemistry and Molecular Engineering of Medicinal Resources, College of Chemistry and Pharmaceutical Science of Guangxi Normal University, Guilin 541004, P. R. China. E-mail: fangguiye@163.com; Fax: +86-773-5832294; Tel: +86-773-5856104
First published on 23rd December 2016
Abstract
In this study, a novel and low-cost method was developed for synthesizing magnetic porous γ-Fe2O3/C as an adsorbent and catalyst for removal of methylene blue (MB) from aqueous solution. Using FeCl3·6H2O and bagasse as the precursor, the biomass-based material was synthesized rapidly using a microwave heating process. Fe ions were introduced to achieve both adsorption and catalytic degradation by the Fenton reaction. Characterization by BET, XRD, SEM, and TEM indicated that the prepared γ-Fe2O3/C material exhibited homogeneous mesoporosity with a BET surface area, mesoporous volume, and saturation magnetization of 764.116 m2 g−1, 0.54 cm3 g−1, and 17.1 emu g−1, respectively. The material exhibited excellent adsorption and catalytic degradation abilities for removal of MB from aqueous solution (up to 352.96 mg g−1), with complete degradation of MB within 30 min. Moreover, γ-Fe2O3/C had good stability over 5 cycles. Therefore, this biomass-based γ-Fe2O3/C material can be used as a highly effective and low-cost adsorbent and catalyst and has great potential application in clean-up processes for environmental pollutants.
1. Introduction
With the development of society, water pollution has become increasingly serious. The most serious pollution is derived from colored organic dye contamination. Pollution sources include a variety of manufacturing, printing, and dyeing industries. Industrial production consumes as much as 7 × 10⁵ t of colored organic dyes each year,1,2 and thus large amounts of colored pollutants are produced. Organic dyes are difficult to break down under natural conditions because of their stability, and can cause great harm to the environment.3 For these reasons, investigation of effective purification methods for removal of organic dye pollutants from solution is important for the protection of human health and social and economic stability.Simple and rapid methods to prepare inexpensive materials for removal of environmental pollutants are required to meet the increasingly stringent environment standards. There are many methods to remove environmental pollutants. In particular, adsorption and degradation methods have attracted considerable attention due to the excellent adsorption capacity of adsorbents and efficient catalytic performance of catalysts, respectively.4,5 However, there are concerns to do with the preparation of such materials.
Activated carbon (AC) is a typical effective absorbent that is widely used for the removal of organic compounds from wastewater due to its large specific surface area and developed porous structure.6–8 However, traditional AC materials are difficult to recycle because the traditional separating method is inconvenient.9 Fortunately, this problem can overcome by using magnetic separation methods, which can provide efficient and rapid pollutant removal from wastewater.10
Moreover, readily available and low-cost precursor materials have been studied, such as biomass and agricultural by-products or waste, to reduce the cost of AC.11 Functional porous materials are widely used in environmental clean-up processes.12–15 Many inexpensive carbon precursors have been reported, such as rosa fruits, rice husks, coffee waste residue, peanut shells, grape stalks, waste wood shavings, and corncobs.16–19 Most of these materials are produced by carbonization and activation, which requires carbonization in a muffle furnace or other instrument under the suitable conditions, such as air and carbon dioxide, followed by impregnation of the precursor with an activation medium and then heat treatment at a high temperature under an inert atmosphere. In contrast, using microwave heating as the heating source, imparts the synthesis of AC materials with green characteristics, as this technique provides fast carbonization and high efficiency heating.20
Microwave heating is a convenient method that can realize the carbonization process under mild conditions due to the uniqueness of its heating process.21 Microwave heating is also a uniform and efficient heating approach that can greatly reduce the synthesis time and provide better carbonization results.20 This process has already been successfully used in the synthesis of various biomass-based materials. For example, a porous biomass-based adsorbent prepared by the microwave heating approach with banana as a precursor possessed a favourable methylene blue (MB) adsorption capacity.15 Meanwhile, the catalytic degradation of colored pollutants in water clean up processes has attracted much attention due to the efficient catalytic performance. The most extensively used degradation method is the Fenton process, which is an advanced oxidation process (AOP) that uses Fe2+ and H2O2 to generate a powerful oxidant.5 This process has received considerable attention in the cleanup of wastewater due to the highly activity and stability of the catalyst.22 Moreover, the Fenton process has also successfully been used in the preparation of porous magnetic carbon materials.23 Therefore, the discovery a rapid and simple method to prepare biomass-based activated carbon materials, which have both good adsorption and degradation performance, has great application value.
In this work, we used the waste bagasse as an AC precursor, and introduced Fe ions by a one-step method by steeping the precursor in a FeCl3·6H2O aqueous solution. The porous γ-Fe2O3/C material was prepared by a microwave heating process within 4 min. The porous material has excellent properties that combine both adsorption and catalytic degradation by the Fenton reaction. When used as an adsorbent to remove MB from aqueous solution, γ-Fe2O3/C exhibited an excellent adsorption ability of 352.96 mg g−1. In addition, the material realized the catalytic degradation of MB in the presence of H2O2 and NH2OH,5 which can further decrease the time of the MB removal. However, to the best of our knowledge, there are few previous reports on the synthesis of activated biomass-based porous carbon materials that combine carbonization via the microwave heating approach with the catalytic degradation process. Therefore, this effective and inexpensive bagasse-based γ-Fe2O3/C material has a tremendous competitive advantage and great application value in cleanup processes for environmental pollutants.
2. Experimental
2.1 Reagents and materials
Zinc chloride (ZnCl2), ferric chloride hexahydrate (FeCl3·6H2O), 5-sulfosalicylic acid dihydrate (C7H6O6S·2H2O), and hydrogen peroxide (H2O2) were supplied by Aladdin (Shanghai, China). Hydroxylamine (NH2OH) was supplied by Energy Chemical (Shanghai, China). Sodium hydroxide (NaOH), hydrochloric acid (HCl), and methylene blue (MB) were supplied by Sinopharm Chemical Reagent Co., Ltd. (Shanghai, China). All of these chemicals were of at least analytical reagent grade and used without further purification. MB stock solutions (1000 mg L−1) were prepared and further diluted to the required concentrations to examine the adsorption capacity and the adsorption process. Ultrapure water was obtained from a Millipore purification system (Bedford, MA, USA) and used to prepare all aqueous solutions.2.2 Instrumentation
X-ray diffraction (XRD) patterns of the γ-Fe2O3/C material were recorded using a D/max 2550 VB/PC diffractometer (Rigaku, Japan). X-ray photoelectron spectroscopy (XPS) data were obtained with a Thermo ESCALAB 250XI electron spectrometer (Thermo, USA) using 150 W Al Ka radiation. Fourier transform infrared (FT-IR) spectra (4000–400 cm−1) in KBr were obtained using a PE Spectrum One FT-IR spectrometer (PE, USA). The morphologies and microstructures of γ-Fe2O3/C were characterized by field emission scanning electron microscopy (SEM) (NoVaTM Nano SEM 430, FEI, USA) and transmission electron microscopy (TEM) (Tecnai G20, FEI, USA). The specific surface areas of γ-Fe2O3/C were calculated using the Brunauer–Emmett–Teller (BET) method. Nitrogen adsorption and desorption at 77 K was carried out using an adsorption instrument (3Flex, Micromeritics, USA), and the pore structures, pore size distributions, and pore volumes were analyzed by the Barrett–Joyner–Halenda (BJH) method. The magnetization curves were measured at 300 K under a magnetic field (in the range of −20 and 20 kOe) using an MPMS-XL-7 magnetometer (Quantum Design, USA). Raman spectra were obtained using an inVia spectrometer (Renishaw, UK). Thermogravimetric analysis (TGA) was performed with a LABSYS evo TG-DSC/DTA instrument (Setaram Instrumentation, France) under air at a heating rate of 20 °C min−1.2.3 Preparation of γ-Fe2O3/C
Bagasse was gathered from a local fruit market (Guilin, China), and then dried overnight at 80 °C in oven and ground into 60/200 meshes by herbal medicine grinding machines (FW-135, TianJin, China). Then a certain quantity of bagasse powder (1.000 g) and FeCl3·6H2O (0, 0.500, 1.000, 1.500, and 2.000 g) was immersed in ultrapure water at 70 °C in thermostated water bath (DHG-9036A, Shanghai, China) for 24 h. The sample was strained and there served solids were dried at 70 °C in oven. After that, ZnCl2 was added to the Fe loaded bagasse powder (the mass ratio of ZnCl2 and Fe loaded bagasse powder was 1![[thin space (1/6-em)]](https://www.rsc.org/images/entities/char_2009.gif) :
:![[thin space (1/6-em)]](https://www.rsc.org/images/entities/char_2009.gif) 4, g g−1). Then the mixture of ZnCl2 and Fe loaded bagasse powder were uniformly grind and reacted in a microwave reactor (600 W, Glanz WD800BL23, Shenzhen, China) for 2–6 minutes. The obtained solid was washed with ultrapure water, ethyl alcohol, and hydrochloric acid three times, respectively. Finally, the material was isolated from aqueous solution using an external magnetic field and dried in a vacuum oven at 80 °C for 24 h.
4, g g−1). Then the mixture of ZnCl2 and Fe loaded bagasse powder were uniformly grind and reacted in a microwave reactor (600 W, Glanz WD800BL23, Shenzhen, China) for 2–6 minutes. The obtained solid was washed with ultrapure water, ethyl alcohol, and hydrochloric acid three times, respectively. Finally, the material was isolated from aqueous solution using an external magnetic field and dried in a vacuum oven at 80 °C for 24 h.
2.4 Adsorption and degradation experiments
The effects of other conditions, such as initial concentration, FeCl3·6H2O and bagasse ratio (g g−1), microwave carbonization time, pH value, and contact time, were also studied. The adsorption quantity at equilibrium (qe, mg g−1) was calculated using the following relationship:
3. Results and discussion
3.1 Synthesis and characterization of γ-Fe2O3/C
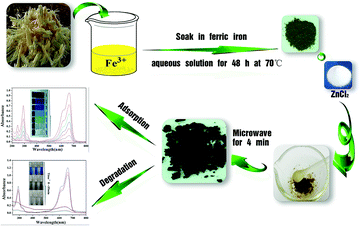
As illustrated in Scheme 1, bagasse were rich in cellulose, and thus contains a large number of −OH and −COOH groups, which would be a good carbon framework source and can strongly interact with Fe3+. After dipping bagasse in Fe3+ aqueous solution for 48 h at 70 °C with the mass ratios of Fe-based bagasse was 0.5![[thin space (1/6-em)]](https://www.rsc.org/images/entities/char_2009.gif) :
:![[thin space (1/6-em)]](https://www.rsc.org/images/entities/char_2009.gif) 1 (g g−1). The bagasse-Fe precursor was obtained after filtration and drying of the solid. After adding ZnCl2 and carbonization by microwave heating for 4 min, Fe3+ was oxidized to γ-Fe2O3, as described in our previous studies.24,25 Finally, the obtained powder (from the optimal preparation conditions) was further processed by drying and grinding. Then, the following data was come from the material above.
1 (g g−1). The bagasse-Fe precursor was obtained after filtration and drying of the solid. After adding ZnCl2 and carbonization by microwave heating for 4 min, Fe3+ was oxidized to γ-Fe2O3, as described in our previous studies.24,25 Finally, the obtained powder (from the optimal preparation conditions) was further processed by drying and grinding. Then, the following data was come from the material above.
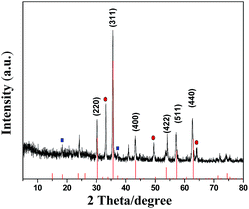
As shown in Fig. 1(a) XRD patterns of the γ-Fe2O3/C materials match well with the Standard PDF card of γ-Fe2O3. The crystalline structures of γ-Fe2O3/C were characterized using a powder XRD technique. The main characteristic peaks of γ-Fe2O3 appeared around 33.2°, 35.56°, 43.26°, 54.18°, 57.16° and 62.64°, which correspond to the (220), (311), (400), (422), (511), and (440) planes (JCPDS card no. 39-1346). In addition to the standard characteristic peaks of γ-Fe2O3, there were several additional peaks (marked with “●” and “■”) in the XRD patterns, which could be attributed to the spinel lattice of ZnO and ZnCl2.26 This could be because of these species cannot be washed out by using 0.01 M HCl and 0.01 M NaOH.
However, it was difficult to clearly distinguish the γ-Fe2O3 and other iron oxide phase from the XRD pattern as they exhibit similar peaks. Thus, the chemical compositions of the pre-preparation material were further analyzed by XPS to clearly demonstrate that the magnetic composition was γ-Fe2O3.
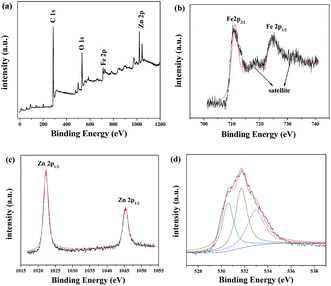
A typical survey spectrum of γ-Fe2O3/C was depicted in Fig. 2(a), and showed the presence of O, C, Zn, and Fe elements. The high-resolution spectrum of Fe was shown in Fig. 2(b): the XPS spectra exhibited the peaks at 711.0 eV and 724.5 eV, which were the characteristic peaks of Fe 2p3/2 and Fe 2p1/2 oxidation states. And there were two obvious shake-up satellite structures at the higher binding energy sides of both main peaks, which were characteristic of γ-Fe2O3.27,28 As show in Fig. 1(c), it can be observed that two characteristic peaks arising at 1022.3 and 1045.4 eV corresponding to orbitals of Zn 2p3/2 and Zn 2p1/2 respectively, confirmed the existence of ZnO.29 The O 1s peak in Fig. 2(d) can be deconvoluted into three peaks by the XPS peak fitting program. The peaks at 530.5 and 532.9 eV can be attributed to O in γ-Fe2O3 and ZnO respectively,30,31 and the peak at 531.7 eV should be assigned to surface oxygen, which can be described as surface oxygen species “O−”.32
Fig. S1(a)† showed the TGA curves of γ-Fe2O3/C. The main weight-loss stage was due to destruction of the carbon structures of the samples at temperature up to about 270 °C. These measurements indicated that the carbon content of γ-Fe2O3/C was 16%. The magnetization of γ-Fe2O3/C was determined by MPMS measurements. In Fig. S1(b),† The saturation magnetization (MS) value of γ-Fe2O3/C-1 and -2 was 17.1 emu g−1 and 145.6 emu g−1. Using an external magnetic field, the magnetization of γ-Fe2O3/C was adequate to realize rapid separation of the adsorbent from solution.
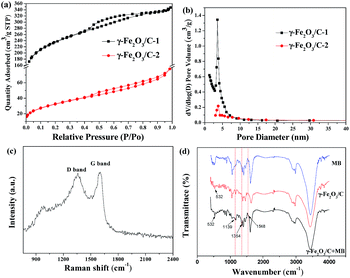
The N2 adsorption–desorption isotherms of γ-Fe2O3/C-1 and -2 was shown in Fig. 3(a). This material exhibits type II isotherms, which indicated that this material was mesoporous. The BET surface areas and pore volumes of γ-Fe2O3/C-1 and -2 were 746.116 m2 g−1, 114.782 m2 g−1, and 0.54 cm3 g−1, 0.12 cm3 g−1, respectively (Table S1†). The data showed that γ-Fe2O3/C-1 had larger specific surface area with the FeCl3 impregnation ratio was 0.5![[thin space (1/6-em)]](https://www.rsc.org/images/entities/char_2009.gif) :
:![[thin space (1/6-em)]](https://www.rsc.org/images/entities/char_2009.gif) 1. Thus, these parameters also indicate that the prepared γ-Fe2O3/C possesses excellent surface performance properties. Owing to the high surface areas, γ-Fe2O3/C will inevitably have a satisfactory adsorbing capability.
1. Thus, these parameters also indicate that the prepared γ-Fe2O3/C possesses excellent surface performance properties. Owing to the high surface areas, γ-Fe2O3/C will inevitably have a satisfactory adsorbing capability.
Using the BJH method to estimate the poresize of γ-Fe2O3/C-1 and -2, as shown in Fig. 3(b), the maximum pore diameter of γ-Fe2O3/C occurred at approximately 2.81 and 3.41 nm. This result also suggested that γ-Fe2O3/C is a mesoporous material.
The structure of the carbon phase of γ-Fe2O3/C was investigated using Raman spectroscopy. As show in Fig. 3(c), two broad peaks with similar intensities appeared at about 1357 and 1598 cm−1, and were assigned to the defect sp3 carbon band (D band) and stretching vibrations of basal graphite layers (G band), respectively.33,34 In addition, the information from XRD also indicated that the carbon structure in this sample was amorphous. The adsorption of MB by this sample was also investigated using FT-IR, as shown in Fig. 3(d). The characteristic peaks at 1139, 1354 and 1548 cm−1 are typical of C–S bond, C–N bond, and C![[double bond, length as m-dash]](https://www.rsc.org/images/entities/char_e001.gif) N bond stretching, respectively, and indicate that MB was successfully adsorbed on γ-Fe2O3/C.
N bond stretching, respectively, and indicate that MB was successfully adsorbed on γ-Fe2O3/C.
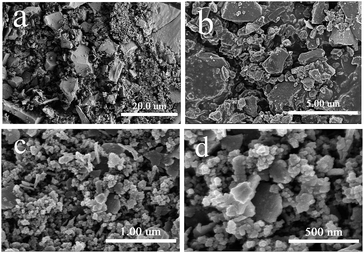
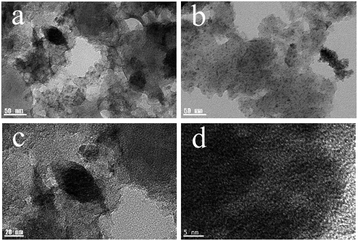
The morphology and microstructure of the materials was characterized by SEM and TEM. The SEM images (Fig. 4) showed that the surface of material has amount of porous structures between the particles. The TEM images (Fig. 5) indicated that there were ultrafine γ-Fe2O3 particles on the material, which was beneficial for magnetic separation.
The elemental mapping of γ-Fe2O3/C revealed the distribution of the four elements within the structures (Fig. 6). In particular, Fe was uniformly distributed in γ-Fe2O3/C.
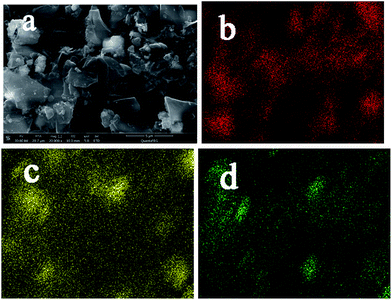 | ||
| Fig. 6 Elemental mapping of the homogenous dispersion of (a) original images; (b) O elements; (c) Fe elements; (d) C elements in γ-Fe2O3/C. | ||
Considering the results supported by FT-IR, SEM, TEM and XRD et al., we can conclude that the porous γ-Fe2O3/C material that consists of γ-Fe2O3 was successfully synthesized.
3.2 Adsorption of MB
MB was employed as a model pollutant to evaluate the adsorption performance of the prepared γ-Fe2O3/C adsorbents. γ-Fe2O3/C (0.010 g) was added to 5 mL of MB aqueous solution with an initial concentration of 50, 100, 200, 400, or 800 mg g−1 at pH 7.0. The adsorption experiments were carried out at 303 K in a thermostated water bath. The factors that influence the adsorption process, such as the proportion of impregnation, carbonization time, initial dye concentration, and the contact time, were studied. As shown in Fig. 7, the adsorbed amount of MB significantly increased over the initial 8 h.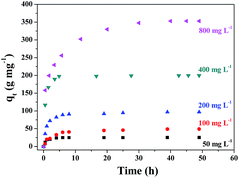 | ||
| Fig. 7 Effect of contact time on the adsorption of MB onto γ-Fe2O3/C (10 mg) at different initial concentrations of MB at 30 °C. | ||
Moreover, when the initial concentration was increased, the adsorbed amount of MB increased, which indicates the excellent adsorption capacity at high MB concentrations in aqueous solution. The proportion of FeCl3 and the microwave carbonization time also influenced the adsorption quantity. In Fig. S2(a),† the adsorption quantity decreased with an enhancement of the FeCl3 impregnation ratio. The data showed that the FeCl3 impregnation ratio had greatly influenced the composite structure/porosity. In contrast, the magnetic performance improved at higher FeCl3 impregnation ratios (Fig. S1(b)†). Therefore, after considering the influence of the adsorption capacity in comparison with the magnetic performance, an impregnation proportion of 0.5![[thin space (1/6-em)]](https://www.rsc.org/images/entities/char_2009.gif) :
:![[thin space (1/6-em)]](https://www.rsc.org/images/entities/char_2009.gif) 1 (g g−1) was chosen.
1 (g g−1) was chosen.
The time of microwave heating process directly determined the construction of the carbon material.21 With the appropriate microwave treatment processing time, the material rapidly produced well-developed hole structures (Fig. S2(b)†). However, the adsorption capacity was significant decreased at extended processing times. It might be that excessive microwave heating destroys the structure of active carbon. Therefore, we chose a processing time of 4 min.
The pH value of the adsorption system can greatly influence the charge of both the surface of the adsorbent and the adsorbate. Therefore, it was necessary to the impact of different pH values on the adsorbed amount of MB. As shown in Fig. S3,† the adsorbed amount increased with the increasing of pH. It maybe that cationic MB competes with H3O+ for the adsorption sites when the pH value was low. With increasing pH, the number of negatively charged adsorption site increases, which was beneficial for the adsorption of cationic MB. Thus, this process ultimately resulted in an increase of the adsorbed amount of MB.
The composition of practical wastewater is complicated, as it may be acidic or alkaline. There might be limits to the practical usage of this kind of material, as the most common synthetic iron oxides are not resistant to extreme acid–base conditions. Therefore, the acid–base resistance properties of the material were very important for practical application. As a result, we examined the stability of γ-Fe2O3/C by adding sulfosalicylic acid to the supernatant of various acidic and alkali solutions in which γ-Fe2O3/C had been soaked for 24 h. As shown in the inset of Fig. S3,† only the strongly acidic condition (pH = 1.0) appeared slightly purple after addition of salicylic acid. We calculated that the dissolved ion concentration of Fe3+ in this solution was 1.874 mg L−1. This small amount of dissolved Fe3+ indicates that γ-Fe2O3/C was stable in most acid–base conditions, which was greatly advantageous for the removal of actual organic dyes.
The experimental data for the adsorption of MB were further analyzed using a pseudo-second-order adsorption kinetic model.
Fig. S4† shows pseudo-second-order kinetics plots for absorption of MB at different initial concentrations. The adsorption kinetics data were well described by the pseudo-second-order model (R2 > 0.997). As shown in Table S2,† the experimental measured values were basically the same as the calculated values. The results showed that the overall adsorption process was controlled by the chemical adsorption.15
In order to reduce costs, the adsorbents in actual production processes are always recycled. Therefore, the ability to reuse the adsorbent is also an important aspect when determining the properties of an adsorbent. Moreover, recycling can maximize the efficiency of an adsorbent. Although the removal rate of MB decreases with recycling (Fig. S5†), a rate of over 85% was still achieved after five cycles. The reduction in the adsorption performance might be due to the repetitive washing and drying processes, which contributed to the loss of adsorbent. And MB could be difficult to clean completely using ethyl alcohol which adsorbed in the smaller holes of γ-Fe2O3/C. In addition, ZnO in γ-Fe2O3/C could also act as a catalyst for dye degradation.27,35 ZnO in γ-Fe2O3/C could cooperatively contribute to the removal of MB by γ-Fe2O3/C, thus enhancing the degradation efficiency of MB. As show in Fig. 7-red circles, there was some MB degradation with the γ-Fe2O3/C. This phenomenon further decreased the recyclability of γ-Fe2O3/C.
3.3 Catalytic degradation of MB
The Fenton process is an AOP that uses Fe2+ and H2O2 to generate a powerful oxidant.22 This process can be used to oxidize macromolecules, such as refractory organics, into low-toxicity and non-toxic small molecules. The Fenton process is a type of deep oxidation technology that can produce ˙OH free radicals through the reaction between Fe ions and H2O2,36 which can oxidize toxic and refractory organic compounds to achieve removal of contaminants. Meanwhile, NH2OH is used to restore Fe3+ generated during homogeneous catalysis of the system in which H2O2/Fe is used as a reducing agent.37 This system is suitable for the oxidation of organic wastewater, such as biological refractory wastewater, or general chemical oxidation.In H2O2/Fe catalytic degradation of organic matter, pH has a great influence on the degradation efficiency. Therefore, determining the effect of pH on the degradation efficiency is necessary. As shown in Fig. S6(a),† the degradation rate of MB was fast at low pH values, with complete degradation of MB within 30 min at pH 3.0. With increasing pH values, the degradation efficiency gradually decreased. At pH 9.0, the extent of waste degradation was reduced considerably, with only 63.9% of MB removed within 40 min.
A similar phenomenon is known for the homogeneous catalytic degradation of organic matter. At higher pH values, H2O2 becomes unstable due to the increased concentration of −OH in the solution. Thus, the amount of ˙OH produced at the surface of the γ-Fe2O3/C is reduced, and the degradation rate and extent of degradation are decreased.38
The influence of different amounts of the catalytic components, such as the reductant, catalyst, and H2O2, were evaluated. As shown in Fig. S6(b),† with an increasing concentration of H2O2, the degradation efficiency was greatly enhanced. It might be the system cannot produce enough free radicals when the concentration of H2O2 was low. However, this does not mean that a higher concentration of H2O2 will shorten the degradation time because the reaction between the produced free radicals and H2O2 would be inhibited at higher concentrations of H2O2.38 The reaction equation was as follows:
| H2O2 + ˙OH → H2O + ˙OOH |
| ˙OOH + ˙OH → H2O + O2 |
In the H2O2/Fe homogeneous catalysis system, we used NH2OH as the reductant to allow the Fenton reaction to proceed, and reduce the narrow pH range of the reaction. In this study, Fe3+ was efficiently transformed into Fe2+ following addition of, which can speed up the catalytic rate. With the increasing of the NH2OH concentration, the degradation rate was obviously improved (Fig. S6(c)†). Further investigation showed that NH2OH had little influence on the catalytic degradation when its concentration was less than 10 mmol L−1. The amount of the catalyst directly affects the time it takes to reach catalytic equilibrium and the removal rate of MB. As shown in Fig. S6(d),† by increasing the amount of γ-Fe2O3/C, the catalytic degradation time was reduced to 10 min and the catalytic efficiency was close to 99%. This improvement is because the increased catalyst dosage can provide more H2O2 active sites, and thus produce more ˙OH to degrade MB.
Moreover, as the distances between each molecule were reduced, the production of free radicals can result in faster oxidation of MB. The structure of the γ-Fe2O3/C catalyst reduced the probability of reaction between the free radicals and other molecules, so that the catalytic efficiency was further enhanced. The catalytic degradation of MB can be completed within 30 min with the combined γ-Fe2O3/C, NH2OH, and H2O2 system. In contrast, the removal rate was not as high when γ-Fe2O3/C alone was used. However, γ-Fe2O3/C was superior to other materials for the catalytic degradation of MB, with greatly shortened times for the removal of organic dyes. The data show that γ-Fe2O3/C has great potential application in the removal of organic dyes (Fig. 8). Compared with other adsorbents presented in the literature13,15,18,19,22,23,26 (as shown in Table S3†), γ-Fe2O3/C presented satisfactory adsorption capacity and degradation efficiency in this work, which can be considered as an alternative for the removal of reactive dyes from aqueous effluents.
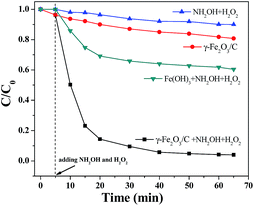 | ||
| Fig. 8 Catalytic properties of different materials with MB (100 mg L−1) at 30 °C and pH = 7 (the dosages of catalyst: 10 mg; CNH2OH: 10 mmol L−1; CH2O2: 3 mol L−1). | ||
We also surveyed the recycling performance of the γ-Fe2O3/C material in the degradation process. The great degradation performance of the materials was maintained after five reuse cycles (Fig. S7†). However, the addition of NH2OH and H2O2 might harm the catalyst as these reagents may produce organic acids during the degradation process. To inspect the stability of γ-Fe2O3/C during the catalytic reaction, we obtained the impregnation liquid after 5 catalysis cycles, and then, after removal of H2O2, added 10 wt% sulfosalicylic acid. As shown in the insert of Fig. S6,† there were no significant change in the color, even at this low pH value, and thus the estimated amount of dissolved Fe ions in aqueous solution was very low. This data indicated that γ-Fe2O3/C has excellent stability after several reuse cycles.
4. Concluding remarks
In summary, we developed a novel and inexpensive method to synthesize biomass-based γ-Fe2O3/C for the efficient removal and degradation of dyes in aqueous solution using a microwave heating approach. The obtained porous γ-Fe2O3/C material showed excellent magnetism, a high specific surface area, and a high pore volume. In addition, γ-Fe2O3/C had superior MB adsorption capacities (up to 352.96 mg g−1 at 30 °C) and excellent catalytic degradation ability for MB (complete degradation within 30 min in the presence of H2O2 and NH2OH). Thus, with this novel and inexpensive method a bagasse-based porous γ-Fe2O3/C material was obtained that has great potential for the clean-up of environmental pollutants.Acknowledgements
The financial support from the National Natural Science Foundation of China (21365005), Guangxi Natural Science Foundation of China (2014GXNSFGA118002) is gratefully acknowledged.Notes and references
- Y. Feng, H. Zhou, G. Liu, J. Qiao, J. Wang, H. Lu, L. Yang and Y. Wu, Bioresour. Technol., 2012, 125, 138–144 CrossRef CAS PubMed.
- J. F. Osma, J. L. Toca-Herrera and S. Rodríguez-Couto, Bioresour. Technol., 2010, 101, 8509–8514 CrossRef CAS PubMed.
- J. Ma, F. Yu, L. Zhou, L. Jin, M. Yang, J. Luan, Y. Tang, H. Fan and Z. Yuan, ACS Appl. Mater. Interfaces, 2012, 4, 5749–5760 CAS.
- Y.-B. Yan, J.-W. Miao, Z.-H. Yang, F.-X. Xiao, H. B. Yang, B. Liu and Y.-H. Yang, Chem. Soc. Rev., 2015, 44, 3295–3346 RSC.
- P. V. Nidheesh, RSC Adv., 2015, 5, 40552–40577 RSC.
- J. Yang and K.-Q. Qiu, Ind. Eng. Chem. Res., 2011, 50, 4057–4064 CrossRef CAS.
- S.-J. Han, K. Sohn and T. Hyeon, Chem. Mater., 2000, 12, 3337–3341 CrossRef CAS.
- M. C. Ribas, M. A. Adebayo, L. D. T. Prola, E. C. Lima, R. Cataluña, L. A. Feris, M. J. Puchana-Rosero, F. M. Machado, F. A. Pavan and T. Calvete, Chem. Eng. J., 2014, 248, 315–326 CrossRef CAS.
- R. A. Reza and M. Ahmaruzzaman, RSC Adv., 2015, 5, 10575–10586 RSC.
- J. Hristov and L. Fachikov, China Particuol., 2007, 5, 11–18 CrossRef CAS.
- I. Ozdemir, M. Şahin, R. Orhan and M. Erdem, Fuel Process. Technol., 2014, 125, 200–206 CrossRef CAS.
- F. K. Shieh, C. T. Hsiao, H. M. Kao, Y.-C. Sue, K.-W. Lin, C.-C. Wu, X.-H. Chen, L. Wan, M. H. Hsu, J. R. Hwu, C. K. Tsung and K. C. W. Wu, RSC Adv., 2013, 3, 25686–25689 RSC.
- H.-Y. Wu, F. K. Shieh, H. M. Kao, Y.-W. Chen, J. R. Deka, S. H. Liao and K. C. W. Wu, Chem.–Eur. J., 2013, 19, 6358–6367 CrossRef CAS PubMed.
- P. B. Whittaker, X.-L. Wang, W. Zimmermann, K. Regenauer-Lieb and H. T. Chua, J. Phys. Chem. C, 2014, 118, 8350–8358 CAS.
- R.-L. Liu, Y. Liu, X.-Y. Zhou, Z.-Q. Zhang, J. Zhang and F.-Q. Dang, Bioresour. Technol., 2014, 154, 138–147 CrossRef CAS PubMed.
- M. Ghasemi, M. Z. Khosroshahy, A. B. Abbasabadi, N. Ghasemi, H. Javadian and M. Fattahi, Powder Technol., 2015, 274, 362–371 CrossRef CAS.
- L.-L. Ding, B. Zou, W. Gao, Q. Liu, Z.-C. Wang, Y.-P. Guo, X.-F. Wang and Y.-H. Liu, Colloids Surf., A, 2014, 446, 1–7 CrossRef CAS.
- P. T. Yeung, P. Y. Chung, H. C. Tsang, J. C. Tang, G. Y. Cheng, R. Gambari, C.-H. Cui and K. H. Lam, RSC Adv., 2014, 4, 38839–38847 RSC.
- L.-C. Zhou, J.-J. Ma, H. Zhang, Y.-M. Shao and Y.-F. Li, Appl. Surf. Sci., 2015, 324, 490–498 CrossRef CAS.
- X.-Y. Zhang and Z. Liu, Nanoscale, 2012, 4, 707–714 RSC.
- J. Kim, M. Ishihara, Y. Koga, K. Tsugawa, M. Hasegawa and S. Iijima, Appl. Phys. Lett., 2011, 98(091502), 1–3 Search PubMed.
- X.-Y. Wang, G.-C. Lv, L.-B. Liao and G.-S. Wang, RSC Adv., 2015, 5, 55595–55601 RSC.
- M. S. Sajab, C. H. Chia, C. H. Chan, S. Zakaria, H. Kaco, S. W. Chook, S. X. Chin and A. M. Noor, RSC Adv., 2016, 6, 19819–19825 RSC.
- C. Zhang, F.-G. Ye, S.-F. Shen, Y.-H. Xiong, L.-J. Su and S.-L. Zhao, RSC Adv., 2015, 5, 8228–8235 RSC.
- Y.-H. Xiong, F.-G. Ye, C. Zhang, S.-F. Shen, S.-L. Su and S.-L. Zhao, RSC Adv., 2015, 5, 5164–5172 RSC.
- J.-D. Xiao, L.-G. Qiu, X. Jiang, Y.-J. Zhu, S. Ye and X. Jiang, Carbon, 2013, 59, 372–382 CrossRef CAS.
- Y. Liu, L. Yu, Y. Hu, C. Guo, F. Zhang and X. W. Lou, Nanoscale, 2012, 4, 183–190 RSC.
- M. Descostes, F. Mercier, N. Thromat, C. Beaucaire and M. G. Soyer, Appl. Surf. Sci., 2000, 165, 288–302 CrossRef CAS.
- A. Khataee, A. Karimi, S. Arefi-Oskoui, R. D. C. Soltani, Y. Hanifehpour, B. Soltani and S. W. Joo, Ultrason. Sonochem., 2015, 22, 371–381 CrossRef CAS PubMed.
- X. P. Dong, H. R. Chen, W. R. Zhao, X. Li and J. L. Shi, Chem. Mater., 2007, 19, 3484–3492 CrossRef CAS.
- N. M. Bahadur, T. Furusawa, M. Sato, F. Kurayama and N. Suzuki, Mater. Res. Bull., 2010, 45, 1383–1388 CrossRef CAS.
- G. Wu, X. Y. Tana, G. Y. Li and C. W. Hu, J. Alloys Compd., 2010, 504, 371–376 CrossRef CAS.
- X.-D. Zhu, Y.-C. Liu, C. Zhou, S.-C. Zhang and J.-M. Chen, ACS Sustainable Chem. Eng., 2014, 2, 969–977 CrossRef CAS.
- Z.-X. Zhong, J.-F. Yao, Z.-X. Low, R.-Z. Chen, M. He and H.-T. Wang, Carbon, 2014, 72, 242–249 CrossRef CAS.
- S. Sakthivel, S. U. Geissen, D. W. Bahnemann, V. Murugesan and A. Vogelpohl, J. Photochem. Photobiol., A, 2002, 148, 283–293 CrossRef CAS.
- L.-H. Ai, C.-H. Zhang, L.-L. Li and J. Jiang, Appl. Catal., B, 2014, 148, 191–200 CrossRef.
- J.-J. Du, Y.-P. Yuan, J.-X. Sun, F.-M. Peng, X.-J. Jiang, L.-G. Qiu, A.-J. Xie, Y.-H. Shen and J.-F. Zhu, J. Hazard. Mater., 2011, 190, 945–951 CrossRef CAS PubMed.
- L.-C. Zhou, Y.-M. Shao, J.-R. Liu, Z.-F. Ye, H. Zhang, J.-J. Ma, Y. Jia, W.-J. Gao and Y.-F. Li, ACS Appl. Mater. Interfaces, 2014, 6, 7275–7285 CAS.
Footnote |
| † Electronic supplementary information (ESI) available. See DOI: 10.1039/c6ra24900k |
| This journal is © The Royal Society of Chemistry 2017 |


