
 Open Access Article
 This Open Access Article is licensed under a Creative Commons Attribution-Non Commercial 3.0 Unported Licence
Highly uniform SERS-active microchannel on hydrophobic PDMS: a balance of high reproducibility and sensitivity for detection of proteins†
Hui Lu,
Li Zhu *,
Chuanlong Zhang,
Zhile Wang,
Yiru Lv,
Kexiang Chen and
Yiping Cui
*,
Chuanlong Zhang,
Zhile Wang,
Yiru Lv,
Kexiang Chen and
Yiping Cui
Advanced Photonics Center, Southeast University, Nanjing 210096, Jiangsu, China. E-mail: li-zhu@seu.edu.cn
First published on 27th January 2017
Abstract
SERS-active microchannels on hydrophobic polydimethylsiloxane (PDMS) with both high reproducibility and sensitivity are fabricated. First, uniform and size controllable silver nanoparticles (Ag NPs) are prepared with the proposed two-step method, in which the nucleation and growth stages are carried out independently. The average size of Ag NPs is 65 nm, which is balanced for the stability of silver colloids and high enhancement of SERS at 633 nm excitation, with a relative standard deviation (RSD) of 7.80%. The uniform Ag NPs are evenly coated on hydrophobic PDMS and formed a dense monolayer Ag NPs film with a RSD of 7.07%. A SERS-active microchannel is fabricated by integrating the SERS-active substrate in a PDMS microchannel and shows excellent uniformity with a RSD of 4.6% along the flow direction. The SERS signals of a variety of lable free amino acid and proteins are detected with good signal-to-noise ratios on the SERS-active substrate. By comparing the SERS spectra detected on the substrate and in the microchannel during flow, the adsorption mode of PMP22-TM4 on the surface of Ag NPs are revealed. More important, the results indicate that PMP22-TM4 might denature while drying on the surface of Ag NPs, but maintain the native structure in the SERS-active microchannels. Therefore, measuring SERS in a microchannel under the condition of flow offers a way to study protein conformation while keeping it in the native state.
1. Introduction
Raman spectrum is an attractive spectroscopic technique, which narrow-band peaks corresponding to submolecular vibrational modes in each functional group provide unique molecular fingerprints, and offers a label free analytical method.1–4 Surface-enhanced Raman scattering (SERS) greatly amplifies Raman signal and becomes an ultrasensitive tool for probing structural properties of analytes under very low concentration.5–7 However, static SERS measurement has problems with local heating and photodissociation, and it cannot be used to trace conformational changes of biological molecules.8–11 These problems can be solved using SERS-active microchannels because flowing conditions leads to more consistent heat dissipation. Moreover, it offers an online detection method and can be used to study various dynamic processes.12,13A SERS-active microchannel can be made by integrating a piece of SERS substrate in a microchannel. Among various methods14–17 for fabricating SERS-active substrate, chemically reduced silver nanoparticles self-assembly on substrate14,18 is favoured because of operation easy, cost effective and high SERS enhancement.19
Nevertheless, one of the most important issues concerning the performance of SERS is reproducibility. Preparation of high-efficiency and uniform SERS substrate using chemical assembly method requires two steps: (1) preparing uniform Ag NPs with a designed size; (2) evenly depositing Ag NPs on substrate. The growth mechanism of Ag NPs has been well studied: it follows nucleation-growth mechanism;20,21 the pH value in nucleation stage controls the morphology of Ag NPs while the pH value in growth stage decides the size of particles.22–25 However, it is difficult to control the pH value in the growth stage.
PDMS is by far the most popular polymeric material for microfluidics on account of its low cost, ease of fabrication and optical transparency.26 However, its hydrophobicity makes difficult to fabricate SERS substrate on PDMS. To the best of our knowledge,4,12,27–32 most SERS-active microchannels are PDMS-glass (quartz or silicon) hybrid and SERS-active layer is coated on the hard substrate. Comparing with glass or quartz, PDMS is much easier to fabricate fine features due to the low elastic modulus and high Poisson's ratio,26,33 and cost less.
In this work, we skilfully separated the nucleation and growth stages of Ag NPs and proposed a two-step method to prepare uniform and size controllable Ag NPs. By improved surface modification, the uniform Ag NPs were evenly adsorbed on PDMS and formed a single layer of dense Ag NPs film over PDMS. Finally, we transfer the SERS substrate to the microchannel and successfully detected SERS signals of proteins and amino acid under the conditions of flow, which implicate valuable information about protein conformation and adsorption modes. The motivation for this study is to provide an effective technique to fabricate functional microfluidic devices combining with SERS probe in the future.
2. Experimental
2.1 Reagents
The reagents and solvents were used in this study, including silver nitrate, trisodium citrate, sodium hydroxide, nitric acid, (3-aminopropyl) trimethoxysilane (APTMS), dipotassium hydrogen phosphate, potassium dihydrogen phosphate, sodium chloride, ethylic acid, natrium aceticum, ethanol, and methylsilicone oil were obtained from Chinese medicine group. The polydimethylsiloxane (PDMS) was from Suzhou WenHao Company. The rhodamine 6G (R6G), cytochrome c from equine heart and N-acetyl-L-tryptophanamide (NATA) were from Sigma-Aldrich. The transmembrane helix 4 of peripheral myelin protein 22 (PMP22-TM4, SI-1) was from Sangon Biotech. The n-dodecylphosphocholine (DPC) was purchased from Anatrace. Dimethyl sulfoxide (DMSO) was from Xi ya reagent. The water is all deionized water.2.2 Preparation of uniform silver nanoparticles
First, 1 ml of silver nitrate (0.3 M) was added into 4 ml of sodium citrate (0.46 M) at pH = 11, 70 °C and accompanied by ultrasonic dispersion. The reaction was allowed to run until it appeared milky white, indicating silver seed solution was essentially completed. Then, 295 ml water at pH 4.5 (growth solution) was brought to boil by oil bath heating while being stirred and condensation reflux. After boiling, silver seed solution was injected into boiling water directly using syringe. The colour of the reaction solution was observed to change generally from yellow to grey green, then turbid. Kept heating the reaction solution for 1.5 h to enable intra-particle ripening, and then let it cool naturally. Since the nucleation and growth are carried out independently in the synthesis of Ag NPs, we name it two-step method. The reactions in the series of variable pH were carried out by adding either HNO3 (1.35 M) or NaOH (0.2 M). In order to further improve the uniformity of Ag NPs, multiple rounds of centrifugation at low speed were performed. Centrifugal speed was set to 2500 rpm and time was 40 minutes. After each centrifugation, the silver nanoparticles which were at the bottom of the centrifuge tube were collected and diluted.2.3 Assembling dense monolayer Ag NPs on PDMS substrate
First, pre-polymer of PDMS and curing agent with a ratio of 10![[thin space (1/6-em)]](https://www.rsc.org/images/entities/char_2009.gif) :1 were mixed and degassed, then horizontally placed in oven for 12 hours which was set to 60 °C. Second, the solidified PDMS was treated with plasma cleaning machine (MingHeng PDC-MG) for 40 seconds to create hydroxyl groups on its surface, then immediately immersed in 5% (v/v) APTMS ethanol solution (65 °C) for 6 hours. After being taken out, the PDMS substrate was rinsed by ethanol and deionized water to remove excess APTMS, and dried by nitrogen. Then the PDMS substrate was immersed into silver colloids for 6 hours. The PDMS substrate with SERS-activity was prepared after rinsed by deionized water.
:1 were mixed and degassed, then horizontally placed in oven for 12 hours which was set to 60 °C. Second, the solidified PDMS was treated with plasma cleaning machine (MingHeng PDC-MG) for 40 seconds to create hydroxyl groups on its surface, then immediately immersed in 5% (v/v) APTMS ethanol solution (65 °C) for 6 hours. After being taken out, the PDMS substrate was rinsed by ethanol and deionized water to remove excess APTMS, and dried by nitrogen. Then the PDMS substrate was immersed into silver colloids for 6 hours. The PDMS substrate with SERS-activity was prepared after rinsed by deionized water.
2.4 Fabrication of microchannel with SERS activity
The fabrication steps for a microchannel with SERS activity is shown in Fig. 1. Microchannel (width: 300 μm; depth: 50 μm; length: 1 cm) was made by the moulding method8 (the mould was purchased from Suzhou Wenhao Chip Tech. Co., Ltd). Briefly, the mixture of pre-polymer of PDMS and curing agent was cast on the mould; after been baked at 60 °C for 12 hours, the PDMS replica was peeled from the mould with designed channel in it. After plasma treatment and silylanization, the PDMS microchannel was immersed into silver colloids to adsorb Ag NPs. The Ag NPs which were not in microchannel were removed by strong adhesive tape. After being punched the inlet and outlet and cleaned by plasma, the SERS-active microchannel was sealed by another piece of PDMS coverslip which was also cleaned by plasma. To achieve permanent bonding, the microchannel was put in oven (65 °C) for 3 h. | ||
| Fig. 1 Cartoon showing the fabrication steps for a SERS-active microchannel based on PDMS. (1) The PDMS microchannel made by moulding method. (2) Plasma treatment and silylanization are applied to create amino groups on PDMS surface to adsorb Ag NPs. (3) Ag NPs are adsorbed on PDMS surface. (4) The Ag NPs not in microchannel are removed by strong adhesive tapes. (5) The inlet and outlet of microchannel are punched. (6) The microchannel is sealed by a piece of PDMS coverslip after plasma cleaning. | ||
2.5 Characterization
2.6 SERS measurements
SERS measurements were performed with HORIBA JOBIN YVON T64000 three grating Raman spectrometer. He–Ne laser with 633 nm radiation was used for excitation and the laser power at the sample position was 2.3 mW. The scattering light was collected by a 50× objective lens (numerical aperture (NA) = 0.5) to the CCD detector. All SERS spectra shown here were results of a 10 s accumulation and the RSD is from 10 different measurements, if without specific description.3. Results and discussion
3.1 Optimization of silver nanoparticles' size and morphology
Nucleation-growth model suggests that the formation of silver nanoparticles has gone through a fast nucleation process followed by a diffusion controlled growth.20,21 Literature24,25,34 shows that pH value during nucleation decides Ag NPs' morphology and low pH environment benefits rod shapes. Therefore, to grow uniform spherical particles, we first optimized pH in the high range during preparing seed solution and fixed pH at 5 (pH of growth solution is 4.5) in the growth stage. Fig. 2(a) shows extinction spectra of Ag NPs nucleated under different pH values. As the pH was mediated from 8.7 to 12, the full width at half maximum (FWHM) of each extinction spectrum was 126, 97, 78 and 92 nm respectively. The FWHM achieves the narrowest at pH 11, which probably means Ag NPs nucleated at this pH value with best homogeneity. These results are consistent with TEM observations (shown in Fig. S1†). Under higher pH value, such as pH 12, the reaction process was very fast and made the experiment difficult to control and caused aggregation (Fig. S1(c)†).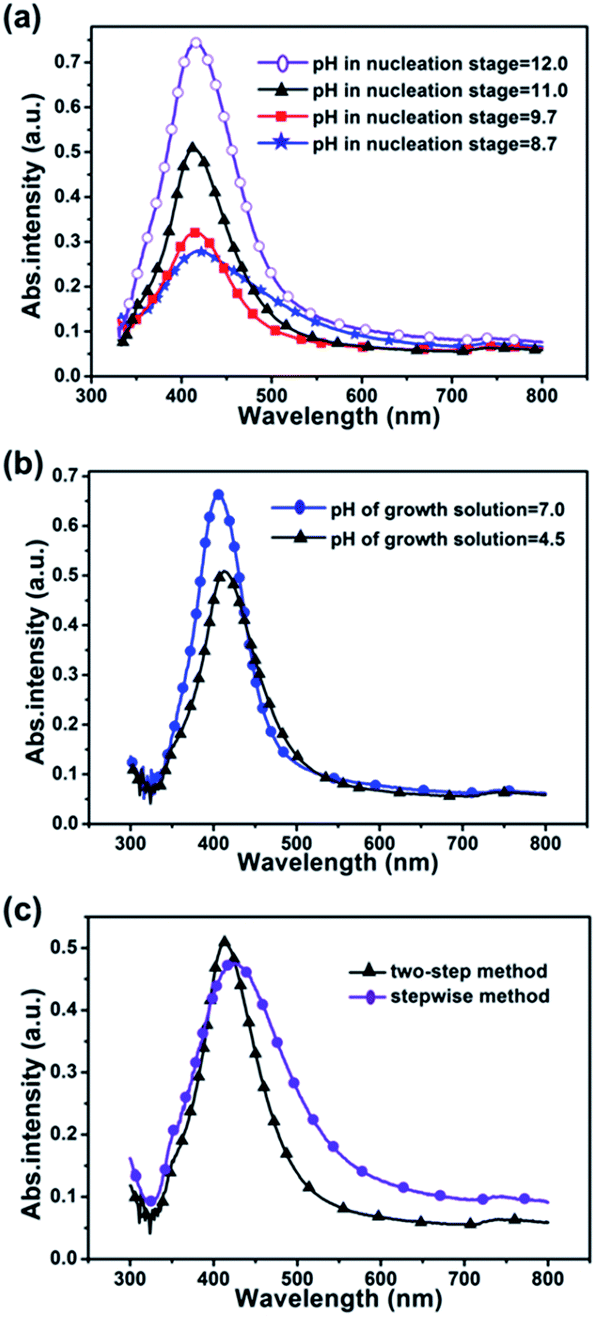 | ||
| Fig. 2 (a) UV-visible extinction spectra of the silver colloids nucleating at various pH values (8.7, 9.7, 11.0 and 12.0) and growing at pH 5; (b) UV-visible extinction spectra of the silver colloids growing at pH 7.4 and pH 5 (corresponding pH values of growth solutions were 7.0 and 4.5), while nucleating at pH 11.0; (c) UV-visible extinction spectra of silver colloids prepared by two-step method and stepwise method (the pH values in nucleation are 11; the pH values in growth are 5). | ||
High SERS enhancement factor (EF) requires optimum average size of nanoparticles.35 We did simulations to find the optimal Ag NPs size. Simulation results show that electric field intensity between two Ag NPs increases greatly when their size grows from 20, 40 to 65 nm (see Fig. S2†). However, the stability of silver colloids becomes poor and the Ag NPs are easy to aggregate and precipitate when they get too big. Literature23,25,36,37 shows that low pH condition in growth stage is in favour to grow Ag NPs to large size. Two pH values (7.4 and 5 (the pH values of growth solution are 7.0 and 4.5, respectively)) were chosen to grow Ag NPs, meanwhile, the pH value in the nucleation stage was set to 11. Fig. 2(b) shows extinction spectra of silver colloids growing in different pH environments. Because the pH value of the nucleation stage had been optimized to 11.0, the FWHM of each extinction spectrum is almost the same, which means the two samples have similar size distribution and morphology. However, the extinction peak shifted from 405 to 415 nm, which means the average size of Ag NPs increased25 when pH value was decreased from 7.4 to 5 in the growth stage. TEM images (Fig. S3†) confirm that Ag NPs growing at pH 5 are larger than growing at pH 7.4.
This two-step method greatly improves the homogeneity of Ag NPs and makes it easy to control the size of Ag NPs. Comparing with one-step method (without any pH regulation) and stepwise method (adjusting pH from initial value to final value in the same flask),25 the resulting Ag NPs by the two-step method show better uniformity and monodispersion (Fig. 2(c) and S4†). Because we separate the nucleation and growth stage, the pH value of each stage can be controlled precisely, and the environments for nucleation and growth can be optimized separately to avoid fuzzy point of time between nucleation and growth stage.
Although the morphology of Ag NPs had been controlled during the nucleation stage, there were still some rod-like and smaller particles. To remove these, low speed centrifugation was performed because particle sedimentation is related to the morphology and size according to Svedberg coefficient.38–40 During slow speed centrifuging, spherical Ag NPs are inclined to sediment at the bottom and rods prone to deposit on the side wall of the centrifuge tube, meanwhile, the pretty small nanoparticles are still staying in the supernatant. The Ag NPs deposited at the bottom of the centrifuge tube are collected and centrifuged again. After 6 rounds of centrifugation, the spherical Ag NPs around 65 nm were segregated. The TEM (Fig. 3(a)) shows that the average size of finally prepared Ag NPs is about 65 nm and the RSD is 7.80%. Rod-like particles are only accounted for 0.29% of the total particles. The evolution of morphology and size of Ag NPs accompanied by multiple rounds of centrifugation is shown in Fig. S5.† The uniformity of prepared Ag NPs was also characterized by SERS performance of R6G and the collected SERS spectra are shown in Fig. 3(b). Results indicate that our Ag NPs have excellent uniformity and the average RSD is only 8.18%. The RSD of each specific peak is shown in Table S1.†
 | ||
| Fig. 3 (a) The TEM image of finally prepared Ag NPs; (b) SERS spectra of R6G in silver colloids detected at 6 random spots. (The experiment was done by mixing 100 μl R6G (10−3 M) in 900 μl silver colloids (approximately 160 μM), then collected SERS signals at six random spots of the mixture solution. The resulting concentration of R6G was 10−4 M.) | ||
3.2 Characterization of SERS substrate
Although PDMS's hydrophobicity makes adsorbing Ag NPs onto its surface difficult, APTMS silylanization after oxygen plasma process introduces amino groups to the surface of PDMS; under low pH, protonated amidogen can effectively adsorb Ag NPs. Schematic is shown in Fig. 4(a). The PDMS substrate is evenly coated with a single layer of monodisperse Ag NPs after surface modification (see Fig. 4(b)). The uniformity of the SERS-active substrate was characterized by SERS signals of R6G. The substrate was immersed into R6G solution (10−7 M) for 3 hours and then washed to remove excess R6G. After drying, 10 spots on the substrate were randomly selected and SERS signals of R6G were detected. The measured SERS spectra of R6G are shown in Fig. 4(c). The SERS substrate shows excellent uniformity and the average RSD is only 7.07%. The RSD of each specific peak is shown in Table S2.†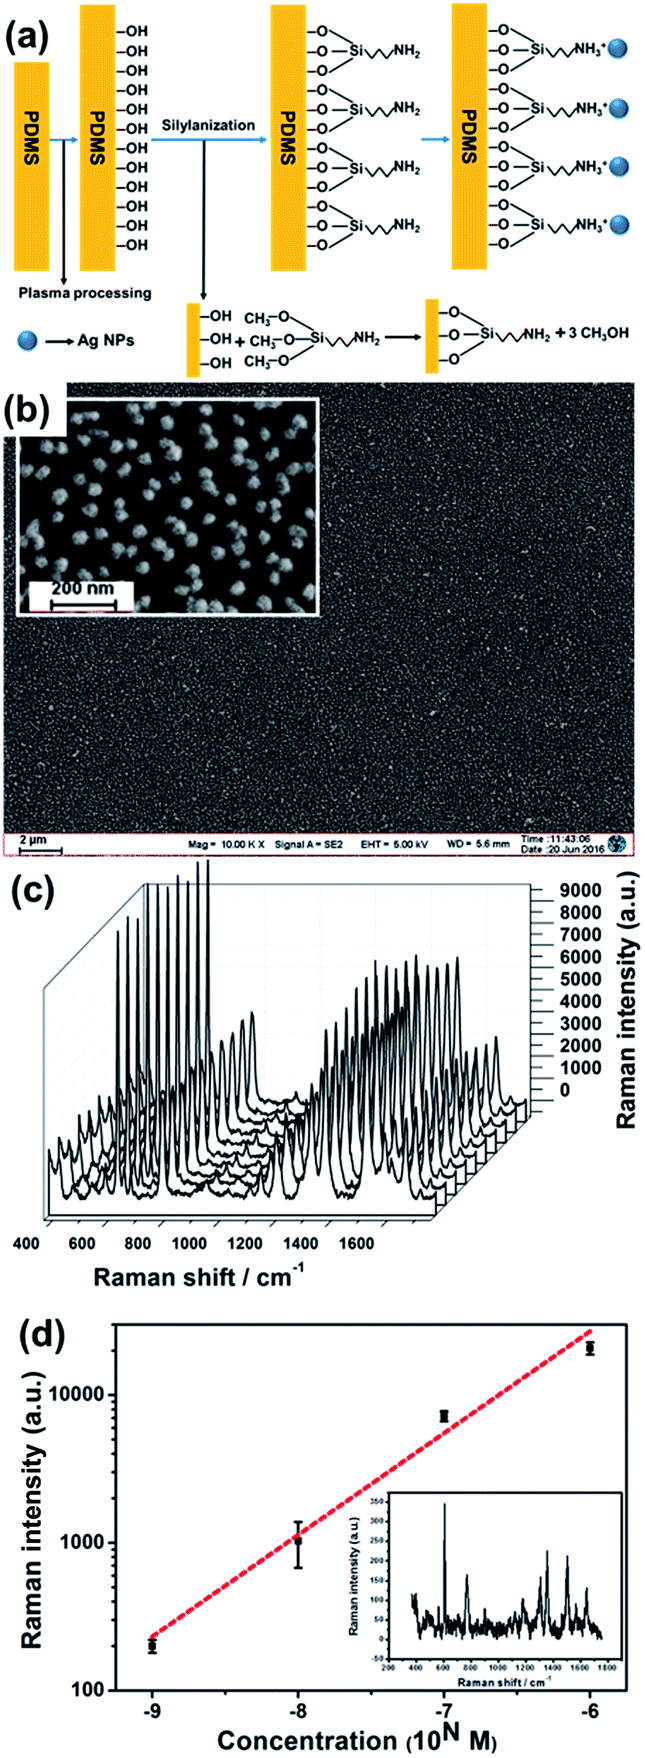 | ||
| Fig. 4 (a) The schematic diagram of coating Ag NPs on PDMS surface; (b) the SEM image of the SERS substrate; (c) SERS signal of R6G (10−7 M) detected at 10 random spots on the substrate. The experiment was done by immersing the SERS substrate into R6G solution (10−7 M) for 3 hours, then washing off excess R6G. SERS signals were detected at 10 random spots on the dried SERS substrate; (d) SERS intensity at 1510 cm−1 as the function of concentration. Inset is SERS spectrum of R6G at 10−9 M. | ||
To further examine the SERS enhancement capability of the substrate, the limit of detection (LOD) was studied. 20 μl R6G solutions with various concentrations were dropped on the SERS substrate respectively. After natural drying, the SERS signals of R6G were detected. SERS spectra of R6G at 10−7 M, 10−8 M and 10−9 M are shown in Fig. S6;† the SERS intensity at 1510 cm−1 as the function of concentration is plotted in Fig. 4(d). Clearly, the SERS signal at concentration as low as 10−9 M still has very good signal-to-noise ratio. The enhancement factor (EF) was calculated as 2.09 × 10⁷ (the method of calculation is shown in SI-2).
3.3 Detection of amino acid and proteins on SERS substrate
Raman spectrum is a powerful tool to study biological macromolecules. To evaluate the capability of the SERS substrate, several proteins and amino acid were tested. 20 μl different sample solutions were dropped on the substrate. After natural drying, SERS signals were detected respectively. Fig. 5 shows the SERS spectra of NATA (a), cytochrome c (b) and PMP 22-TM4 (c). All the SERS spectra show great signal-to-noise ratio. NATA is an N-terminal and C-terminal blocked analogue of L-tryptophan. Its structure is shown in Fig. S8.† Tryptophan is a naturally occurring photoactive amino acid and its fluorescence can be an effective local probe to study conformational changes of proteins, while NATA is always treated as a control experiment.41–43 Therefore, it is good to acquire more information about NATA. Cytochrome c is a well-studied protein and its specific SERS peaks are already identified.44 Measured specific peaks of NATA and cytochrome c are assigned in Tables S3 and S4† and they are all consistent with previous reports.45–47 PMP 22-TM4 is the fourth transmembrane helix of peripheral myelin protein 22 (PMP22), a four transmembrane helices protein. The sequence is shown in SI-1. PMP22 plays an essential role in myelin synthesis and assembly, but mutations in PMP22 can result in Charcot-Marie-Tooth Disease (CMTD), one of the most commonly inherited peripheral neuropathy.48 Recent research implicated that misfolding of PMP22 is associated with the pathogenesis of CMTD.49,50 There is only one tryptophan residue in PMP22-TM4, which should be an effective local conformation probe. But owing to existence of 95.65% hydrophobic amino acids, PMP 22-TM4 has very poor solubility, barely soluble in water. So its tryptophan fluorescence in solution is weak. Fortunately, PMP 22-TM4 shows extraordinary high SERS response, which offers a sensitive probe to study its conformational changes. Based on the structure predicted with homology model49 (see Fig. 6) and known knowledge,51–61 we firstly assigned specific peaks of PMP22-TM4, and assignments are shown in Table 1. | ||
| Fig. 5 (a) SERS spectrum of 100 μM NATA in 0.1 M potassium phosphate buffer (KPi) at pH 7; (b) SERS spectrum of 100 μM cytochrome c in 0.1 M KPi buffer at pH 7; (c) SERS spectrum of PMP22-TM4 (3.6 μM) in acetate buffer. The acetate buffer condition was 0.2 M acetate, 0.5% DPC and 150 mM NaCl at pH 5.5. | ||
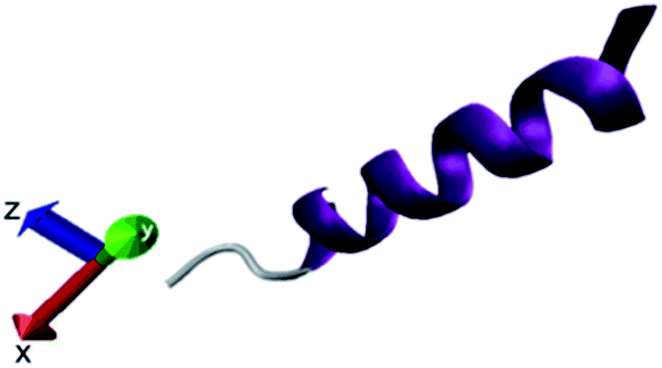 | ||
| Fig. 6 The structure of PMP22-TM4 predicted with homology model. | ||
| Specific peaks of PMP22-TM4 (cm−1) | Identification |
|---|---|
| a Abbreviations: ν-stretching, ρ-rocking, δ-deformation, γ-torsion, σ-scissoring, τ-twisting, β-bending, sym-symmetric, asym-antisymmetric. | |
| 953 | ν(C–C) |
| 1005 | νring, δring, ν(C–N) |
| 1107 | γ(NH3+) |
| 1150 | τ(CH2), δring |
| 1273 | ν(C–N), γ(CH2) |
| 1324 | δ(CmH) |
| 1337 | τ(NH3+) |
| 1360 | νring |
| 1385 | ν(COO−), δ(CH3) |
| 1428 | νring |
| 1451 | νring |
| 1497 | ν(C–N), γ(NH3+) |
| 1520 | νring |
| 1577 | νring |
| 1600 | ν(COO−) |
| 1615 | σ(NH3+) |
| 1650 | α-Helix |
3.4 Characterization of SERS performance in microchannel
SERS active microchannel (Fig. 7(a)) was fabricated with the method mentioned in Experimental section. R6G (10−6 M) was employed to characterize SERS performance in the microchannel. Both transverse and longitudinal SERS uniformity inside of the channel were studied. The detection area was chosen in the middle of the microchannel, and the interval of each detection spots was 10 μm. R6G solution was injected from the inlet, and all the measurements were done during flow. Under the conditions of flow, molecules adsorb on and desorb from the surface. When adsorption and desorption of R6G molecules are at equilibrium, the SERS intensity reaches a stable value (Fig. S9†). We collected data after they were steady. Fig. 7(b) shows transverse and longitudinal uniformities in the microchannel, respectively. Specific peak at 1510 cm−1 was used to indicate SERS intensity. The transverse SERS intensity is parabolic and the intensity in the centre line is larger than both sides, while, the microchannel shows excellent uniformity along the flow direction and the RSD is as low as 4.6%. All the measurements were taken along the central line of the channel during longitudinal study. We also found that the SERS intensity decays exponentially with the increase of flow rate, shown in Fig. 7(c). This is reasonable because high flow rate is in favour of desorption of molecules from the surface; therefore, fewer molecules are adsorbed in the channel, which results in lower SERS intensity. | ||
| Fig. 7 (a) The structure and sizes of the microchannel. The depth is 50 μm; (b) transverse and longitudinal measurements, flow rate was set to 5.6 cm s−1; (c) the relationship between SERS intensity and flow rate. SERS intensities at 1510 cm−1 band of R6G (1 μM) are shown in the figure. Each point is the average of 6 measurements and error bar is the RSD; the integral time was 3 s; the interval of each detection spot was 10 μm. | ||
3.5 Detection of protein in microchannel
The SERS signal of PMP22-TM4 was measured while it was flowing in the SERS-active microchannel. Although PDMS is a Raman active polymer, the SERS spectrum of PMP22-TM4 shows good signal-to-noise ratio (Fig. 8(a)). Comparing with the spectrum measured on SERS substrate, the signal intensity in the microchannel is overall decreased, but the interesting thing is that bands corresponding to protonated amino group, such as 1615 cm−1 and 1497 cm−1 have been significantly enhanced (Fig. 8(b)). Because the isoelectric point (pI) of PMP22-TM4 is 6.2 (Fig. S10†) and the acetate buffer is at pH 5.5, it is reasonable that ionization of amino group is dominant in the experimental conditions. The protonated amino group is easy to be adsorbed on Ag NPs so that its Raman scattering is greatly enhanced. Since only terminal amino group is free to ionize in the protein, we assume PMP22-TM4 is “standing” in the SERS-active microchannel through the amino group of phenylalanine (Phe). To prove the above analysis, acetate buffer was replaced by potassium phosphate buffer (KPi) to record SERS spectra of PM P22-TM4 under and above pI. The experiments were run at pH 5.8 and pH 8; the results are shown in Fig. S11.† The results demonstrate that SERS bands corresponding to protonated amino groups have been enhanced at pH 5.8, while SERS bands corresponding to ionized carboxyl groups have been enhanced at pH = 8. The 1650 cm−1, the specific peak of α-helix,54 is shown in the spectrum measured in the microchannel, but disappeared in the spectrum measured on SERS-active substrate (Fig. 8(b) inset). This implies that PMP22-TM4 maintains the native structure in the microchannel, but might denature while drying on the surface of Ag NPs. The exciting finding shows that measuring SERS in a microchannel under the condition of flow is helpful to keep proteins in the native state and contributes to the study of protein conformation.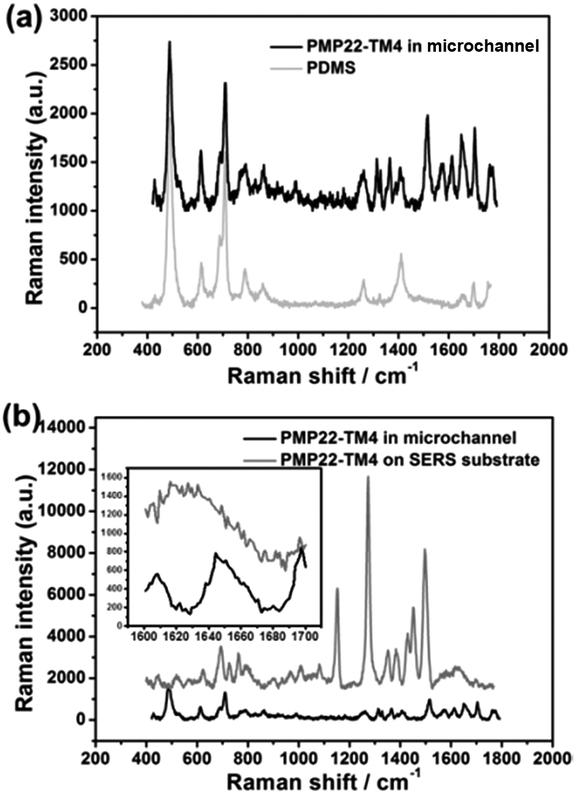 | ||
| Fig. 8 (a) SERS signals of PMP22-TM4 in microchannel and PDMS control experiment; (b) the SERS signals of PMP22-TM4 in microchannel and on SERS substrate. The concentration of PMP22-TM4 was 3.6 μM and the buffer condition was 0.2 M acetate buffer at pH 5.5, 0.5% DPC and 150 mM NaCl. The flow rate was 0.11 cm s−1. | ||
4. Conclusions
In summary, fabrication of high-efficiency and uniform SERS substrate using chemical assembly method requires two steps: (1) preparing uniform Ag NPs with an optimal size; (2) evenly depositing Ag NPs on the substrate. Based on the understanding of the growth mechanism of Ag NPs by the citrate reduction of silver nitrate, which is the pH value in nucleation stage controls the morphology of Ag NPs while the pH value in growth stage decides the size of particles, we proposed a two-step method, in which the nucleation and growth stages are carried out independently and the pH value of each stage can be optimized separately. Assisted with low speed centrifugation, Ag NPs with an average size of 65 nm, which is balanced for the stability of silver colloids and high enhancement of SERS at 633 nm excitation, and a RSD of 7.80% are prepared. To evenly coat a single layer of Ag NPs on hydrophobic PDMS, oxygen plasma treatment and APTMS silylanization have to be carefully applied to introduce amino groups to PDMS surface to effectively adsorb Ag NPs. The homogeneity of the SERS substrate is characterized by SERS signal of R6G and the RSD is only 7.07%. The SERS signals of a variety of label free proteins and amino acid have also been successfully detected on the substrate. Finally, the SERS-active substrate has been transferred into a PDMS microchannel (300 μm × 50 μm × 1 cm) and the RSD along the channel is as low as 4.6%. The SERS intensity decays with increase of flow rate. This phenomenon might due to the number of molecule adsorbed on the SERS substrate is reduced under fast flow rate. Therefore, choosing appropriate flow rate is important to SERS measurement in microchannel. To evaluate the capability of the SERS-active microchannel substrate, PMP22-TM4, a poorly soluble protein with extremely low concentration, has been tested. The collected signal has good signal-to-noise ratio and gives information that PMP22-TM4 might “stand” in the SERS-active channel. Comparing with the spectrum measured on SERS substrate, data acquired in the microchannel possess more information about protein conformation and adsorption modes. And the most important finding is that measuring SERS during flow contributes to keep proteins in the native state, which is important to the study of proteins. These experimental results indicate that we have developed an effective method to fabricate uniform and high efficiency SERS-active substrate on PDMS, and it is easy to be extended to make more functional microfluidic devices, such as microfluidic mixer combining with SERS probe, based on all-PDMS, to study protein conformational changes.Acknowledgements
This work is supported by the National Natural Sciences Foundation of China (61378045, 61535003), the Natural Science Foundation of Jiangsu Province (BK20131297) and Scientific Research Foundation for the Returned Overseas Chinese Scholars, State Education Ministry of the People's Republic of China. The authors are grateful to Mr Lei Wu for his technical support of the Raman spectrometer.References
- B. D. Piorek, S. J. Lee, J. G. Santiago, M. Moskovits, S. Banerjee and C. D. Meinhart, Proc. Natl. Acad. Sci. U. S. A., 2007, 104, 18898–18901 CrossRef CAS PubMed.
- X. Y. Zhang, M. A. Young, O. Lyandres and D. R. Van, J. Am. Chem. Soc., 2005, 127, 4484–4489 CrossRef CAS PubMed.
- Y. C. Cao, R. Jin and C. A. Mirkin, Science, 2002, 297, 1536–1540 CrossRef CAS PubMed.
- B. B. Xu, Z. C. Ma, L. Wang, R. Zhang and L. G. Niu, Lab Chip, 2011, 11, 3347–3351 RSC.
- G. Kibar, A. E. Topal, A. Dana and A. Tuncel, J. Mol. Struct., 2016, 1119, 133–138 CrossRef CAS.
- C. Wang, B. X. Liu and X. C. Dou, Sens. Actuators, B, 2016, 231, 357–364 CrossRef CAS.
- E. Pieta, E. Proniewicz, Y. Kim and L. M. Proniewicz, Spectrochim. Acta, Part A, 2014, 121, 121–128 CrossRef CAS PubMed.
- T. Park, S. Lee, G. H. Seong and J. Choo, Lab Chip, 2005, 5, 437–442 RSC.
- J. J. Laserna, Anal. Chim. Acta, 1993, 283, 607–622 CrossRef CAS.
- G. T. Taylor, S. K. Sharma and K. Mohanan, Appl. Spectrosc., 1990, 44, 635–640 CrossRef CAS.
- L. M. Cabalin, A. Ruperez and J. J. Laserna, Anal. Chim. Acta, 1996, 318, 203–210 CrossRef CAS.
- B. B. Xu, Z. C. Ma, H. Wang and X. Q. Liu, Electrophoresis, 2011, 32, 3378–3384 CrossRef CAS PubMed.
- B. B. Xu, H. Wang and Z. C. Ma, ACS Nano, 2014, 8, 6682–6692 CrossRef CAS PubMed.
- R. G. Freeman, K. C. Grabar, K. J. Allison, R. M. Bright, J. A. Davis, A. P. Guthrie, M. B. Hommer, M. A. Jackson, P. C. Smith, D. G. Walter and M. J. Natan, Science, 1995, 267, 1629–1632 CrossRef CAS PubMed.
- J. W. Liu, J. H. Zhu, C. L. Zhang, H. W. Liang and S. H. Yu, J. Am. Chem. Soc., 2010, 132, 8945–8952 CrossRef CAS PubMed.
- H. H. Wang, C. Y. Liu, S. B. Wu, N. W. Liu, C. Y. Peng, T. H. Chan, C. F. Hsu, J. K. Wang and Y. L. Wang, Adv. Mater., 2006, 18, 491–495 CrossRef CAS.
- K. A. Willets and R. P. VanDuyne, Annu. Rev. Phys. Chem., 2007, 58, 267–297 CrossRef CAS PubMed.
- K. C. Grabar, R. G. Freeman, M. B. Hommer and M. J. Natan, Anal. Chem., 1995, 67, 735–743 CrossRef CAS.
- H. Ko, S. Singameaneni and V. V. Tsukruk, Small, 2008, 4, 1576–1599 CrossRef CAS PubMed.
- J. Turkevich, P. C. Stevenson and J. Hillier, Discuss. Faraday Soc., 1951, 11, 55–74 RSC.
- G. Frens, Nature, 1973, 241, 20–22 CAS.
- V. K. LaMer and R. H. Dinegar, J. Am. Chem. Soc., 1950, 72, 4847–4854 CrossRef CAS.
- K. P. Velikov, G. E. Zegers and A. VanBlaaderen, Langmuir, 2003, 19, 1384–1389 CrossRef CAS.
- X. H. Ji, X. N. Song, J. Li, Y. B. Bai, W. S. Yang and X. G. Peng, J. Am. Chem. Soc., 2007, 129, 13939–13948 CrossRef CAS PubMed.
- X. Y. Dong and X. H. Ji, J. Phys. Chem. C, 2009, 113, 6573–6576 CAS.
- J. W. Zhou, A. V. Ellis and N. H. Voelcker, Electrophoresis, 2010, 31, 2–16 CrossRef CAS PubMed.
- G. Chen, Y. Y. Wang, H. L. Wang and M. Cong, RSC Adv., 2014, 4, 54434–54440 RSC.
- H. Z. Zhao, Y. Xu, C. Y. Wang, R. Wang, S. T. Xiang, and L. Chen, RSC Adv., 2016, 6, 14105–14111 RSC.
- W. Huttner, K. Christou, A. Gohmann, V. Beushausen and H. Wackerbarth, Microfluid. Nanofluid., 2012, 12, 521–527 CrossRef.
- H. Y. Mao, W. G. Wu, D. D. She, G. C. Sun, P. P. Lv and J. Xu, Small, 2014, 10, 127–134 CrossRef CAS PubMed.
- L. Wu, Z. Y. Wang, S. F. Zong and Y. P. Cui, Biosens. Bioelectron., 2014, 62, 13–18 CrossRef CAS PubMed.
- M. P. Cecchini, J. Hong, C. Lim, J. Choo, T. Albrecht, A. J. deMello and J. B. Edel, Anal. Chem., 2011, 83, 3076–3081 CrossRef CAS PubMed.
- Q. Wang, C. Du, J. Zhang, R. Q. Lv and Y. Zhao, Opt. Commun., 2016, 377, 89–93 CrossRef CAS.
- F. Liao, Z. F. Wang and X. Q. Hu, Ionics, 2011, 17, 177–182 CrossRef CAS.
- M. W. Meyer and E. A. Smith, Analyst, 2011, 136, 3542–3549 RSC.
- L. Suber, I. Sondi, E. Matijevic and D. V. Goia, J. Colloid Interface Sci., 2005, 288, 489–495 CrossRef CAS PubMed.
- A. Tao, P. Sinsermsuksakul and P. D. Yang, Angew. Chem., Int. Ed., 2006, 45, 4597–4601 CrossRef CAS PubMed.
- V. Sharma, K. Park and M. Srinivasarao, Proc. Natl. Acad. Sci. U. S. A., 2009, 106, 4981–4985 CrossRef CAS PubMed.
- Z. Dogic, A. P. Philipse, S. Fraden and J. K. G. Dhont, J. Chem. Phys., 2000, 113, 8368–8380 CrossRef CAS.
- J. M. Peterson, J. Chem. Phys., 1964, 40, 2680–2686 CrossRef CAS.
- L. J. Lapidus, S. Yao, K. McGarrity, D. Hertzog, E. Tubman and O. Bakajin, Biophys. J., 2007, 93, 218–224 CrossRef CAS PubMed.
- L. Zhu, K. Ghosh, M. King, T. Cellmer, O. Bakajin and L. J. Lapidus, J. Phys. Chem. B, 2011, 115, 12632–12637 CrossRef CAS PubMed.
- L. Zhu, N. Kurt, J. Choi, L. Lapidus and S. Cavagnero, J. Phys. Chem. B, 2013, 117, 7868–7877 CrossRef CAS PubMed.
- M. Hüttemann, P. Pecina, M. Rainbolt, T. H. Sanderson, V. E. Kagan, L. Samavati, J. W. Doan and I. Lee, Mitochondrion, 2011, 11, 369–381 CrossRef PubMed.
- L. L. Qu, D. W. Li, L. X. Qin, J. Mu, J. S. Fossey and Y. T. Long, Anal. Chem., 2013, 85, 9549–9555 CrossRef CAS PubMed.
- N. A. Brazhe, A. B. Evlyukhin, E. A. Goodilin and A. A. Semenova, Sci. Rep., 2015, 5, 13793, DOI:10.1038/srep 13793.
- L. Chen, X. X. Han, J. X. Yang, J. Zhou, W. Song, B. Zhao, W. Q. Xu and Y. Ozaki, J. Colloid Interface Sci., 2011, 360, 482–487 CrossRef CAS PubMed.
- J. Li, B. Parker, C. Martyn, C. Natarajan and J. Guo, Mol. Neurobiol., 2013, 47, 673–698 CrossRef CAS PubMed.
- K. F. Mittendorf, B. M. Kroncke, J. Meiler and C. R. Sanders, Biochemistry, 2014, 53, 6139–6141 CrossRef CAS PubMed.
- M. Sakakura, A. Hadziselimovic, Z. Wang, K. L. Schey and C. R. Sanders, Structure, 2011, 19, 1160–1169 CrossRef CAS PubMed.
- A. L. Jenkins, R. A. Larsen and T. B. Williams, Spectrochim. Acta, Part A, 2005, 61, 1585–1594 CrossRef PubMed.
- B. Sjöberg, S. Foley, B. Cardey and M. Enescu, Spectrochim. Acta, Part A, 2014, 128, 300–311 CrossRef PubMed.
- F. C. Nascimento, C. E. A. Carneiro, H. D. Santana and D. A. M. Zaia, Spectrochim. Acta, Part A, 2014, 118, 251–259 CrossRef CAS PubMed.
- M. Jackson and H. H. Mantsch, Biochim. Biophys. Acta, 1991, 1078, 231–235 CrossRef CAS.
- R. C. Lord and N. T. Yu, J. Mol. Biol., 1970, 50, 509–524 CrossRef CAS PubMed.
- P. R. Carey, Biochemical Applications of Raman and Resonance Raman Spectroscopies, Academic press, New York, 1982, pp. 71–98 Search PubMed.
- I. R. Nabiev and A. Savchenko, J. Raman Spectrosc., 1983, 4, 375–378 CrossRef.
- A. T. Tu, Raman Spectroscopy in Biology: Principles and Applications, John Wiley & sons, New York, 1882, pp. 65–96 Search PubMed.
- G. J. J. Thomas and Y. Kyogoku, Biological Science In Infrared and Raman Spectroscopy (Part C), Inc., Maryland, 1977, pp. 717–872 Search PubMed.
- J. M. Benevides, G. Chan, X. J. Lu, W. K. Olson, M. A. Weiss and G. J. Thomas, Biochemistry, 2000, 39, 537–547 CrossRef CAS PubMed.
- S. A. Overman and G. J. Thomas, Biochemistry, 1998, 37, 5654–5665 CrossRef CAS PubMed.
Footnote |
| † Electronic supplementary information (ESI) available. See DOI: 10.1039/c6ra25173k |
| This journal is © The Royal Society of Chemistry 2017 |