 Open Access Article
Preparation and properties of a novel graphene fluoroxide/polyimide nanocomposite film with a low dielectric constant
Xiao Chen,
Haohao Huang*,
Xia Shu,
Shumei Liu and
Jianqing Zhao*
College of Materials Science and Engineering, South China University of Technology, Guangzhou, 510640, China. E-mail: hhhuang@scut.edu.cn; psjqzhao@scut.edu.cn; Tel: +86-20-87110966
First published on 12th January 2017
Abstract
This paper introduces an effective approach to fabricate novel graphene/polyimide nanocomposite films with a low dielectric constant. Graphene fluoroxide (GFO) nanosheets were produced through the exfoliation of graphite fluoroxide (GiFO) in N-methyl-2-pyrrolidone (NMP). GFO nanosheets reacted with 4,4′-diaminodiphenyl ether (ODA) to become ODA-functioned GFO (GFO-ODA) with amine end groups, which provided reactive sites for covalent bonding with PI chains. GFO-ODA/PI composite films were prepared via the thermal imidization of a GFO-ODA/PAA solution. In this composite, GFO-ODA nanosheets were chemically bonded to the PI matrix. The dielectric constant of the films depended on the loading of GFO-ODA and its minimum value reached 2.75 (at 106 Hz) when the content of GFO-ODA was 1.0 wt%. Strong GFO-ODA nanosheets facilitate the load transfer and enhance the mechanical properties of PI films. GFO-ODA/PI film with 1.0 wt% loading had a Young's modulus ∼40% larger than pure PI film. In addition, the incorporation of GFO-ODA increased the glass transition temperature of the films and had no significant effect on the thermal stability.
1. Introduction
Polyimide (PI), one of the high performance dielectric materials, has been used in microelectronics for interconnections and packaging, because of its excellent thermal stability, mechanical properties, and good chemical resistance, as well as relatively low dielectric constant (ε).1–3 PI possesses a lower dielectric constant in the range of 3.4–3.7 than traditional dielectric materials, such as silica. However, with the rapid development of microelectronics, the dielectric constant of common PI is still too high to meet the requirement for ultra-large-scale integration multilevel interconnections.2 The formation of intra- and inter-chain charge transfer complex in PI results in a relatively high dielectric constant for PI.4 It is well known that the incorporation of fluorinated substituents into polymers can decrease the dielectric constant due to the high electronegativity of the fluorine atoms and the low polarizability of the C–F bond as well as the increase in free volume.5–7 Nevertheless, the introduction of fluorinated groups into monomers usually decreases the activity of the diamine, resulting in poor mechanical properties of polyimide because of the low molecular weight.5 Therefore, preparation of fluorinated PI with low dielectric constant and relatively high mechanical properties is still a great challenge.In the past years, increasing scientific and industrial attention has been paid to the graphene-containing polymer composites because of their extraordinary physical and chemical properties. Graphene is a two-dimensional (2D) network of carbon atoms and has attracted intensive interest since its successful exfoliation from graphite.8 Graphene is considered to be the strongest material ever measured due to its Young's modulus of ∼1 TPa and strength of ∼130 GPa.9 Moreover, graphene has high thermal conductivity and charge carrier mobility, which are 5000 W m−1 K−1 and 0.25 × 106 cm2 V−1 s−1, respectively.10,11 These properties, together with extremely high surface area and gas impermeability,12 provide a great potential in fabricating high performance polymer composites for graphene.13–15
In order to improve the surface and dispersion properties of graphene, graphene was often modified to obtain graphene oxide (GO) or graphene fluoride (GF). Graphene oxide is considered to be more hydrophilic than graphene because of the oxygen-containing functional groups.16–18 As a result, GO can be readily dispersed in polar solvents and matrix.19,20 GF is an optical transparent semiconductor with a wide bandgap (∼3 eV), relatively high Young's modulus (∼0.3 TPa), and high-quality insulating property (>1012 Ω).21–23 GF is well-known for its applications in lithium ion batteries,21,24 lubricants,25 thermoelectric devices,26 and photoluminescence materials.27 Recently, Ho et al.28 investigated the dielectric constant of multi-layer GF, which was found to be only ∼1.2. Therefore, GF is expected to be an ideal nano-filler to decrease the dielectric constant of PI film. Recently, graphene fluoroxide (GFO), combining the properties of both GO and GF, has found applications in optical limiting applications,29 amphiphobic coating,30 primary lithium batteries,31 and drug delivery.32
In the present paper, functioned GiFO was employed to fabricate a series of PI composite films. Graphite fluoride (GiF) as raw material was first oxidized to prepare graphite fluoroxide (GiFO) based on the process described in our previous work.33 Then GFO was obtained by exfoliating GiFO and was modified with excess 4,4′-diaminodiphenyl ether (ODA). The amine-modified GFO nanosheets (GFO-ODA) provided a reactive platform for covalently bonding with PI chains. The dielectric, mechanical, and thermal properties of the GFO-ODA/PI films were examined at various GFO-ODA loadings. For the purpose of comparison, PI composite films with GF or GFO were also prepared.
2. Experimental
2.1. Materials
GiF powder with a fluorine content of 28.4 wt% was obtained from Alfa Aesar (China). Concentrated sulfuric acid (H2SO4), phosphorus pentoxide (P2O5), potassium permanganate (KMnO4), sodium nitrate (NaNO3), potassium persulfate (K2S2O8), concentrated hydrochloric acid (HCl), 30% hydrogen peroxide (H2O2) solution, and ethanol were purchased from Guangzhou Chemical Reagent Factory (China). Above reagents were all of analytical grade and used as received. N-Methyl-2-pyrrolidone (NMP) was also purchased from Guangzhou Chemical Reagent Factory (China), and was left overnight in the presence of P2O5 and then distilled under reduced pressure before use. 4,4′-Diaminodiphenyl ether (ODA, 98%) was obtained from TCI Co., Ltd. (Japan) and was dried in vacuum at 60 °C for 24 h prior to use. Pyromellitic dianhydride (PMDA, 99%) was supplied by Aladdin Chemistry Co., Ltd. (China) and was dried in vacuum at 140 °C for 48 h prior to use.2.2. Synthesis of GFO and GFO-ODA
Polyimide nanocomposite was prepared following the procedure illustrated in Scheme 1. First, GiFO nanosheets were synthesized from GiF powder with the routine as previously reported.33 Typically, GiF powder (2 g) was added into a mixture of K2S2O8 (1 g), P2O5 (1 g), and concentrated H2SO4 solution (15.2 mL). After stirring at 80 °C for 8 h, a resultant dark mixture was obtained. After being cooled to room temperature, the mixture was diluted with distilled water. The pre-oxidized product was washed with distilled water to remove any residual acid and dried overnight at 60 °C in an air oven. The pre-oxidized product was then subjected to oxidation via the modified Hummers method.34The pre-oxidized product was added into the mixture of concentrated H2SO4 solution (54 mL) and NaNO3 (1 g). After being cooled to 0–5 °C, the mixture was stirred for 15 min and KMnO4 (6 g) was added in five batches, and then successively reacted at 0–5 °C for 4 h, at 35 °C for 2 h, and at 95 °C for 15 min. During the last stage, 80 mL distilled water was slowly added. The reaction was terminated by the addition of 400 mL distilled water and 10 mL 30% H2O2 solution. After being left overnight, a dark brown solid precipitated out of the solution, while a light grey phase floated on the dispersion surface. The precipitate was collected via centrifugation and washed with concentrated HCl solution and with distilled water repeatedly until the supernatant became neutral. The GiFO sample was obtained after being freeze dried.
To synthesize GFO-ODA nanosheets, GFO suspension was first obtained by exfoliating GiFO in NMP. Then 0.3 g ODA was added into 100 mL GFO suspension (1.0 mg mL−1) and then stirred at 60 °C for 24 h in nitrogen atmosphere. To remove the excess ODA, the mixture was filtered and washed with NMP for a few times. The GFO-ODA sample was finally obtained after being dried in vacuum overnight.
2.3. Preparation of GFO-ODA/PI composite films
Typically, 0.0107 g GFO-ODA was dispersed in NMP by sonication for 2 h. To synthesize the PI-precursor (poly(amic acid), PAA), 1.0339 g of ODA (5.00 mmol) was put into a three-neck flask containing GFO-ODA suspension under nitrogen purge at room temperature. When ODA was completely dissolved, 1.1149 g of PMDA (5.05 mmol) was introduced to the flask in four batches. After being stirred overnight, a viscous GFO-ODA/PAA solution was obtained. This mixture was subsequently cast on glass dishes which had been cleaned with distilled water, and the sample was then thermal imidized sequentially at 80 °C for 1 h, 100 °C for 1 h, 200 °C for 1 h, and 300 °C for 2 h in a vacuum oven. Upon thermal imidization, a PI composite film containing 0.5 wt% GFO-ODA was obtained. The GFO-ODA/PI films with 1.0 wt% and 2.0 wt% of GFO-ODA were also prepared using the same procedure. For purpose of comparison, the PI films incorporated with GF or GFO nanosheets were also prepared via the same method.2.4. Characterization
Fourier transform infrared spectra (FT-IR) from 400 to 4000 cm−1 were recorded by a VERTEX70 spectrometer (Bruker, Germany). X-ray photoelectron spectroscopy (XPS) analysis was carried out on an Axis Ultra DLD X-ray photoelectron spectrometer (Kratos, UK) with Al Kα radiation (hν = 1486.6 eV). X-ray diffraction (XRD) measurements were performed on a D8 Advance X-ray diffractometer (Bruker, Germany) with Cu Kα radiation (λ = 0.15418 nm). Step scanning was used with 2θ intervals from 5° to 30°. Raman spectra were obtained on a LabRAM Aramis Micro-Raman spectrometer (HORIBA, France) using Helaser beam excitation (λ = 632.8 nm). Thermogravimetric analysis (TGA) was carried out on a TG209F1 instrument (NETZSCH, Germany) from 30 to 900 °C under nitrogen flow at a heating rate of 10 °C min−1. To measure the modulus and tensile strength of PI composite films, samples were cut into sheets with a width of 10 mm, and were tested on a material testing system (Instron 5967, US) according to ASTM D882-12 standard. The speed of the crosshead was 5 mm min−1. An average of at least five individual determinations was used. The thermal dynamic mechanical behavior and glass transition temperature (Tg) of PI composite films were carried out on dynamic mechanical analyzer (DMA, NETZSCH 242C, Germany). All the tests were run from 30 to 400 °C at a heating rate of 3 °C min−1 and a frequency of 1 Hz. The morphology of the fractured surfaces of PI composite films was observed on a scanning electron microscope (SEM, FEI Nova NonaSEM430, US) at an accelerating voltage of 10.0 kV. Dielectric properties of PI composite films were measured using a broadband dielectric/impedance spectrometer (Novocontrol ALPHa-ANB, Germany) in the frequency range of 10−2 to 107 Hz. Specimens for dielectric test were prepared with the structure of silver paste/PI film/silver paste.3. Results and discussion
3.1. Characterization of GiFO and GFO-ODA
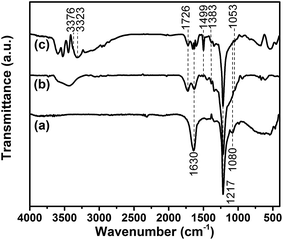
FT-IR measurement is conducted to characterize the chemical structures of GiFO and GiFO-ODA after the oxidation and modification processes. Their FT-IR spectra are presented in Fig. 1. The characteristic absorption bands at 1217 cm−1 and at 1080 cm−1 of GiF are attributed to the stretching vibration of covalent C–F bonds and semi-ionic C–F bonds, respectively.35,36 Its absorption band at 1630 cm−1 related to the stretching vibration of C![[double bond, length as m-dash]](https://www.rsc.org/images/entities/char_e001.gif) C bonds is due to the presence of graphitic phase in commercial unsaturated GiF.33,37–39 FT-IR spectrum of GiFO shows characteristic absorption bands at 1726 cm−1 (C
C bonds is due to the presence of graphitic phase in commercial unsaturated GiF.33,37–39 FT-IR spectrum of GiFO shows characteristic absorption bands at 1726 cm−1 (C![[double bond, length as m-dash]](https://www.rsc.org/images/entities/char_e001.gif) O stretching vibration), 1348 cm−1 (C–O stretching vibration), and 1053 cm−1 (C–O–C stretching vibration).40,41 The stretching vibration of O–H bonds in the region of 3190–3660 cm−1 is from the hydroxyl groups, carboxyl groups of GiFO, and the residual water trapped between nanosheets. The band at 1630 cm−1 of GiFO becomes weaker because of the smaller graphitic domains in GiFO. After the modification of GFO with ODA, the spectrum of GFO-ODA presents additional peaks at 3376 and 3323 cm−1, which are ascribed to the symmetric and asymmetric stretching vibration of N–H in aromatic amine. The modification of GFO is the nucleophilic attack by amine on the epoxy groups, and hence the absorption band of C–O–C stretching vibration reduced after modification. Moreover, the stretching vibration of phenyl framework at 1499 cm−1 also implies that ODA units are grafted onto GFO nanosheets.42
O stretching vibration), 1348 cm−1 (C–O stretching vibration), and 1053 cm−1 (C–O–C stretching vibration).40,41 The stretching vibration of O–H bonds in the region of 3190–3660 cm−1 is from the hydroxyl groups, carboxyl groups of GiFO, and the residual water trapped between nanosheets. The band at 1630 cm−1 of GiFO becomes weaker because of the smaller graphitic domains in GiFO. After the modification of GFO with ODA, the spectrum of GFO-ODA presents additional peaks at 3376 and 3323 cm−1, which are ascribed to the symmetric and asymmetric stretching vibration of N–H in aromatic amine. The modification of GFO is the nucleophilic attack by amine on the epoxy groups, and hence the absorption band of C–O–C stretching vibration reduced after modification. Moreover, the stretching vibration of phenyl framework at 1499 cm−1 also implies that ODA units are grafted onto GFO nanosheets.42
XPS spectra of GFO and GFO-ODA are given in Fig. 2. In Fig. 2(a) for C 1s spectrum of GiFO, some typical peaks for oxygen-containing groups, such as C![[double bond, length as m-dash]](https://www.rsc.org/images/entities/char_e001.gif) O (287.1 eV) and C–O (286.1 eV), can be observed, suggesting that GiF have been oxidized to GiFO. The C 1s spectrum of GFO-ODA in Fig. 2(b) shows a significant decrease in C–O content, and the peak for C–N (284.9 eV) confirms that ODA units are covalently attached to GFO nanosheets. This can be further verified by the peaks at 399.6 eV (–NH2 in amino groups) and 401.3 eV (C–N groups) in the N 1s spectrum of GFO-ODA in Fig. 2(c). Therefore, the result from XPS spectra coincides with the one of FT-IR, indicating the ODA units are successfully incorporated to the GFO nanosheets. The fluorination degree of GiF and GFO-ODA are also characterized by XPS. The fluorine content of GFO-ODA is 16.29%, slightly lower than 20.62% of GiF.
O (287.1 eV) and C–O (286.1 eV), can be observed, suggesting that GiF have been oxidized to GiFO. The C 1s spectrum of GFO-ODA in Fig. 2(b) shows a significant decrease in C–O content, and the peak for C–N (284.9 eV) confirms that ODA units are covalently attached to GFO nanosheets. This can be further verified by the peaks at 399.6 eV (–NH2 in amino groups) and 401.3 eV (C–N groups) in the N 1s spectrum of GFO-ODA in Fig. 2(c). Therefore, the result from XPS spectra coincides with the one of FT-IR, indicating the ODA units are successfully incorporated to the GFO nanosheets. The fluorination degree of GiF and GFO-ODA are also characterized by XPS. The fluorine content of GFO-ODA is 16.29%, slightly lower than 20.62% of GiF.
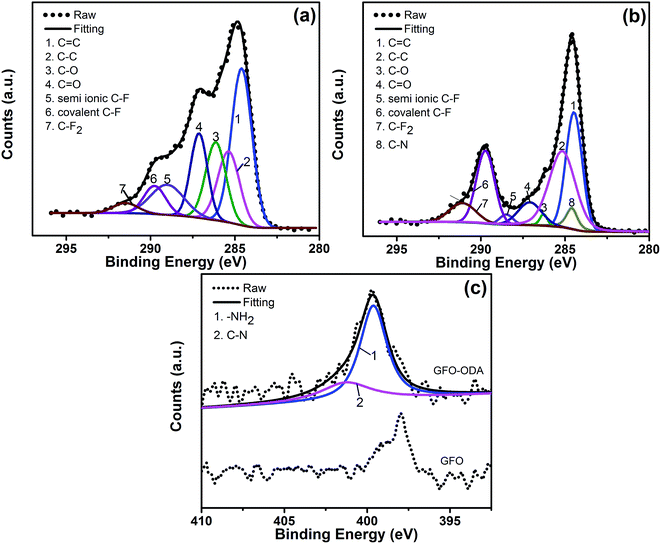 | ||
| Fig. 2 High resolution C 1s XPS spectra of GiFO (a) and GFO-ODA (b); N 1s XPS spectrum of GiFO and GFO-ODA (c). | ||
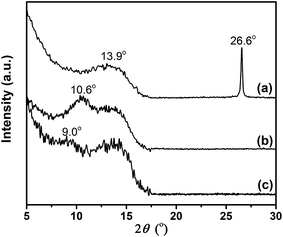
The structural differences between GiF, GiFO, and GFO-ODA were investigated by XRD (Fig. 3). There are the peaks centered at around 13.9° for all three samples, corresponding to an interlayer spacing of 0.64 nm. These peaks are related to the C–F bonds, suggesting the transformation of the sp2 bonding in grapheme to the sp3 bonding in GiF, GiFO, and GFO-ODA.43 The narrow and sharp peak (002) at 26.6° in the XRD pattern of GiF indicates that the nanosheets possess graphitic domains. For GiFO, the presence of the broad peak at ∼10.6° and the absence of the peak at ∼26.6° suggest that the oxygen-containing functional groups are bonded to GiFO nanosheets and the interlayer spacing is thereby broadened to 0.83 nm.29,33 Because of the intercalation of ODA into GiFO layers, the interlayer distance of GFO-ODA nanosheets is enlarged to 0.98 nm. According to these results, one can conclude that ODA units have successfully been bonded to the nanosheets.
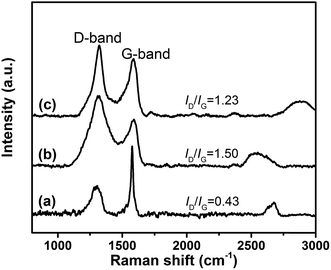
Fig. 4 illustrates the Raman spectra of GiF and its derivatives. For all samples, there are two strong Raman peaks. The G-bands at ∼1575 cm−1 correspond to the E2g vibrational mode of C–C with sp2 hybridization localized inside the planar sheets of graphite, and the D-band at ∼1320 cm−1 is attributed to the A1g mode in the disordered edge region of the nanosheets.38 Hence, the ratio between the intensities of D-band and G-band (ID/IG) characterizes the number of defects in nanosheets. The values of ID/IG increases from 0.43 for GiF to 1.50 for GiFO due to the defects introduced by oxidation. Compared with GiFO, a slightly reduced value of ID/IG is obtained for GFO-ODA, indicating that nearly no more defects were introduced in GFO-ODA and partial reduction occurred simultaneously during the modification.
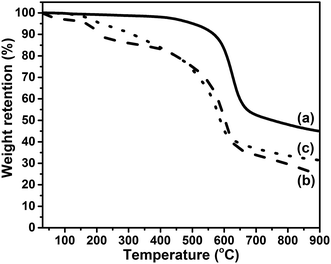
TGA is employed to examine the thermal stability of the prepared GFO-ODA. In Fig. 5, TGA curve of GiF shows a weight loss beginning at 400 °C, which is related to the detachment of fluorine atoms and the decomposition of the carbon skeleton.43,44 For the as-prepared GiFO, the weight loss happens below 150 °C due to the removal of residual water trapped in the lamellar structure.45,46 On the contrary, the curve of GFO-ODA shows almost no weight loss below 100 °C due to the partial reduction during modification, which leads less water trapped in GFO-ODA. With the temperature increasing, the TGA curves of GiFO and GFO-ODA show another two major weight loss stages. In the temperature range of 150–300 °C, both of GiFO and GFO-ODA suffer weight loss due to the decomposition of the thermally unstable oxygen-containing functional groups, such as hydroxyl and epoxy groups.17,40 Then a more significant weight loss occurs from 300 to 700 °C, in which the removal of relatively more stable oxygen-containing functional groups takes place and the char is expected to become the sp2-hybridized carbon.40,46,47 Differing from GiFO, GFO-ODA decomposes at a more rapid rate in the range of 300–450 °C, which may be ascribed to the thermal degradation of ODA units in addition to the oxygen-containing functional groups. It is worth noting that the char yield of GFO-ODA (∼32 wt%) is larger than that of GiFO (∼25 wt%). The difference in char yield may be due to the partially reduction of GiFO while being modified,46,47 consistent with the results obtained above.
3.2. PI morphology
The SEM images of the fractured surfaces of PI films after tensile testing are presented in Fig. 6. The morphology can be used to evaluate the dispersion and compatibility of fillers in PI matrix. The pure PI film possesses a rather smooth and flat fractured surface (Fig. 6(a)). The slightly bright dots and lines indicate that PI film is stretched out upon mechanical deformation. For the GF/PI film, the GF nanosheets aggregated in the PI matrix (arrow in Fig. 6(b)) due to the relatively low surface energy derived from the presence of fluorine atoms. In contrast, the fractured surface of GFO/PI film shows a layered structure, indicating the relatively good dispersion in the PI matrix. Compared with the pure PI film, GFO-ODA/PI film with 1.0 wt% loading has a rougher fractured surface, which can be ascribed to the strong interfacial interactions and the good compatibility between GFO-ODA and PI matrix. As a result, the stress can be transferred from the matrix to the nanosheets. When the content of fillers reaches a critical value, the aggregates of nanosheets tend to form. As the loading of GFO-ODA is increased to 2.0 wt%, some of nanosheets are pulled out during deformation, generating micron-scale holes in the PI matrix (Fig. 6(f)).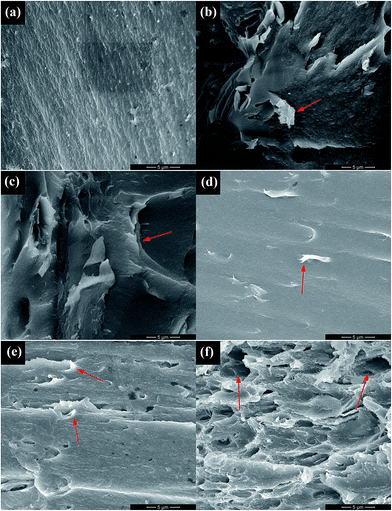 | ||
| Fig. 6 SEM images of (a) pure PI film, (b) GF/PI film, (c) GFO/PI film, and GFO-ODA/PI films at various loadings: (d) 0.5 wt%, (e) 1.0 wt%, and (f) 2.0 wt%. | ||
3.3. Dielectric properties of films
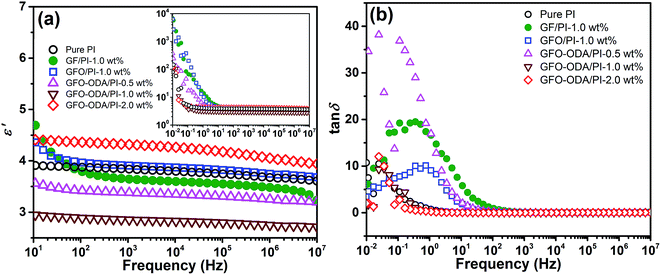
Complex dielectric constant (ε*) can be expressed as ε* = ε′ − iε′′, where ε′ is the real part and ε′′ is the imaginary part, respectively. ε′ is a measure of the energy stored in the dielectrics through polarization, whereas the loss tangent tan![[thin space (1/6-em)]](https://www.rsc.org/images/entities/char_2009.gif) δ measures the amount of energy dissipated during molecular motion in the presence of the alternating electric field.
δ measures the amount of energy dissipated during molecular motion in the presence of the alternating electric field.
The dependence of the dielectric constants on frequency at room temperature is shown in Fig. 7(a). Under an alternating electric field, the polarization occurs and the dipoles cannot keep up with the variation of the electric field, which results in the decrease of ε′ with the increase of frequency. The dielectric constants at 106 Hz of pure PI film and PI composite films are summarized in Table 1. Here ε′ of pure PI film and PI composite films at 106 Hz are selected for comparison because the frequency range from 101 to 106 Hz is very important for practical applications in microelectronics.48 GFO-ODA adsorbs and interacts with PI chains. Consequently, GFO-ODA hinders the motion of dipolar moieties and restricts the relaxation of dipoles of PI. It is interesting to see that the dielectric constant of GFO-ODA/PI films does not monotonously decrease with the loading of GFO-ODA. The dielectric constant first decreases with the loading of GFO-ODA until it reaches the minimum value of 2.75 at the loading of 1.0 wt%. However, the dielectric constant of the film with 2.0 wt% GFO-ODA abnormally increases to 4.05, even larger than that of pure PI film. As discussed above, GFO-ODA nanosheets at high contents may aggregate. In the process of preparing GFO-ODA/PAA solutions, the aggregation of GFO-ODA makes it hard for PAA chains to intercalate with GFO-ODA, promoting the microphase separation and less effective restriction on the PI chains. In addition, the interface between the aggregate and PI matrix generates an interfacial polarization. Consequently, both effects lead to a high dielectric constant for 2.0 wt% GFO-ODA/PI. For comparison, the dielectric properties of GF/PI and GFO/PI films are also studied. The introduction of GF into PI resin reduces the dielectric constant of GF/PI film to 3.48, which was slightly lower than that of pure PI film. The decrease in the dielectric constant has its origin in high electronegativity of the fluorine atoms and the low polarizability of the C–F bond, as well as the lowered water absorption. For GFO/PI film, however, its dielectric constant increased to 3.75, mainly due to the hydrophilic nature of oxygen-containing functional groups. In Fig. 7(b), the loss tangent peaks of GF/PI and GFO/PI films shift to the higher frequencies compared with pure PI, indicating the weakened interactions between PI chains. In contrast, the loss peak of GFO-ODA/PI film with 1.0 wt% loading shifts to lower frequencies compared with GFO/PI film, which suggests the modification of GFO with ODA can effectively improve the interaction between nanosheets and PI matrix.
| Samples | Content of filler (wt%) | ε′ (106 Hz) |
|---|---|---|
| Pure PI | — | 3.68 |
| GF/PI | 1.0 | 3.48 |
| GFO/PI | 1.0 | 3.75 |
| GFO-ODA/PI | 0.5 | 3.25 |
| GFO-ODA/PI | 1.0 | 2.75 |
| GFO-ODA/PI | 2.0 | 4.05 |
Slightly larger values of dielectric constants of GFO-ODA/PI in the lower frequency range may be originated from one or more polarizations, such as interfacial polarization or Maxwell–Wagner–Sillars effect, electrode polarization, and conductivity phenomena.49 It is more effective to employ electric modulus formalism rather than dielectric constant formalism to analyze the information given in the dielectric spectroscopy, since the large variation in dielectric constants and loss factors at low frequencies can be minimized in electric modulus formalism.49–51 By using electric modulus formalism, some problems in the analysis of dielectric relaxation in the dielectric constant formalism, such as the contact of electrode/specimen, the space charges injection phenomena, or absorbed impurity, can be solved or even neglected. The complex electric modulus (M*) is defined as the inverse of the complex dielectric constant,
 | (1) |
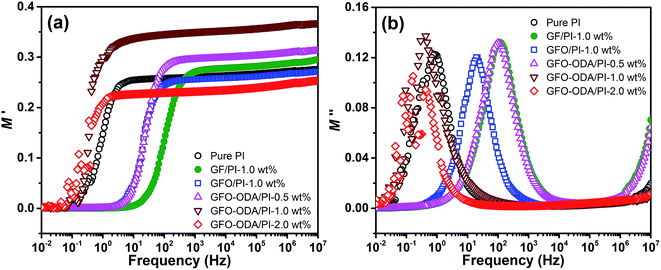 | ||
| Fig. 8 Real (a) and imaginary (b) parts of electric modulus vs. frequency for pure PI and PI composite. | ||
3.4. Tensile tests
The effect of GFO-ODA loading on the mechanical properties of PI composite films is summarized in Table 2. GFO-ODA nanosheets with amino groups can provide reactive sites for the polymerization of PAA and strongly interact with PI matrix. Furthermore, GFO-ODA nanosheets may act as the cross-linking agent to restrict the chains movement, which improves the mechanical properties of GFO-ODA/PI films. As expected, with 1.0 wt% GFO-ODA loading, Young's modulus and tensile strength of GFO-OFA/PI film are significantly increased to 3.89 GPa and 110 MPa from 2.82 GPa and 97.0 MPa for pure PI, respectively. The reinforcement can be attributed to the good dispersion of GFO-ODA nanosheets in PI matrix. Since the nanosheets strongly interact with PI chains via covalent bonding, the load can be efficiently transferred from the matrix to the strong nanosheets and hence improves the mechanical properties of GFO-ODA/PI films. Simultaneously, the elongation at break declines to only 10.9%, indicating that the film becomes less flexible. As the GFO-ODA loading increases to 2.0 wt%, both of Young's modulus and the tensile strength do not change significantly.| Samples | Content of filler (wt%) | Young's modulus (GPa) | Tensile strength (MPa) | Elongation at break (%) |
|---|---|---|---|---|
| Pure PI | — | 2.82 ± 0.03 | 97.0 ± 1.8 | 47.0 ± 0.7 |
| GF/PI | 1.0 | 3.44 ± 0.11 | 101 ± 4.0 | 43.1 ± 3.6 |
| GFO/PI | 1.0 | 3.79 ± 0.10 | 107 ± 2.1 | 30.0 ± 2.6 |
| GFO-ODA/PI | 0.5 | 3.54 ± 0.21 | 105 ± 5.3 | 23.9 ± 2.8 |
| GFO-ODA/PI | 1.0 | 3.89 ± 0.08 | 110 ± 1.3 | 10.9 ± 2.7 |
| GFO-ODA/PI | 2.0 | 3.88 ± 0.09 | 107 ± 3.9 | 11.5 ± 1.9 |
The mechanical properties of GF/PI and GFO/PI films are also measured. Young's modulus of the former is ∼20% greater than that of pure PI film, while the elongation at break hardly changes due to the weak interaction between GF and the PI matrix. Besides, the low surface energy of GF makes it difficult to be dispersed well so that the contact area between GF and PI matrix is too small to transfer stress efficiently. The elongation at break for the GFO/PI film, however, is decreased to 30.0%. The reason may be that GFO nanosheets act as the physical cross-linking agents via the hydrogen bonds between the oxygen-containing functional groups on GFO nanosheets and the polar groups in PI chains. The incorporation of GFO restricts the movement of the PI chains and makes the GFO/PI film brittle.
Both Young's modulus and tensile strength of GFO/PI film are smaller than those of GFO-ODA/PI film at the same content of GFO. The good dispersion of nanosheets within the PI matrix and the strong interaction between the fillers and matrix are responsible for the improved mechanical properties of PI composite films.
3.5. Dynamic mechanical properties
The storage modulus (E′) and loss tangent (tan![[thin space (1/6-em)]](https://www.rsc.org/images/entities/char_2009.gif) δ) are characterized by DMA (Fig. 9), and the data are listed in Table 3. Among PI composite films with different fillers at 1 wt% content, GFO-ODA/PI film possesses the maximum value of E′, whereas GF/PI film has the minimum value. Such behaviors are due to the different strengths of interaction between the nanosheets and PI matrix as discussed above. The glass transition temperatures (Tg) of these composite films follows the order of E′. GFO-ODA/PI film possesses the maximum increase of Tg because of the effective restriction of PI chains.
δ) are characterized by DMA (Fig. 9), and the data are listed in Table 3. Among PI composite films with different fillers at 1 wt% content, GFO-ODA/PI film possesses the maximum value of E′, whereas GF/PI film has the minimum value. Such behaviors are due to the different strengths of interaction between the nanosheets and PI matrix as discussed above. The glass transition temperatures (Tg) of these composite films follows the order of E′. GFO-ODA/PI film possesses the maximum increase of Tg because of the effective restriction of PI chains.
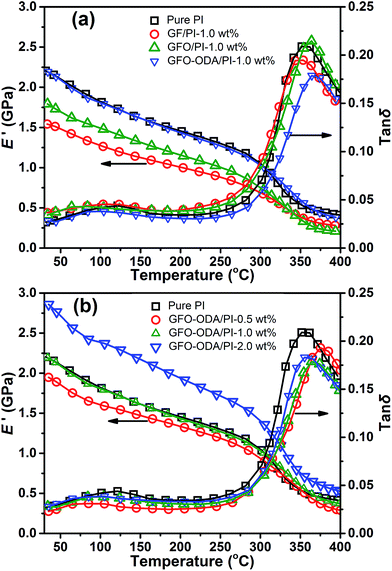 | ||
Fig. 9 Storage modulus and tan![[thin space (1/6-em)]](https://www.rsc.org/images/entities/char_2009.gif) δ in DMA of (a) PI composite films with various fillers and (b) GFO-ODA/PI films at different contents. δ in DMA of (a) PI composite films with various fillers and (b) GFO-ODA/PI films at different contents. | ||
| Samples | Content of filler (wt%) | DMA | TGA | ||
|---|---|---|---|---|---|
| E′a (GPa) | Tgb (°C) | T5dc (°C) | Char yieldd (wt%) | ||
a Determined by DMA at about 30 °C.b Determined by DMA at maximum of tan![[thin space (1/6-em)]](https://www.rsc.org/images/entities/char_2009.gif) δ.c The temperature of weight loss at 5 wt% determined by TGA.d Determined by TGA at 900 °C. δ.c The temperature of weight loss at 5 wt% determined by TGA.d Determined by TGA at 900 °C. |
|||||
| Pure PI | — | 2.20 | 356 | 572 | 59.5 |
| GF/PI | 1.0 | 1.55 | 348 | 588 | 59.6 |
| GFO/PI | 1.0 | 1.81 | 361 | 574 | 57.5 |
| GFO-ODA/PI | 0.5 | 1.99 | 359 | 582 | 58.1 |
| GFO-ODA/PI | 1.0 | 2.21 | 366 | 582 | 58.0 |
| GFO-ODA/PI | 2.0 | 2.86 | 360 | 572 | 57.5 |
For GFO-ODA/PI films at temperatures below Tg, the value of E′ increases when the loading increases from 0.5 wt% to 2.0 wt%. The Tg of these films, however, does not monotonously shift to the higher temperature with the increase of GFO-ODA loading. The maximum value occurs at the content of 1.0 wt%. Combined with the analysis of dielectric properties, one can conclude that there are two opposite influences of the incorporation of GFO-ODA nanosheet on PI matrix. One is to loosen the stacking of PI chains, and the other is to restrict the motion of PI chains. Hence, in the case of 0.5 wt% loading, Tg is almost the same as that of pure PI film. When the loading increases to 2.0 wt%, the aggregation of the excess GFO-ODA nanosheets may be mainly responsible for the reduction of Tg, which is in an agreement with the above testing results.
3.6. Thermal stability
Thermal stability is one of the important properties of PI films since they are often used as dielectrics in microelectronics where the annealing step at the temperature up to 400 °C is often necessary.2 TGA results of the pure PI film and the PI composite films are listed in Table 3. The thermal stability of PI films can usually be improved by the incorporation of inorganic fillers. The temperature at 5 wt% weight loss (T5d) changes from 572 °C for pure PI film to 582 °C for 1.0 wt% GFO-ODA/PI. If uniformly dispersed, modified graphene can improve the thermal properties of PI by blocking heat transfer and decreasing volatilization of degradation products. However, at 2.0 wt% loading, modified graphene is poorly dispersed and aggregates, and hence it cannot improve the thermal stability. Moreover, introduction of GFO-ODA into the system makes the amino groups more than anhydride groups, which affects the molecular weight of PI. For GFO/PI and GFO-ODA/PI films, their thermal stability does not become worse than that of the pure PI film. Thus the incorporation of GFO-ODA into PI matrix is a facile method to fabricate high performance PI nanocomposite films.4. Conclusions
In this study, we proposed an effective approach to fabricate the novel fluorine-containing PI nanocomposite films with low dielectric constant. The obtained GFO-ODA nanosheets, as a reactive platform for covalently bonding with PI chains, provided large contact area and strong interfacial interactions with PI matrix. The dielectric constant of the GFO-ODA/PI films showed a non-monotonic change while the loading increased. The minimum value of 2.75 (at 106 Hz) was achieved at 1.0 wt% loading. Furthermore, the GFO-ODA/PI films maintained the excellent mechanical and thermal properties. Young's modulus of the GFO-ODA/PI film with 1.0 wt% loading was 50% greater than that of the pure PI film. Besides, the incorporation of GFO-ODA did not decrease Tg and decomposition temperature of the pure PI film. GFO-ODA/PI film is a potential material with low dielectric constant for a wide range of applications.Acknowledgements
This research is supported by the National Natural Science Foundation of China (No. 51173047, 51573054) and the Project for Science and Technology of Guangdong Province (2014B090916001).Notes and references
- D. J. Liaw, K. L. Wang, Y. C. Huang, K. R. Lee, J. Y. Lai and C. S. Ha, Prog. Polym. Sci., 2012, 37, 907–974 CrossRef CAS.
- G. Maier, Prog. Polym. Sci., 2001, 26, 3–65 CrossRef CAS.
- W. Volksen, R. D. Miller and G. Dubois, Chem. Rev., 2009, 110, 56–110 CrossRef PubMed.
- M. Hasegawa and K. Horie, Prog. Polym. Sci., 2001, 26, 259–335 CrossRef CAS.
- L. Tao, H. Yang, J. Liu, L. Fan and S. Yang, Polymer, 2009, 50, 6009–6018 CrossRef CAS.
- W. Jang, D. Shin, S. Choi, S. Park and H. Han, Polymer, 2007, 48, 2130–2143 CrossRef CAS.
- M. G. Dhara and S. Banerjee, Prog. Polym. Sci., 2010, 35, 1022–1077 CrossRef CAS.
- K. S. Novoselov, A. K. Geim, S. V. Morozov, D. Jiang, Y. Zhang, S. V. Dubonos, I. V. Grigorieva and A. A. Firsov, Science, 2004, 306, 666–669 CrossRef CAS PubMed.
- C. Lee, X. Wei, J. W. Kysar and J. Hone, Science, 2008, 321, 385–388 CrossRef CAS PubMed.
- A. A. Balandin, S. Ghosh, W. Bao, I. Calizo, D. Teweldebrhan, F. Miao and C. N. Lau, Nano Lett., 2008, 8, 902–907 CrossRef CAS PubMed.
- M. Orlita, C. Faugeras, P. Plochocka, P. Neugebauer, G. Martinez, D. K. Maude, A.-L. Barra, M. Sprinkle, C. Berger, W. A. de Heer and M. Potemski, Phys. Rev. Lett., 2008, 101, 267601 CrossRef CAS PubMed.
- J. S. Bunch, S. S. Verbridge, J. S. Alden, A. M. van der Zande, J. M. Parpia, H. G. Craighead and P. L. McEuen, Nano Lett., 2008, 8, 2458–2462 CrossRef CAS PubMed.
- R. Sengupta, M. Bhattacharya, S. Bandyopadhyay and A. K. Bhowmick, Prog. Polym. Sci., 2011, 36, 638–670 CrossRef CAS.
- H. Kim, A. A. Abdala and C. W. Macosko, Macromolecules, 2010, 43, 6515–6530 CrossRef CAS.
- D. Cai and M. Song, J. Mater. Chem., 2010, 20, 7906–7915 RSC.
- D. R. Dreyer, S. Park, C. W. Bielawski and R. S. Ruoff, Chem. Soc. Rev., 2010, 39, 228–240 RSC.
- S. Stankovich, D. A. Dikin, R. D. Piner, K. A. Kohlhaas, A. Kleinhammes, Y. Jia, Y. Wu, S. T. Nguyen and R. S. Ruoff, Carbon, 2007, 45, 1558–1565 CrossRef CAS.
- J. Kim, L. J. Cote and J. Huang, Acc. Chem. Res., 2012, 45, 1356–1364 CrossRef CAS PubMed.
- J. I. Paredes, S. Villar-Rodil, A. Martínez-Alonso and J. M. D. Tascón, Langmuir, 2008, 24, 10560–10564 CrossRef CAS PubMed.
- M. J. McAllister, J. L. Li, D. H. Adamson, H. C. Schniepp, A. A. Abdala, J. Liu, M. Herrera-Alonso, D. L. Milius, R. Car, R. K. Prud’homme and I. A. Aksay, Chem. Mater., 2007, 19, 4396–4404 CrossRef CAS.
- R. R. Nair, W. Ren, R. Jalil, I. Riaz, V. G. Kravets, L. Britnell, P. Blake, F. Schedin, A. S. Mayorov, S. Yuan, M. I. Katsnelson, H. M. Cheng, W. Strupinski, L. G. Bulusheva, A. V. Okotrub, I. V. Grigorieva, A. N. Grigorenko, K. S. Novoselov and A. K. Geim, Small, 2010, 6, 2877–2884 CrossRef CAS PubMed.
- J. T. Robinson, J. S. Burgess, C. E. Junkermeier, S. C. Badescu, T. L. Reinecke, F. K. Perkins, M. K. Zalalutdniov, J. W. Baldwin, J. C. Culbertson, P. E. Sheehan and E. S. Snow, Nano Lett., 2010, 10, 3001–3005 CrossRef CAS PubMed.
- K. J. Jeon, Z. Lee, E. Pollak, L. Moreschini, A. Bostwick, C. M. Park, R. Mendelsberg, V. Radmilovic, R. Kostecki, T. J. Richardson and E. Rotenberg, ACS Nano, 2011, 5, 1042–1046 CrossRef CAS PubMed.
- C. Sun, Y. Feng, Y. Li, C. Qin, Q. Zhang and W. Feng, Nanoscale, 2014, 6, 2634–2641 RSC.
- A. Tuteja, W. Choi, M. Ma, J. M. Mabry, S. A. Mazzella, G. C. Rutledge, G. H. McKinley and R. E. Cohen, Science, 2007, 318, 1618–1622 CrossRef CAS PubMed.
- W. Huang, Q. X. Pei, Z. Liu and Y. W. Zhang, Chem. Phys. Lett., 2012, 552, 97–101 CrossRef CAS.
- Z. Wang, J. Wang, Z. Li, P. W. Gong, J. F. Ren, H. G. Wang, X. X. Han and S. R. Yang, RSC Adv., 2012, 2, 11681–11686 RSC.
- K. I. Ho, C. H. Huang, J. H. Liao, W. Zhang, L. J. Li, C. S. Lai and C. Y. Su, Sci. Rep., 2014, 4, 5893 CAS.
- A. B. Bourlinos, A. Bakandritsos, N. Liaros, S. Couris, K. Safarova, M. Otyepka and R. Zbořil, Chem. Phys. Lett., 2012, 543, 101–105 CrossRef CAS.
- A. Mathkar, T. N. Narayanan, L. B. Alemany, P. Cox, P. Nguyen, G. H. Gao, P. Chang, R. Romero-Aburto, S. A. Mani and P. M. Ajayan, Part. Part. Syst. Charact., 2013, 30, 266–272 CrossRef CAS.
- D. Damien, P. M. Sudeep, T. N. Narayanan, M. R. Anantharaman, P. M. Ajayan and M. M. Shaijumon, RSC Adv., 2013, 3, 25702–25706 RSC.
- R. Romero-Aburto, T. N. Narayanan, Y. Nagaoka, T. Hasumura, T. M. Mitcham, T. Fukuda, P. J. Cox, R. R. Bouchard, T. Maekawa, D. S. Kumar, S. V. Torti, S. A. Mani and P. M. Ajayan, Adv. Mater., 2013, 25, 5632–5637 CrossRef CAS PubMed.
- S. J. Yan, J. Q. Zhao, Y. C. Yuan, S. M. Liu, Z. X. Huang, Z. G. Chen, D. Jiang and W. X. Zhao, RSC Adv., 2013, 3, 21869–21876 RSC.
- W. S. Hummers Jr and R. E. Offeman, J. Am. Chem. Soc., 1958, 80, 1339 CrossRef.
- X. Wang, Y. Dai, J. Gao, J. Huang, B. Li, C. Fan, J. Yang and X. Liu, ACS Appl. Mater. Interfaces, 2013, 5, 8294–8299 CAS.
- Y. S. Lee, T. H. Cho, B. K. Lee, J. S. Rho, K. H. An and Y. H. Lee, J. Fluorine Chem., 2003, 120, 99–104 CrossRef CAS.
- M. Dubois, J. Giraudet, K. Guérin, A. Hamwi, Z. Fawal, P. Pirotte and F. Masin, J. Phys. Chem. B, 2006, 110, 11800–11808 CrossRef CAS PubMed.
- V. Gupta, T. Nakajima and B. Žemva, J. Fluorine Chem., 2001, 110, 145–151 CrossRef CAS.
- S. S. Han, T. H. Yu, B. V. Merinov, A. C. T. van Duin, R. Yazami and W. A. Goddard III, Chem. Mater., 2010, 22, 2142–2154 CrossRef CAS.
- D. C. Marcano, D. V. Kosynkin, J. M. Berlin, A. Sinitskii, Z. Sun, A. Slesarev, L. B. Alemany, W. Lu and J. M. Tour, ACS Nano, 2010, 4, 4806–4814 CrossRef CAS PubMed.
- X. Zhang, Y. Feng, D. Huang, Y. Li and W. Feng, Carbon, 2010, 48, 3236–3241 CrossRef CAS.
- J. Dong, C. Yin, X. Zhao, Y. Z. Li and Q. H. Zhang, Polymer, 2013, 54, 6415–6424 CrossRef CAS.
- Y. Liu, R. L. Vander Wal and V. N. Khabashesku, Chem. Mater., 2007, 19, 778–786 CrossRef CAS.
- R. Zbořil, F. Karlický, A. B. Bourlinos, T. A. Steriotis, A. K. Stubos, V. Georgakilas, K. Šafářová, D. Jančík, C. Trapalis and M. Otyepka, Small, 2010, 6, 2885–2891 CrossRef PubMed.
- Z. Xu and C. Gao, Macromolecules, 2010, 43, 6716–6723 CrossRef CAS.
- B. Zhang, Y. Chen, X. Zhuang, G. Liu, B. Yu, E.-T. Kang, J. Zhu and Y. Li, J. Polym. Sci., Part A: Polym. Chem., 2010, 48, 2642–2649 CrossRef CAS.
- J. F. Shen, Y. Z. Hu, M. Shi, X. Lu, C. Qin, C. Li and M. X. Ye, Chem. Mater., 2009, 21, 3514–3520 CrossRef CAS.
- Z. M. Dang, L. J. Ma, J. W. Zha, S. H. Yao, D. Xie, Q. Chen and X. Duan, J. Appl. Phys., 2009, 105, 44104 CrossRef.
- K. G. Gatos, J. G. M. Alcázar, G. C. Psarras, R. Thomann and J. Karger-Kocsis, Compos. Sci. Technol., 2007, 67, 157–167 CrossRef CAS.
- G. M. Tsangaris, G. C. Psarras and N. Kouloumbi, J. Mater. Sci., 1998, 33, 2027–2037 CrossRef CAS.
- G. C. Psarras, K. G. Gatos, P. K. Karahaliou, S. N. Georga, C. A. Krontiras and J. Karger-Kocsis, eXPRESS Polym. Lett., 2007, 1, 837–845 CrossRef CAS.
| This journal is © The Royal Society of Chemistry 2017 |


