 Open Access Article
Creative Commons Attribution 3.0 Unported Licence
Novel iron doped calcium oxalates as promising heterogeneous catalysts for one-pot multi-component synthesis of pyranopyrazoles†
Kranthi Kumar Gangu,
Suresh Maddila,
Surya Narayana Maddila and
Sreekantha B. Jonnalagadda *
*
School of Chemistry & Physics, University of KwaZulu-Natal, Westville Campus, Chiltern Hills, Durban-4000, South Africa. E-mail: jonnalagaddas@ukzn.ac.za; Fax: +27 31 2603091; Tel: +27 31 2607325
First published on 3rd January 2017
Abstract
The co-precipitation method using a surface modifier, glutamic acid was employed in the design of iron doped calcium oxalates (Fe-CaOx). Fe-CaOx with diverse iron loading (0.5–3.0 mmol) were prepared and their phase purity and surface features were examined by X-ray powder diffraction (XRD), Fourier transform infrared (FT-IR), electron microscopy (SEM, TEM), energy dispersive X-ray (EDX), Inductively Coupled Plasma-Optical Emission Spectroscopy (ICP-OES), N2-sorption, thermal and fluorescent analysis. The Fe-CaOx materials proved excellent as catalysts in the one-pot syntheses of eight 2,4-dihydro pyrano[2,3-c]pyrazole derivatives via four component condensation of aromatic aldehydes, malononitrile, hydrazine hydrate and dimethyl acetylenedicarboxylate in ethanol with impressive yields (92–98%) in short reaction times (<20 min). The 2.0 mmol loaded iron in Fe-CaOx showed the finest catalytic performance with 98% yield in 10 min compared to other loadings. The stability, ease of separation, and reusability for up to six cycles of Fe-CaOx make it an environmentally friendly and cost-effective viable choice for the value-added organic transformations.
1 Introduction
A large number of publications in the field of catalysis endorse that a wide range of heterogeneous materials meet several green chemistry criteria as catalysts.1–3 Many such eco-friendly and sustainable catalysts are valuable in making various efficacious value-added organic transformations feasible.4,5 Calcium oxalate, Ca(C2O4) is a natural and widely available common organic mineral in carbonate concretions, and in sediments of lake and marine, lignite and hydrothermal veins.6–9 The bio-minerals of calcium oxalates are abundantly found in vegetation as their crystals are a prime cause for urolithiasis.10 Calcium oxalates (CaOx) exist mainly in three forms (mono, di and tri-hydrate) and the calcium oxalate monohydrate (COM), CaC2O4·H2O is the prominent entity relative to the other two forms, calcium oxalate di-hydrate (COD), CaC2O4·2H2O and tri-hydrate (COT), CaC2O4·3H2O.11–13 The monoclinic crystal system of COM is thermodynamically most stable phase compared to COD (tetragonal, metastable) and COT (triclinic, unstable).14 The unique properties of COM such as extremely low water solubility and high thermal stability grab the attention of researchers. Verganelaki et al., have prepared a nanocomposites by mixing the amorphous silica and calcium oxalate nanoparticles for strengthening of building materials.15 Due to enhanced physico-chemical affinities and compatibility with natural stone and the crack free nature, such nanocomposites are widely used in the improvement of physical characteristics of constructing materials, i.e. tensile strength and hygric properties. The thermal stability, surface area, mechanical strength and tunable textural properties of CaOx prompt their utility as catalyst support material for many catalytically active metal centres.The ability to hold the adsorbed substances firmly and thereby activate the reactants is the advantageous characteristic of transition metals.16,17 The incorporation of transition metals into the solid support lattices is common practice to enhance their activity and to improve cost-effectiveness. Relative to other expensive choices, iron is the most possible candidate for doping due to its low cost, abundance, non-toxic and environmentally benign nature.18 The partial loading of iron in the place of Ca2+ in CaOx can give rise to material with improved activity. Besides the chemical composition, the physical features attained by the catalysts such as morphology, size etc. are known to play a key role in their activity.19–21 The controlled morphology and growth of crystals with ideal physical features is prime initiative to augment the catalytic activity. Literature survey reveals that many biological proteins, amino acids, surfactants, polymeric compounds have shown significant influence on crystal growth and morphology of several materials of interest under diverse synthetic conditions.22–25
Multi-component reaction (MCR), where all reactants (more than two) placed in one vessel and make the reaction conditions viable for developing bonds between the reactants to give a single product is an eco-compatible synthetic technique and which is replacing many traditional tardy processes. The MCR is a worthwhile approach for the preparation of varied organic scaffolds with introduction of diverse precursor elements.26–28 Heterocyclic systems are prevalent in nature and possess unique characteristics to design varied physiological and pharmacologically active substrates.29 Heterocyclic compounds are integral parts of the medicinal chemistry and have played a pragmatic role as precursor materials in the synthesis of drugs possessing antimalarial, antiulcer, diuretic, anthelmintic, antidepressants, anticancer, antineoplastic and antipsychotic activities.30–33 The wide range of physico-chemical and biological properties instilled in the heterocyclic compounds open new vistas in the scheming of novel pharmaceutical materials with impressive bioactivities. Among heterocycles, pyrazoles in general and pyranopyrazoles in particular possess salient pharmaceutical and biological characteristics with wide adoption in the field of medicinal chemistry, which necessitates competent procedures for their syntheses.34–38 Literature shows that Zonouz et al. have prepared the pyrano[2,3-c]pyrazole derivatives with different substituted aldehydes under reflux at 60 °C with 64–78% yields and reaction time of 2.5 h.39 Zou et al. have synthesized pyrano[2,3-c]pyrazoles moieties using ethyl acetoacetate in the place of dimethyl acetylenedicarboxylate reactant and reported products with 72–85% of yield in 2.5–5.0 h reaction time at 50 °C.40 Tamaddon and Alizadeh reported the synthesis of dihydropyrano[2,3-c]pyrazoles compounds, with combination of aryl aldehyde, malononitrile, ethyl acetoacetate and hydrazine hydrate in water at 50–60 °C by using cocamidopropyl betaine (CAPB), a zwitterionic biodegradable surfactant as catalyst with yields of 88–96%.41 Soleimani et al. have synthesized different pyranopyrazole derivatives at 70 °C by using nanostructured Fe3O4@SiO2 as catalyst with 83–94% yield in 20–40 min reaction time.42 In earlier work, we have reported the efficacy use of some heterogeneous catalysts and their activity in selective synthesis of heterocyclic compounds with excellent yields.43–46
In the present study, a series of novel Fe-CaOx materials were prepared by co-precipitation method using glutamic acid as crystal growth modifier. The efficacies of the materials as heterogeneous catalyst for the synthesis of pyranopyrazole moieties through four-component one-pot reaction were investigated. The effect of varied Fe doping, morphological and textural features on their activity was probed.
2 Experimental
2.1 Materials preparation
All required chemicals were acquired and used without any further purification. Calcium chloride (CaCl2), disodium oxalate (Na2C2O4) and iron nitrate nonahydrate (Fe(NO3)3·9H2O) were purchased from Sigma Aldrich. Glutamic acid was from Fluka chemicals. All aromatic aldehydes, malononitrile, hydrazine hydrate and dimethyl acetylenedicarboxylate were purchased from Sigma Aldrich. Millipore-Q purified water was used throughout the experiment.Fe-CaOx with four doping levels of iron was prepared by co-precipitation method. Initially, the stock solutions of precursors of 0.5 M of CaCl2, 0.2 M of Na2C2O4 and 0.5 M of Fe(NO3)3·9H2O were prepared. In a typical preparation, 5.0 mmol (10 mL of 0.5 M) of CaCl2 and 2.0 mmol (0.330 g) of glutamic acid were mixed with 50.0 mL water with continuous stirring. To that solution, 5.0 mmol (25 mL of 0.2 M) of Na2C2O4 was added slowly from burette and the resultant mixture was further stirred for 30 min. A solution containing requisite amount of iron precursor was added drop by drop to the mixture and stirring was continued for another 3 h. The reaction mixture was left overnight (12 h) to facilitate the crystallisation and the resultant crystalline material was harvested by centrifugation followed by several washings with millipore water. Repeating the exercise, total four materials namely, 0.5 mmol Fe-CaOx/glu (0.5 Fe-CaOx/glu), 1.0 mmol Fe-CaOx/glu (1.0 Fe-CaOx/glu), 2.0 mmol Fe-CaOx/glu (2.0 Fe-CaOx/glu) and 3.0 mmol Fe-CaOx/glu (3.0 Fe-CaOx/glu) were synthesised. The collected samples were calcined at 350 °C over 3 h under air flow. For comparison, un-doped CaOx in presence and absence of glutamic acid (glu) was prepared following the same procedure and designated as CaOx/glu and CaOx, respectively. The calculated chemical compositions of the samples and obtained yields are summarised in Table 1. The materials were further analysed to confirm their characteristics.
| Sample | CaCl2 (mmol) | Na2C2O4 (mmol) | Fe(NO3)3·9H2O | Glutamic acid (mmol) | Yield (%) |
|---|---|---|---|---|---|
| CaOx | 5.0 | 5.0 | — | — | 79 |
| CaOx/glu | 5.0 | 5.0 | — | 2.0 | 85 |
| 0.5 Fe-CaOx/glu | 5.0 | 5.0 | 0.5 mmol (1.0 mL of 0.5 M iron sol.) | 2.0 | 84 |
| 1.0 Fe-CaOx/glu | 5.0 | 5.0 | 1.0 mmol (2.0 mL of 0.5 M iron sol.) | 2.0 | 87 |
| 2.0 Fe-CaOx/glu | 5.0 | 5.0 | 2.0 mmol (4.0 mL of 0.5 M iron sol.) | 2.0 | 94 |
| 3.0 Fe-CaOx/glu | 5.0 | 5.0 | 3.0 mmol (6.0 mL of 0.5 M iron sol.) | 2.0 | 92 |
2.2 Characterization
For phase identifications, the X-ray diffraction analysis was conducted using a Bruker D8 advance diffractometer with Ni filtered Cu Kα radiation (V = 45 kV, I = 40 mA). The XRD pattern was collected in a 2θ range of 20 to 70° with scan rate of 4° min−1 and a step size of 0.02°. FT-IR analysis was conducted on Perkin Elmer (Spectrum 100, USA) over a range of 4000 to 400 cm−1 at resolution of 4 cm−1 for investigating the vibrational modes existing in the materials. Microscopic analysis such as FESEM (Zeiss Ultra Plus, Germany) operating at 5–20 kV and HRTEM (JEOL 1010, Japan) with accelerating voltage of 100 kV was conducted to know the morphological changes and crystal size identification. All samples were coated with an Au film to get a good resolution for FESEM. The identification and confirmation of elements including iron was done by elemental analysis through EDX (AZtec software, Oxford instruments, UK) unit attached to FESEM and ICP-OES (Optima 5300 DV, USA). For textural characteristics such as surface area and pore properties, N2 adsorption/desorption analysis was conducted at 77 K using Micromeritics Tristar-3020, USA. For N2 sorption studies, all samples were degassed overnight at 150 °C to eliminate the unwanted gases on the surfaces of samples. The mass loss with respect to temperature and thermal stability of materials were identified with the TG analysis using SDT Q600 instrument at heating rate of 10 °C min−1 under nitrogen gas flow. Fluorescence spectra of samples were obtained by Perkin Elmer LS-55 fluorescence spectrophotometer at room temperature. 1H-NMR, 15N, 13C spectra of organic products were obtained using Bruker advance 400 spectrometer at ambient temperature conditions.3 Results and discussion
3.1 X-ray diffraction and FT-IR analysis
For the phase identification, crystallinity and crystallite size, the X-ray diffraction studies were conducted. The Fig. 1 shows the XRD patterns of samples and the X-ray analysis confirmed the formation of COM phase. The powder diffraction database was used for the phase identification, which revealed that the XRD patterns of all samples well matched with the COM phase (PDF 20-0231).47 The identified peaks projected at d = 5.83, 3.60, 2.94, 2.47, 2.33, 2.25, and 2.06 Å corresponding to COM crystal, were assigned to (−101), (020), (−202), (112), (130), (202), (321) lattice planes, respectively. The doping of iron into the COM lattice did not create any new phase, confirming that iron occupied the interstitial position of COM crystals (Fig. 1c–f). The observed variation in the peak intensities, which impact on the crystallinity of the samples, can be attributed to the effect of glutamic acid used and percentage of Fe doped.48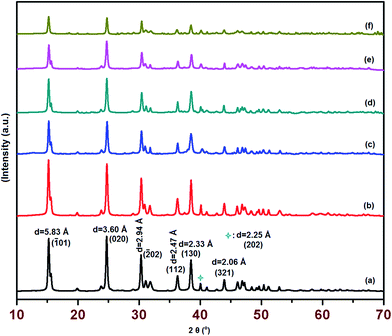 | ||
| Fig. 1 XRD patterns (a) CaOx (b) CaOx/glu (c) 0.5 Fe-CaOx/glu (d) 1.0 Fe-CaOx/glu (e) 2.0 Fe-CaOx/glu (f) 3.0 Fe-CaOx/glu. | ||
The crystallinity was tested using X'Pert High score plus software after successive profile fit treatments, which indicates that the degree of crystallinity of the material decreases with increase in doping of Fe in CaOx. The control sample without the glutamic acid (Fig. 1a) recorded high degree of crystallinity (62 ± 4.2%), but when glutamic acid used (Fig. 1b), the crystallinity dropped to 51 ± 3.5% and the trend continued with increased Fe in the samples (Fig. 1c–f). The results show that introduction of glutamic acid as crystal growth modifier has worked well towards the control of nucleation. The crystallite size was determined by the Scherrer's formula using (020) reflection as reference and the resultant calculations showed that the crystallite size reduced in presence of glu to 32–38 ± 4 nm, relative to the control sample (CaOx) with crystallite size of 52 ± 2.6 nm. The XRD studies also reveal that the glutamic acid concentration inhibits crystal growth and influence morphological features, but not altering the thermodynamically stable COM phase.
FT-IR spectroscopic method was used to analyse the vibrational frequencies of COM phases. The presence of hydroxyl group, metal to oxygen bond and carboxylic group absorption bands confirm the COM phase formation (Fig. 2). Absence of any glutamic acid related peaks reveal that glu was involved in the crystal growth inhibition, and does not bind to the surfaces of COM crystals. The FT-IR spectra also reveal that added glutamic acid is suited to retain the more stable COM phase with crystal growth inhibition, but hampering the formation of less stable COD and COT phases.
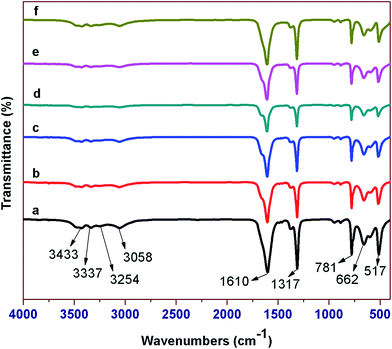 | ||
| Fig. 2 XRD patterns (a) CaOx (b) CaOx/glu (c) 0.5 Fe-CaOx/glu (d) 1.0 Fe-CaOx/glu (e) 2.0 Fe-CaOx/glu (f) 3.0 Fe-CaOx/glu. | ||
The hydroxyl absorption bands appeared at 3337 and 3433 cm−1 respectively correspond to symmetric and asymmetric O–H stretching vibrations, whereas 3254 and 3058 cm−1 correspond to stretching vibrations of O–H–O. The peaks at 1610 (asymmetric) and 1317 cm−1 (symmetric) stretching vibrations are from the carboxylic group. The peaks at 662 and 517 cm−1 are related to the bending (rocking) vibrational frequencies of the same group. The absorption peak at 781 cm−1 represents the existence of metal to oxygen bond.49,50
3.2 Surface morphology and particle size analysis by FESEM and HRTEM
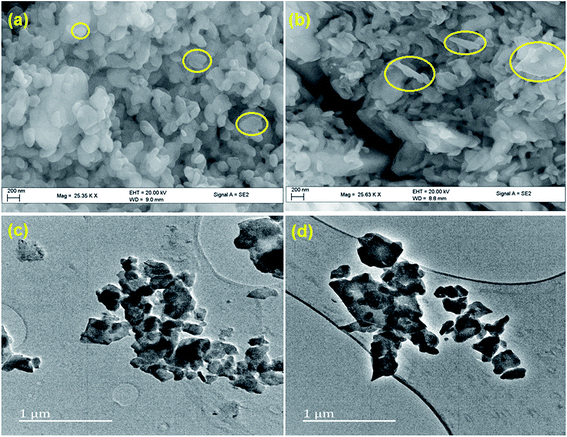
The microscopic analysis gives an insight into the morphological changes, shape and size of COM particles taken place due to crystal growth modifier, glutamic acid in the synthesis. In the absence of glutamic acid, in control experiments, COM was in spherical shape with aggregated particles in the range between 250–400 nm (Fig. 3a and c). In presence of glutamic acid, generated regular shaped particles and COM particles were needle shaped and spread uniformly over the surface. Some hexagonal shaped particles were also observed (Fig. 3b), which were due to the elongation of spherical shaped particles in CaOx sample. The surface capping ability of glutamic acid promotes the structural modification and reduction in the particle size. A perusal of the TEM micrograph of CaOx/glu (Fig. 3d) shows that in presence of glu, particle size decreased to 180–210 nm.The materials with different concentrations of Fe, from 0.5 Fe-CaOx/glu to 3.0 Fe-CaOx/glu, (Fig. 4) exhibited identical morphology with no significant changes, but particles showed some differences in their shape. The TEM micrograph of 0.5 Fe-CaOx/glu (Fig. 5a) shows particles with needle-like ends, which changed to irregular sharped ends with 1.0 Fe-CaOx/glu (Fig. 5b). While the 2.0 Fe-CaOx/glu (Fig. 5c) exhibited hexagonal shaped particles with semi ellipsoid shapes and particle size 108–238 nm, the 3.0 Fe-CaOx/glu (Fig. 5d) showed an over dispersion of iron particles with their hexagonal shapes deteriorated and particle size remaining unaltered. With increase in iron content, the distortions in the shape of COM particles were noticed. The elemental analysis conducted using EDX and ICP-OES confirmed the presence of iron and its anticipated increment in wt% from sample 0.5 to 3.0 Fe-CaOx, authenticate the synthetic procedure employed (Fig. 5).
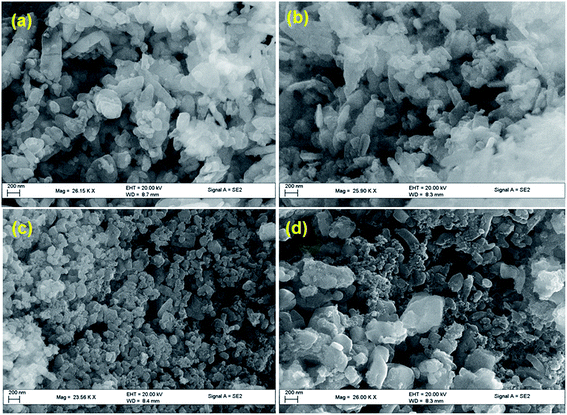 | ||
| Fig. 4 SEM micrographs of (a) 0.5 Fe-CaOx/glu (b) 1.0 Fe-CaOx/glu (c) 2.0 Fe-CaOx/glu (d) 3.0 Fe-CaOx/glu. | ||
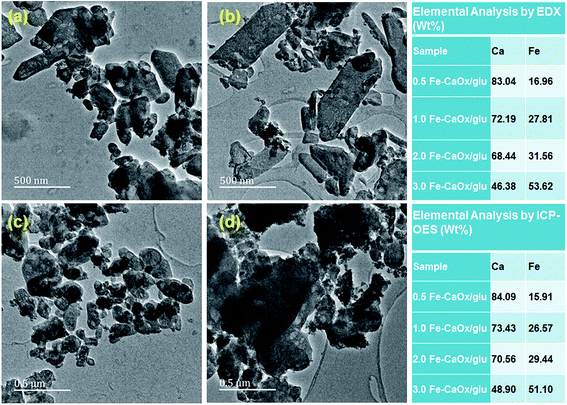 | ||
| Fig. 5 TEM micrographs of (a) 0.5 Fe-CaOx/glu (b) 1.0 Fe-CaOx/glu (c) 2.0 Fe-CaOx/glu (d) 3.0 Fe-CaOx/glu; elemental analysis by EDX and ICP-OES. | ||
3.3 The effect of doped iron on CaOx substrate: thermogravimetric, textural characteristics and fluorescent emission analysis
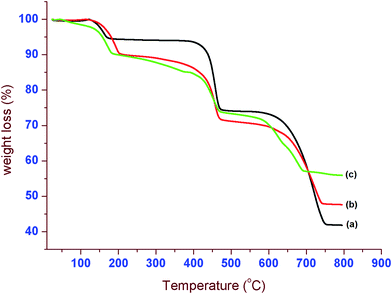
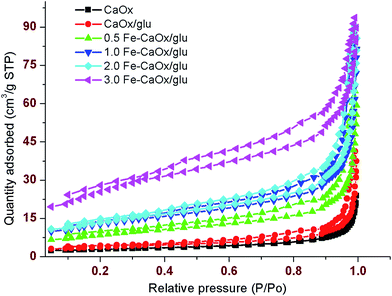
The effective doping of iron into the lattices of CaOx induces the diverse variations in their properties. In order to examine the thermal stability of the samples, the TG analysis was conducted. The TGA curves of CaOx/glu, 1.0 Fe-CaOx/glu and 3.0 Fe-CaOx/glu indicate that the weight loss occurred in three steps and % weight loss is lower for the higher Fe-doped sample (Fig. 6). In all three samples, the first decomposition step starts at 110 °C and ended about 180–230 °C with wt loss of 5.0% for CaOx/glu and 12.5% each for 1.0 Fe-CaOx/glu and 3.0 Fe-CaOx/glu, which represents the dehydration of samples. The an-hydrated samples decomposed to CaCO3 with evolution of CO in the second step at around 450–500 °C (wt loss of 20.5% in all cases). In the third step, the further decomposition of CaCO3 to CaO by loss of CO2 occurred between 650–800 °C with wt loss of 30.0% for CaOx/glu, 25.0% for 1.0 Fe-CaOx/glu and 18.0% for 3.0 Fe-CaOx/glu. The lower weight loss in the third step recorded with increase in Fe loading suggests that the higher concentration of doped-iron replaces, the calcium ions and thereby the quantity of decomposed CaO is reduced. The TG analysis reveals the COM phase formation51 as well as successful doping of iron into the lattices of COM crystals and their good thermal stability.The textural properties of the materials were measured with N2 adsorption isotherm at 77 K. The observed isotherms are related to the type IV and the amount of probe N2 gas adsorbed varied with samples (Fig. 7). The BET-specific surface area was measured and the value increased from control to highest dopant loaded sample (Table 2). The CaOx (control) recorded low BET-surface of 9.93 m2 g−1, whereas high iron containing 3.0 Fe-CaOx/glu possessed high BET-surface area (93.22 m2 g−1). The pore volume also increased in the same trend as BET-surface area. As the dopant concentration increased, the number of additional adsorptive sites increase and thereby the surface area also improve. Pore size is in mesoporous range with high value for CaOx/glu sample and low for the 3.0 Fe-CaOx. The increased surface area and pore volume with dopant concentration divulges that the dopant replaces the calcium ions in its crystal lattice, but creates more pores of lesser size without blocking the existing pores.
| Sample | BET-surface area (m2 g−1) | Pore volume (cm3 g−1) | Pore size (nm) | Average crystallite size (nm) from XRD |
|---|---|---|---|---|
| CaOx | 9.9 ± 1.2 | 0.03 ± 0.005 | 17.5 ± 1.14 | 52 ± 2.6 |
| CaOx/glu | 13.5 ± 0.9 | 0.05 ± 0.003 | 19.3 ± 1.01 | 32 ± 3.1 |
| 0.5 Fe-CaOx/glu | 31.3 ± 1.8 | 0.09 ± 0.002 | 13.5 ± 1.94 | 36 ± 5.3 |
| 1.0 Fe-CaOx/glu | 46.3 ± 3.3 | 0.12 ± 0.003 | 12.3 ± 2.01 | 34 ± 2.8 |
| 2.0 Fe-CaOx/glu | 49.2 ± 2.0 | 0.13 ± 0.002 | 12.7 ± 1.05 | 33 ± 3.3 |
| 3.0 Fe-CaOx/glu | 93.2 ± 2.1 | 0.14 ± 0.001 | 6.9 ± 1.98 | 38 ± 4.2 |
Fig. 8 shows the fluorescent spectra of CaOx crystals with different iron doping. When samples were excited at 250 nm, the emission maximum was exhibited at 756 nm. The emission intensity diminished with increase in doping of iron. The decrease in fluorescence intensity is reveals that the Fe is substituted in some of the places of Ca2+ ions in crystal structure and this confirms the entry of iron into the lattice of CaOx. Relative to the un-doped CaOx, the doped iron decreases the fluorescence efficiency of the sample through ion–ion interactions and energy transfer processes. The doped iron in the crystal structure quenches the fluorescence intensity of CaOx crystals by weakening of the interactions between Ca2+ and oxalate ions.
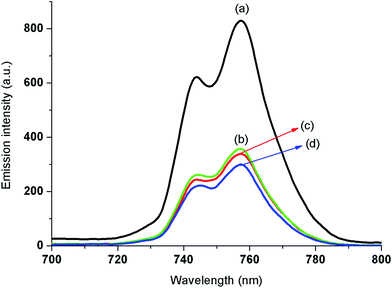 | ||
| Fig. 8 Fluorescent spectra of (a) un-doped CaOx (b) 1.0 Fe-CaOx/glu (c) 2.0 Fe-CaOx/glu (d) 3.0 Fe-CaOx/glu. | ||
3.4 Catalytic activity of Fe-CaOx
After characterization of the materials, their potential as heterogeneous catalysts was tested in the synthesis of pyrano[2,3-c]pyrazole derivatives via one-pot four component condensation reaction. To evaluate the catalytic efficiencies of Fe-CaOx, with varied doping of iron, the typical reaction (Scheme 1) involved equimolar ratios of 3-fluoro benzaldehyde (1.0 mmol), malononitrile (1.0 mmol), hydrazine hydrate (1.0 mmol) and dimethyl acetylene dicarboxylate (1.0 mmol) in ethanol and chosen catalyst. The four reactants and 20 mg of the catalyst were allowed to reflux at 50 °C in ethanol. After confirming the completion of reaction with TLC examination, the reaction mixture was filtered with suction pump and ensured the separation of catalyst for the recycling purposes. The organic product from the filtrate was extracted with ethyl acetate and recovered after removal of solvent under vacuum. The product was washed several times with ethanol to afford pure product. The structure of organic product was confirmed by the analysis of using varied spectral data including 1H, 15N, and 13C-NMR (Fig. S2–S4†). The 1H signals observed at δ 3.64, 7.09 and 13.81 ppm respectively indicated the presence of methoxy (–OCH3), amino (–NH2) and secondary amine (–NH) protons and presence of amino group further is confirmed by 15N spectrum.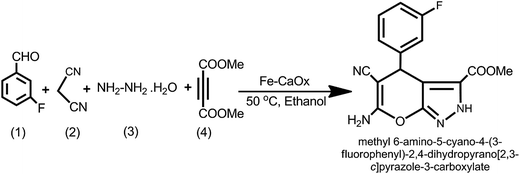 | ||
| Scheme 1 Typical reaction ((1) 3-fluoro benzaldehyde, (2) malanonitrile, (3) hydrazine hydrate, (4) dimethyl acetylenedicarboxylate). | ||
To establish the need of catalyst, the un-catalysed title reaction was conducted under similar reaction conditions. The reaction took 2.5 h to produce the final product with 60% yield. Initially, when NaOH, Na2CO3, pyridine, AcOH, or Al2O3 were employed as catalysts, no significant improvement was found either in the reaction time or yield (Table 3, entries 2–5). The addition of CaOx/glu reduced the reaction time, but produced the low yields (Table 3, entry 6). Thereafter, the reaction was examined with different Fe-CaOx/glu samples (0.5 Fe-CaOx/glu, 1.0 Fe-CaOx/glu, 2.0 Fe-CaOx/glu, 3.0 Fe-CaOx/glu) to compare their efficacy in getting better yields of pyrano[2,3-c]pyrazole in shorter reaction times. When 0.5 Fe-CaOx/glu was employed as catalyst, the reaction was finished in 15 min with yield of 89%, whereas 1.0 Fe-CaOx/glu gave 93% yield in 15 min. When 2.0 Fe-CaOx/glu was used as catalyst, the reaction was completed in 10 min and recorded 98% yield. Surprisingly, the use of 3.0 Fe-CaOx/glu resulted in lower yield (90%) and longer reaction time (20 min) (Table 3, entry 9). The higher amount of iron in 3.0 Fe-CaOx might have hindered the creation of active catalytic sites due over dispersion of iron on the surfaces of CaOx as evidenced from the TEM micrograph (Fig. 4d). The change in basic structural orientation of CaOx crystals under higher Fe conditions could be the likely the reason behind the poor catalytic performance of 3.0 Fe-CaOx/glu. The optimally Fe doped sample, (2.0 Fe-CaOx/glu) facilitated completing the reaction in excellent yields and shorter reaction time.
| Entry | Catalyst | Reaction time (min) | Yield (%) |
|---|---|---|---|
| a Reaction conditions: 3-fluoro benzaldehyde (1.0 mmol), malononitrile (1.0 mmol), hydrazine hydrate (1.0 mmol), dimethyl acetylenedicarboxylic acid (1.0 mmol), catalyst (20 mg) and ethanol (5.0 mL) were refluxed at 50 °C. Isolated yields. | |||
| 1 | Without catalyst | 150 | 60 |
| 2 | NaOH | 110 | 63 |
| 3 | Na2CO3 | 110 | 68 |
| 4 | AcOH | 95 | 71 |
| 5 | Al2O3 | 80 | 70 |
| 6 | CaOx/glu | 50 | 79 |
| 7 | 0.5 Fe-CaOx/glu | 15 | 89 |
| 8 | 1.0 Fe-CaOx/glu | 15 | 93 |
| 9 | 2.0 Fe-CaOx/glu | 10 | 98 |
| 10 | 3.0 Fe-CaOx/glu | 20 | 90 |
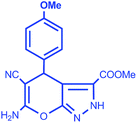
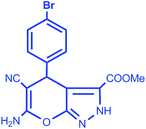
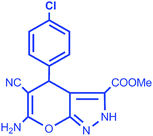
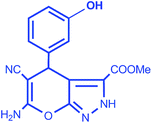
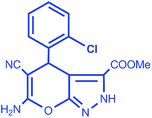
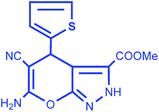
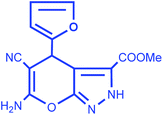
After selecting the appropriate catalyst among the four, the requirement of amount of catalyst (2.0 Fe-CaOx/glu) to ease the organic reaction was investigated by varying it from 10 to 50 mg (Table S1†). A perusal of the results indicate that while amount <20 mg took longer time and lower yields, the increase in amount does not enhance the yield or reduce the reaction time. Further, to examine the efficacy of 2.0 Fe-CaOx/glu as catalyst, a series of reactions were conducted using five different substituted aldehydes under optimized conditions. All the reactions gave the respective pyrano[2,3-c]pyrazole moieties in good to excellent yields (91–98%) (Table 4).
| Entry | Aldehyde | Product | Yield (%) | Time (min)/mp |
|---|---|---|---|---|
| a Reaction conditions: substituted benzaldehyde (1.0 mmol), malononitrile (1.0 mmol), hydrazine hydrate (1.0 mmol), dimethyl acetylenedicarboxylate (1.0 mmol) 2.0 Fe-CaOx/glu and ethanol (5.0 mL) were refluxed at 50 °C.b Isolated yields. | ||||
| 1 |  |
 |
94 | 10/236–237 °C |
| 2 |  |
 |
95 | 15/245–247 °C |
| 3 |  |
 |
91 | 15/213–215 °C |
| 4 | 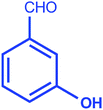 |
 |
96 | 10/217–218 °C |
| 5 |  |
 |
93 | 10/258–260 °C |
| 6 |  |
 |
92 | 15/198–200 °C |
| 7 |  |
 |
94 | 15/221–223 °C |
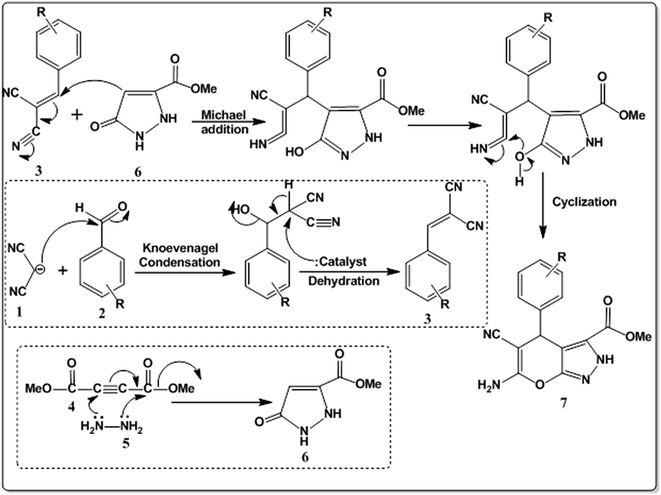
Based the experimental results and identified products, a plausible reaction mechanism is proposed in Scheme 2. The catalyst initiates the formation of benzylidine malononitrile intermediate (3) through the Knoevenagel condensation of aldehyde (1) and malononitrile (2), while hydrazine hydrate (4) combine with dimethyl acetylenedicarboxylate (5) to give pyrazolone intermediate (6). The Michael addition between (3) and (6) followed by cyclization on the catalyst surface produces the desired pyranopyrazole moiety selectively.
The reusability was investigated for 2.0 Fe-CaOx/glu with title reaction (Scheme 1) to estimate the feasibility to use the catalyst for the successive reactions. The filtered and separated catalyst was dried under vacuum for 1 h at 60 °C and tested for the recyclability. The catalytic performance was not altered in terms of reaction time and yields up to six cycles. After the sixth cycle, the depletion in the reaction time and product yields has been started.
4 Conclusions
In summary we report an efficient recyclable heterogeneous catalyst, Fe-CaOx, for one-pot four component synthesis of pyrano[2,3-c]pyrazole moieties in excellent yields. The Fe-CaOx catalysts were prepared by co-precipitation technique using glutamic acid as an additive for crystal growth inhibition. Glutamic acid induced the morphologically well controlled Fe-CaOx crystals without altering the thermally stable calcium oxalate monohydrate (COM) phase. The characterisation results indicate that doped iron occupies the interstitial positions of CaOx crystal. The doping of iron in CaOx enhances the number of catalytic sites which facilitate the Knoevenagel condensation between aromatic aldehyde and malononitrile that resplendent the rapid synthesis of pyrano[2,3-c]pyrazole derivatives. In addition to the novelty of catalyst material, novel compound, methyl 6-amino-5-cyano-4-(3-fluorophenyl)-2,4-dihydropyrano[2,3-c]pyrazole-3-carboxylate was produced with 98% yield in 10 min reaction time. With simple preparation and recyclability, the eco-friendly Fe-CaOx material may prove versatile as catalyst in many value added organic transformations in future.Acknowledgements
The authors thank National Research Foundation, Pretoria, South Africa and University of KwaZulu-Natal, South Africa for financial assistance and research facilities.References
- D. M. D'Souza and T. J. Mueller, Chem. Soc. Rev., 2007, 36, 1095–1108 RSC.
- O. Hosseinchi Qareaghaj, S. Mashkouri, M. R. Naimi-Jamal and G. Kaupp, RSC Adv., 2014, 4, 48191–48201 RSC.
- G. Kaupp, CrystEngComm, 2011, 133, 108–3121 Search PubMed.
- M. R. Naimi-Jamal, J. Mokhtari, M. G. Dekamin and G. Kaupp, Eur. J. Org. Chem., 2009, 2009, 3567–3572 CrossRef.
- Y. L. Li, H. Chen, C. L. Shi, D. Q. Shi and S. J. Ji, J. Comb. Chem., 2010, 12, 231–237 CrossRef CAS PubMed.
- T. Echigo and M. Kimata, Can. Mineral., 2010, 48, 1329–1358 CrossRef CAS.
- V. R. Franceschi and P. A. Nakata, Annu. Rev. Plant Biol., 2005, 56, 41–71 CrossRef CAS PubMed.
- P. A. Nakata, Plant Sci., 2003, 64, 901–909 CrossRef.
- E. J. Baran, J. Coord. Chem., 2014, 67, 3734–3768 CrossRef CAS.
- S. Narula, S. Tandon, S. K. Singh and C. Tandon, Life Sci., 2016, 164, 23–30 CrossRef CAS PubMed.
- K. K. Gangu, G. R. Tammineni, A. S. Dadhich and S. B. Mukkamala, Mol. Cryst. Liq. Cryst., 2014, 591, 114–122 CrossRef CAS.
- A. P. Evan, E. M. Worcester, F. L. Coe, J. Williams and J. E. Lingeman, Urolithiasis, 2015, 43, S19–S32 CrossRef PubMed.
- A. Langdona and B. Grohe, Colloids Surf., B, 2016, 146, 296–306 CrossRef PubMed.
- M. Daudon, D. Bazin and E. Letavernier, Urolithiasis, 2015, 43, S5–S11 CrossRef PubMed.
- A. Verganelaki, V. Kilikoglou, I. Karatasios and P. M. Kalaitzaki, Construct. Build. Mater., 2014, 62, 8–17 CrossRef.
- J. E. Chàvez, C. Crotti, E. Zangrando and E. Farnetti, J. Mol. Catal. A: Chem., 2016, 421, 189–195 CrossRef.
- T. N. Gieshoff, M. Villa, A. Welther, M. Plois, U. Chakraborty, R. Wolf and A. J. Wangelin, Green Chem., 2015, 17, 1408–1413 RSC.
- Y. A. Yuan, D. F. Lu, Y. R. Chen and H. Xu, Angew. Chem., Int. Ed., 2016, 55, 534–538 CrossRef CAS PubMed.
- N. Zhiqiang and L. Yadong, Chem. Mater., 2014, 26, 72–83 CrossRef.
- F. Jones and M. I. Ogden, CrystEngComm, 2010, 12, 1016–1023 RSC.
- E. T. Hwang, R. Tatavarty, J. Chung and M. B. Gu, ACS Appl. Mater. Interfaces, 2013, 5, 532–537 CAS.
- J. He, R. Lin, H. Long, Y. Liang and Y. Chen, J. Colloid Interface Sci., 2015, 454, 144–151 CrossRef CAS PubMed.
- K. K. Gangu, S. N. Maddila, S. Maddila and S. B. Jonnalagadda, J. Alloys Compd., 2017, 690, 817–824 CrossRef CAS.
- J. Yu, H. Tang, B. Cheng and X. Zhao, J. Solid State Chem., 2004, 177, 3368–3374 CrossRef CAS.
- K. K. Gangu, S. Maddila, S. N. Maddila and S. B. Jonnalagadda, Molecules, 2016, 21, 1281 CrossRef PubMed.
- N. Isamberta, M. M. S. Duquek, J. C. Plaquevent, Y. Genisson, J. Rodriguez and T. Constantieuxl, Chem. Soc. Rev., 2011, 40, 1347–1357 RSC.
- C. Graaff, E. Ruijter and R. V. A. Orru, Chem. Soc. Rev., 2012, 41, 3969–4009 RSC.
- A. Domling, W. Wang and K. Wang, Chem. Rev., 2012, 112, 3083–3135 CrossRef CAS PubMed.
- K. Sambasivarao, C. S. Arjun and G. Deepti, ACS Comb. Sci., 2015, 17, 253–302 CrossRef PubMed.
- V. Bhardwaj, D. Gumber, V. Abbot, S. Dhiman and P. Sharma, RSC Adv., 2015, 5, 15233–15266 RSC.
- R. Goel, V. Luxami and K. Paul, Org. Biomol. Chem., 2015, 13, 3525–3555 CAS.
- A. M. M. E. Omar, O. M. Aboulwafa, D. A. E. Issa, M. M. S. El-Shokrofy, M. E. Amr and I. M. Ashmawy, MedChemComm, 2015, 6, 795–805 RSC.
- K. Kuroiwa, H. Ishii, K. Matsuno, A. Asai and Y. Suzuki, ACS Med. Chem. Lett., 2015, 6, 287–291 CrossRef CAS PubMed.
- M. A. Zolfigol, M. Tavasoli, A. R. Moosavi, P. Moosavi, H. G. Kruger, M. Shiri and V. Khakyzadeh, RSC Adv., 2013, 3, 25681–25685 RSC.
- R. Y. Guo, Z. M. An, L. P. Mo, S. T. Yang, H. X. Liu, S. X. Wang and Z. H. Zhang, Tetrahedron, 2013, 69, 9931–9938 CrossRef CAS.
- B. Kupcewicz, K. Sobiesiak, K. Malinowska, K. Koprowska, M. Czyz, B. Keppler and E. Budzisz, Med. Chem. Res., 2013, 22, 2395–2402 CrossRef CAS PubMed.
- N. C. Desai, K. M. Rajpara and V. V. Joshi, Bioorg. Med. Chem. Lett., 2013, 23, 2714–2717 CrossRef CAS PubMed.
- P. P. Bora, M. Bihani and G. Bez, J. Mol. Catal. B: Enzym., 2013, 92, 24–33 CrossRef CAS.
- A. M. Zonouz, I. Eskandari and H. R. Khavasi, Tetrahedron Lett., 2012, 53, 5519–5522 CrossRef CAS.
- Y. Zou, H. Wub, Y. Hua, H. Liu, X. Zhao, H. Ji and D. Shi, Ultrason. Sonochem., 2011, 18, 708–712 CrossRef CAS PubMed.
- F. Tamaddon and M. Alizadeh, Tetrahedron Lett., 2014, 55, 3588–3591 CrossRef CAS.
- E. Soleimani, M. Jafarzadeh, P. Norouzi, J. Dayou, C. S. Sipaut, R. F. Mansac and P. Saei, J. Chin. Chem. Soc., 2015, 62, 1155–1162 CrossRef CAS , errata, 2016, 63, 241.
- K. K. Gangu, S. Maddila, S. N. Maddila and S. B. Jonnalagadda, RSC Adv., 2016, 6, 58226–58235 RSC.
- S. Maddila, S. Rana, R. Pagadala, S. Kankala, S. N. Maddila and S. B. Jonnalagadda, Catal. Commun., 2015, 61, 26–30 CrossRef CAS.
- R. Pagadala, S. Maddila and S. B. Jonnalagadda, Ultrason. Sonochem., 2014, 21, 472–477 CrossRef CAS PubMed.
- R. Pagadala, S. Maddila, V. Moodley, W. E. van Zyl and S. B. Jonnalagadda, Tetrahedron Lett., 2014, 55, 4006–4010 CrossRef CAS.
- M. T. D. Orlando, L. Kuplich, D. O. de Souza, H. Belich, J. B. Depianti, C. G. P. Orlando, E. F. Medeiros and P. C. M. Cruz, Powder Diffr., 2008, 23, S59–S64 CrossRef CAS.
- M. P. Gashti, M. Bourquin, M. Stir and J. Hulliger, J. Mater. Chem. B, 2013, 1, 1501–1508 RSC.
- E. K. Girija, S. N. Kalkura, P. B. Sivaraman and Y. Yokogawa, J. Sci. Ind. Res. India, 2007, 66, 632–639 CAS.
- V. S. Joshi, S. R. Vasant, J. G. Bhatt and M. J. Joshi, Indian J. Biochem. Biophys., 2014, 15, 237–243 Search PubMed.
- M. Berenyi and G. Liptay, J. Therm. Anal., 1971, 3, 437–443 CrossRef.
Footnote |
| † Electronic supplementary information (ESI) available. See DOI: 10.1039/c6ra25372e |
| This journal is © The Royal Society of Chemistry 2017 |

