 Open Access Article
A cobalt tungstate compound sensing electrode for hydrogen detection based upon mixed-potential type sensors
Y. Li,
X. Li*,
J. Wang,
Y. Jun and
Z. Tang
School of Electronic Science and Technology, Institute for Sensing Technologies, Key Lab. of Liaoning for Integrated Circuits Technology, Dalian University of Technology, Dalian 116024, China. E-mail: lixg@dlut.edu.cn
First published on 12th January 2017
Abstract
An yttria-stabilized cubic zirconia (YSZ) based mixed-potential sensor coupled with CoWO4 as the sensing electrode was developed for hydrogen detection at elevated temperatures. The developed CoWO4/YSZ/Pt sensor was found to have a good sensitivity to different concentrations of hydrogen from 80 ppm to 960 ppm in a background of 10% O2/N2 at 450 °C. The sensor showed excellent selectivity to several possible interferents such as CO, C3H8 and NO2. The reproducibility and signal repeatability of the sensor was examined to test the reliability of the sensor. The influence of oxygen variation and humidity in the background on the sensor response was also studied.
1. Introduction
A reliable hydrogen sensor is highly needed for both process control of a hydrogen based energy system and safety monitoring.1 Hydrogen has been explored for hydrogen fuel cells that have been used for stationary electricity generation or proposed for zero-emission combustion engines for automotive electric vehicles.2 However, leakage of hydrogen will become dangerous once the concentration is above 4% when mixed with air.3–5 Among the several types of chemical hydrogen sensors reported in the literature, solid-state yttria-stabilized cubic zirconia (YSZ) electrolyte based mixed-potential type sensors show promise to be explored for hydrogen detection in terms of its resistance to harsh corrosive and high temperature environments.4–10The working principle of the mixed-potential type gas sensors is based upon the different kinetic electrochemical redox reaction rates of the targeted gas species such as hydrogen with the co-adsorbed oxygen at each interface of electrode/electrolyte. The mixed-potential at each electrode would be generated due to the electrochemically reactions of the gas species with the co-adsorbed oxygen at the gas–electrode–electrolyte also called as the triple-phase-boundary (TPB). By employing different electrode materials, the mixed-potential at each electrode would become different due to the different electrochemical catalytic oxidation ability of each electrode material. The electrical potential difference (V) across the electrochemical cell would be thus collected as the sensor response.11–15 This type of sensor has been widely explored for detecting various types of environmental pollutant gases such as CO, NOx (x = 1, 2), hydrocarbons and hydrogen. In particular for the hydrogen sensors, recent work has focused on searching for an appropriate sensing electrode for selectively sensing to hydrogen within a wider concentration range from hundreds of ppm up to 4 vol%.16–20
Metal tungstates with the general formula MWO4 (M denotes Zn, Mn, Co, Ni, Fe etc.) belong to an important family of inorganic functional materials2 and their crystal structures are controlled by cationic radii.3 These metal tungstates have found potential applications for microwave, photoluminescence devices, and humidity sensors.4,5 Some of them have recently been explored for chemical gas sensing applications. It has been reported previously that MWO4 (M = Zn, Mn, Cd) when coupled as the sensing electrodes of the mixed-potential type sensors demonstrated high sensitivity and selectivity to hydrogen.21–23 It points out that the sensing electrode using the transitional metals with partly-empty outermost d shell such as Ni, Co, and Cr in MWO4 could have better sensitivity and selectivity to lower concentrations of hydrogen.
Cobalt tungstates (CoWO4) has been used for antiknock and pigment additives.24,25 Recently, it has been explored for a new oxygen carrier material for syngas production because of its attractive catalytic activity and good alternative sensing performance for detection of ammonia.26–28 Therefore, in this work, we studied CoWO4 sensing electrode for mixed-potential type hydrogen sensors. The CoWO4 sensing electrode indicated excellent sensitivity and selectivity to hydrogen at even lower temperature of 450 °C compared to Zn/Mn/CdWO4 ones.
2. Experimental
2.1 Materials preparation and characterization
The CoWO4 powders were prepared by using a hydrothermal method. During the synthesis, 2.64 g Na2WO4·2H2O (Sinopharm Chemical Reagent Co., Ltd, China) and 1.904 g CoCl2·6H2O (Tianjin Kermiou Chemical Reagent Co., Ltd, China) were separately put into two beakers followed with addition of 40 ml deionized water into these two beakers respectively. The two mixtures were magnetically stirred to obtain the two corresponding homogeneous solutions. After that, obtained Na2WO4 aqueous solution was added into the CoCl2 solution with strong magnetic stirring for 1 hours and the pH of the solution was adjusted to 9 by adding sodium hydroxide. Then, the mixed solution was poured into a 100 ml Teflon-lined stainless steel vessel and further subject to a heat treatment at 180 °C for 12 h. The light black precipitates were obtained and washed with deionized water and ethanol for several times, then dried at 80 °C overnight. Finally, the as-prepared products were calcined at 700 °C for 2 hours and then grinded thoroughly to achieve the final CoWO4 powders.The crystal structure of the obtained CoWO4 was determined by XRD (XRD-6000, Shimadzu Corp., Japan). The XRD patterns were collected using Ni-filtered Cu Kα radiation at 40 kV and 25 mA between 2θ of 10–60° at a scanning speed of 12° min−1. The surface morphology of the sample was analyzed using the scanning electron microscope (SEM, FEI, USA). X-ray photoelectron spectroscopy (XPS) was also analyzed (Thermo escalab 250Xi, Thermo Electron Corp., USA).
2.2 Sensor fabrication and sensing measurements
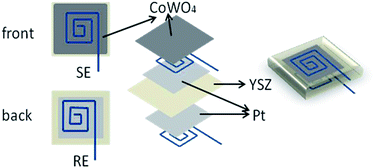
The eight molar percentage yttria-stabilized cubic zirconia (8% YSZ) solid electrolyte disks with a dimension of 10 × 10 × 0.2 mm were purchased from Shanghai Institute of Ceramics, China. The two opposite surfaces of the 8% YSZ disk were ultrasonically cleaned with water and acetone several times to remove the dusts and grease. CoWO4 paste was made by mixing as-synthesized CoWO4 powders with the commercial α-terpineol (99%, Shanghai Baoman Biotechnology Co., Ltd., China). Pt paste was similarly made by mixing the commercial Pt powders (mean particle size 100 nm, Kunming Youyan, China) with the α-terpineol.The sensor was then fabricated following the similar procedures.29 The structures of the CoWO4/YSZ/Pt sensor is illustrated in Fig. 1. The procedures for fabricating the sensor were involved with the following steps: the Pt pastes were painted on both sides of the YSZ electrolyte plate. Then, the painted Pt pastes were firstly fired at 150 °C for 2 h and then 1000 °C for 2 h to sinter the Pt and increase the adhesion of the Pt to the electrolyte. One face of the Pt thick film would work as the reference electrode (RE). The other face of the Pt thick film would serve as the current collector. The CoWO4 paste was painted on the top of the current collector and fired at 700 °C for 2 hours to burn away the organic binders and increase the adhesions of the sensing elements with the electrolyte. The face of the sensor with CoWO4 would work as the sensing electrode (SE).
During the sensor measurements, the as-fabricated planar sensors (CoWO4/YSZ/Pt) were exposed to the testing gases. The testing gas samples were made by diluting the parent commercial gases such as H2, CO, C3H8 and NO2 each with a concentration of 1500 ppm balanced by nitrogen. The gas flow rate was controlled independently using computer controlled, pre-calibrated electronic mass flow controllers (D07-19B, Beijing Senvenstar Elec-tronics, China). The total gas flow rate was maintained at 200 sccm min−1. The electric potential difference (V) of the sensor was measured by a computer controlled Agilent high impedance digital electrometer (100M, Agilent 34401A). The response of the sensor (Rs, mV) was defined as:
| Rs = Va − Vb | (1) |
The dc polarization curves of the sensors were measured using the three-electrode configuration.23 The three-electrode configuration designed using Pt as the counter electrode (CE) and reference electrode respectively. A variation of dc voltages from 0 to 200 mV at a step of 10 mV was applied across the CoWO4 and counter electrode, the current was measured simultaneously by a Keithley system source meter (1 pA to 10 A, Keithley 2612).
3. Results and discussion
3.1 Preparation and characterizations of CoWO4
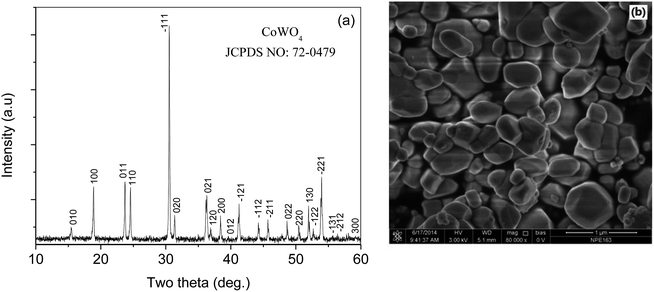
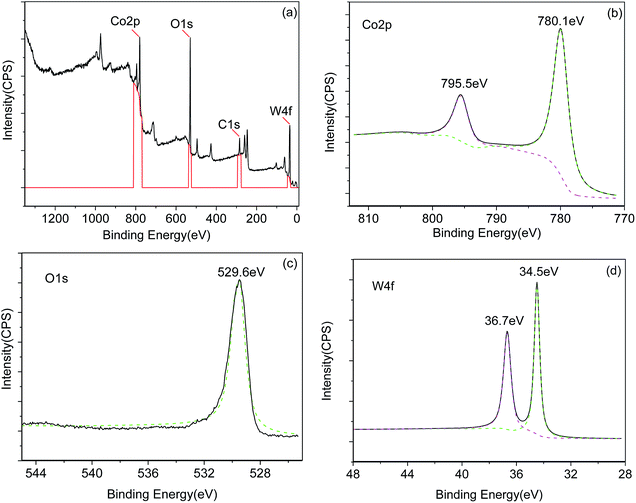
Fig. 2(a) shows the XRD pattern of the prepared CoWO4 powders. The XRD peaks were indexed according to JCPDS No. 72-0479. The crystal structure consists of a single monoclinic phase. Fig. 2(b) shows the surface morphology of calcined CoWO4 powders at 700 °C. The particles in the sample indicated a rod-like morphology with a length ∼300–500 nm and a diameter of the cross section ∼100–200 nm.Fig. 3 shows the XPS spectra of the synthesized CoWO4 powders. Fig. 3(a) shows the survey of the XPS of the sample. It shows that the existence of the three elements such as Co, W and O in the composite. Fig. 3(b) is the local XPS region of Co2p. The coupled two peaks at 780.1 eV and 795.5 eV, respectively, have ΔE = 15.4 eV indicating that the Co has a valence of +3.30 The O1s peak at 529.6 eV shown in Fig. 3(c) corresponds to the lattice oxygen. However, the two peaks of W4f centered at 34.5 eV and 36.7 eV shown in Fig. 3(d) indicates that the W has a valence of +6 in the compound.31 Therefore, the formula of the compound should be more precisely noted as CoWO4.5 with excess oxygen. The excess incorporation of oxygen in the compound could be caused by the calcination of the sample at high temperature in air.
3.2 Sensing properties
Fig. 4(a) shows the response curves of the CoWO4/YSZ/Pt sensor to different concentrations of hydrogen from 80 ppm to 960 ppm in 10% O2/N2 at 400 °C, 450 °C and 500 °C. As the temperature increased from 400 °C to 500 °C, the sensor has the highest response at 450 °C than the other two temperatures and thus the optimum operating temperature of the sensor is 450 °C.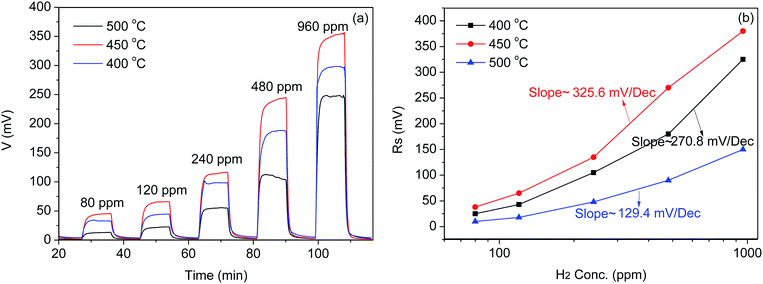 | ||
| Fig. 4 (a) Response curve (b) calibration curves of the CoWO4/YSZ/Pt sensor to different concentrations of hydrogen from 80 ppm to 960 ppm within the temperature range from 400 °C to 500 °C. | ||
Fig. 4(b) shows the calibration curve of the sensor to different concentrations of hydrogen. An approximately logarithmic relationship between the open-circuit electrical potential difference and the concentrations of hydrogen from 80 ppm to 960 ppm was observed indicating that the polarization of the sensor should be within the Tafel-region. Among the three temperatures of 400 °C, 450 °C and 500 °C, the calibration curves has the largest slope of 325.6 mV dec−1 at 450 °C indicating the best sensitivity. The sensing properties of the CoWO4/YSZ/Pt sensor to different concentrations of hydrogen could be explained by the mixed potential theory.4–23 The sensor response, i.e. the electrical potential difference (EPD) across the two electrodes, is dependent upon the electrochemical redox reactions occurring at each TPB of the electrochemical cell according to:
| O2 (adsorbed) + 4e− → 2O2− (YSZ) | (2) |
| 2H2 (co-adsorbed) + 2O2− (YSZ) → 2H2O + 4e− | (3) |
Since the CoWO4 oxide and Pt electrodes have a different ability to electrochemically convert hydrogen to water vapor, the degree of the electrochemical reactions ((2) and (3)) at each TPB became different. Thus, the generated mixed-potential at each electrode (TPB) would be different consequently leading to the observed response. The optimum working temperature was found at 450 °C in terms of response and sensitivity as shown in Fig. 4. At lower temperatures such as 400 °C or below, the ionic conductivity of the YSZ electrolyte would become lower and the sensor response became smaller. One more reason for the lower response at 400 °C may lie in that the electrochemical catalytic properties of CoWO4/YSZ interface became weak leading to the less reactions of hydrogen with the adsorbed oxygen according to reaction (3). As the operated temperature increased to 500 °C, the non-electrochemically catalytic conversion of hydrogen by the both electrodes would become more and more dominant. The difference of oxygen concentrations at TPB of each electrode diminished resulting to the lower response observed at 500 °C.
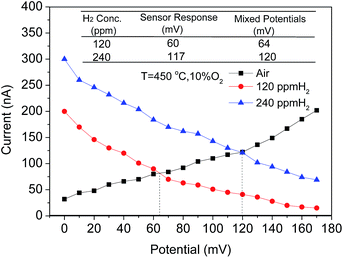
To further confirm that the CoWO4/YSZ/Pt sensor worked in accordance with the mixed-potential theory, the dc polarization curves of the sensor in air and in different concentrations of hydrogen at 120 ppm and 240 ppm were measured as shown in Fig. 5.
The values at the cross point of the polarization curves of the sensor in air and in different concentrations of hydrogen were estimated for the sensor responses, the electrical potential difference between the mixed-potentials generated at each electrode (CoWO4 and Pt) due to the different electrochemically redox reaction rates of hydrogen with adsorbed oxygen at each TPB.
A comparison of the estimated response from the polarization curves and the measured values is summarized in the inset table in Fig. 5. These two values are approximately close to each other indicating that the sensor works based on the mixed-potential mechanism.
The sensitivity of the sensor to some possible interferents such as CO, C3H8 and NO2 were measured. Fig. 6 shows the response of the sensor to different concentrations of CO, C3H8 and NO2 from 80 ppm to 960 ppm in the background of 10 vol% O2/N2 at 450 °C.
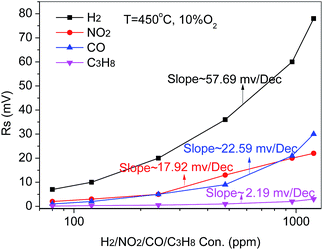 | ||
| Fig. 6 Comparison of the response of the CoWO4/YSZ/Pt sensor to the interferents C3H8/NO2/CO at lower concentrations than 1500 ppm at 450 °C. | ||
The slope of the calibration curve of the sensor to H2 is around 57.69 mV dec−1 which is much larger than those three other gases. Therefore, the sensor indicates a higher sensitivity to H2 relative to the three possible interferents (CO, C3H8 and NO2) thus indicating possibly good selectivity.
The oxygen influence on the sensor response was also examined as shown in Fig. 7. The response was suppressed in the higher oxygen concentration background. This might be due to the enhanced catalytic reactions of hydrogen with the rich oxygen before hydrogen diffused to the TPB leading to an effective lower hydrogen concentration to participate in the electrochemical reactions according to reaction (3) at TPB and thus the lower response.
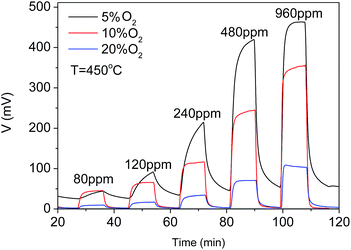 | ||
| Fig. 7 Influence of oxygen to CoWO4/YSZ/Pt hydrogen sensor at 450 °C in the background of 5 vol%, 10 vol% and 20 vol% O2/N2. | ||
Although the response of the sensor is the highest in the background of 5 vol% O2/N2, the response times and recovery times of the sensor became much longer. Therefore, the oxygen concentrations in the background need to be controlled at 10 vol% O2/N2 during the operation of the sensor.
Fig. 8 shows the repeatability of response of the sensor at 960 ppm H2 in a background of 10 vol% O2/N2 at 450 °C. The responses indicated a good repeatability during the several cycling tests. The response time and recovery time is around 145 s and 120 s, respectively.
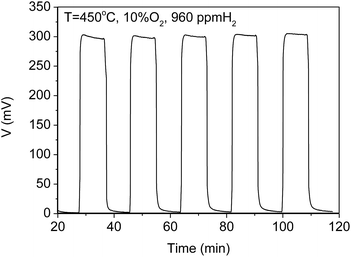 | ||
| Fig. 8 Repeatability of the response of the CoWO4/YSZ/Pt sensor at 960 ppm H2 450 °C in the background of 10 vol% O2/N2. | ||
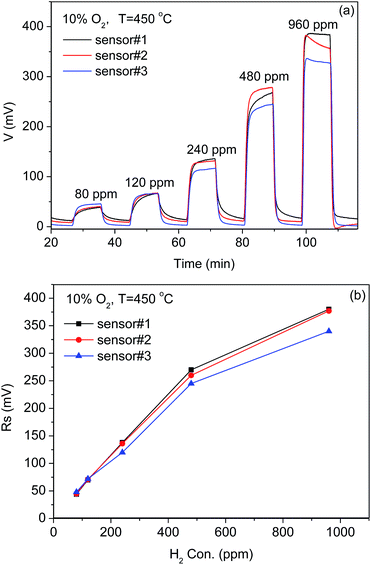
The sensor to sensor consistency (i.e. reproducibility) was investigated. Fig. 9(a) and (b) show the response curves of the three sensors and the correlation plots of the sensor response as a function of the H2 concentrations from 80 ppm to 960 ppm at 450 °C in the background of 10 vol% O2/N2, respectively. There is a slight difference in the sensor response to the same concentration of H2. This may be caused by the chemical processes used for fabricating the thick-film electrodes. The CoWO4 and Pt thick film electrodes were manually painted in this work and thus the microstructure may vary from one sensor to another. Therefore, the processes for fabricating the sensors should be carefully controlled to improve the consistency of the sensors during the mass production.
Fig. 10 shows the effect of the humidity on the response of the sensor to different concentrations of hydrogen. The response of the sensor decreased in presence of the RH ∼ 98% in the background. This could be understood that the reaction (3) would prefer moving backward and thus the electrochemical oxidation process would be suppressed with the presence of water vapor.
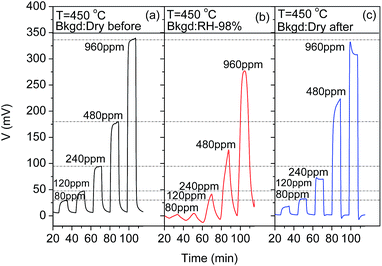 | ||
| Fig. 10 Influence of the humidity on the response of the CoWO4/YSZ/Pt sensor at 450 °C in the background of 10 vol% O2/N2. | ||
Consequently, the generated mixed potential would decrease at the oxide electrode. Moreover, the response and recovery time became slower compared to that without water vapor which is similar to the results reported previously.21–23 This might indicate that the co-adsorbed water molecular with oxygen at the TPB could decrease the reaction rate of reaction (3) as well. The sensor would almost recover after the water vapor was removed from the gas stream as shown in Fig. 10(c).
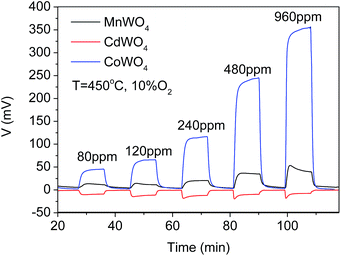
Compared with the MnWO4 and CdWO4 sensing electrodes reported previously,22,23 CoWO4 sensing electrode shows a better sensitivity to the lower concentrations of hydrogen at even lower working temperature of 450 °C as shown in Fig. 11. Similar to Cd2+ in the CdWO4 sensing electrode, Co3+ has the incomplete occupied outest shell of d orbital. It has been proposed in literature that the unoccupied d orbital could enhance the chemical adsorption of hydrogen containing species such as hydrogen, hydrocarbons and alcohols on transition metal oxides and thus a possible better catalytic properties to these gas vapors. Therefore, it may be responsible for the better sensitivity of the CoWO4 sensing electrode to lower concentrations hydrogen.23,27 The lower operating temperature of CoWO4 compared to CdWO4 and MnWO4 sensing electrodes may be attributed to the existence of the cobalt metal in the compound that has known catalytic conversion ability at low temperatures.32–36
The better catalytic properties of CoWO4 could effectively electrochemically oxidation of hydrogen at TPB thus resulting to a better response at the lower temperature. However, further decreasing the operating temperature of the sensor could be limited by the ionic conductivity of the YSZ electrolyte.
4. Conclusions
The YSZ-based mixed-potential type sensor using CoWO4 and Pt as the two electrodes exhibited good response to different hydrogen concentrations from 80 ppm to 960 ppm at 450 °C in the 10% O2/N2 background. The sensor also indicates higher sensitivity to H2 compared to CO, C3H8 and NO2 and shows good signal repeatability and sensor reproducibility. The lower operating temperature of the CoWO4 sensing electrodes compared to MnWO4 and CdWO4 based ones could be due to the better catalytic properties of CoWO4 to hydrogen at lower temperatures. The sensor response would be likely to be affected by the variation of humidity and oxygen concentrations in the background. However, it could be solved by filtering the gas stream and by keeping the oxygen concentration constant in the testing chamber during the operation of the sensor in real scene.Acknowledgements
This study was supported by the National Natural Science Foundation of China (61474012, 61611130065, 61574025, 61274076, 61131004). The financial support from the Foundation of Key Lab. for Micro/Nano Technology and System of Liaoning Province (Grant No. 20140404) are also acknowledged.References
- M. Yamaguchi, S. A. Anggraini, Y. Fujio, M. Breedon, V. V. Plashnitsa and N. Miura, Electrochim. Acta, 2012, 76, 152–158 CrossRef CAS.
- W. J. Buttner, M. B. Post, R. Burgess and C. Rivkin, Int. J. Hydrogen Energy, 2011, 36, 2462–2470 CrossRef CAS.
- T. Hubert, L. Boon-Brett, G. Black and U. Banach, Sens. Actuators, B, 2011, 157, 329–352 CrossRef.
- L. P. Martin and R. S. Glass, J. Electrochem. Soc., 2005, 152, H43–H47 CrossRef CAS.
- P. K. Sekhar, E. L. Brosha, R. Mukundan, H. Mekonen, B. Farber, C. Kreller and F. H. Garzon, Int. J. Hydrogen Energy, 2012, 37, 14707–14713 CrossRef CAS.
- M. Breedona and N. Miura, Sens. Actuators, B, 2013, 182, 40–44 CrossRef.
- S. A. Anggraini, M. Breedon and N. Miura, Electrochem. Commun., 2013, 31, 133–136 CrossRef CAS.
- G. Lu, N. Miura and N. Yamazoe, Sens. Actuators, B, 1996, 35–36, 130–135 CrossRef.
- S. A. Anggrainia, M. Breedonb and N. Miura, Sens. Actuators, B, 2013, 187, 58–64 CrossRef.
- X. Li and G. M. Kale, Sens. Actuators, B, 2007, 123, 254–261 CrossRef CAS.
- X. Li and G. M. Kale, Sens. Actuators, B, 2006, 120, 150–155 CrossRef CAS.
- X. Li and G. M. Kale, Anal. Chem., 2007, 79, 8940–8946 CrossRef CAS PubMed.
- P. K. Sekhar, E. L. Brosha, R. Mukundan, M. A. Nelson, D. Toracco and F. H. Garzon, Solid State Ionics, 2010, 181, 947–953 CrossRef CAS.
- F. H. Garzon, R. Mukundan and E. L. Brosha, Solid State Ionics, 2010, 136–137, 633–638 Search PubMed.
- C. O. Park, S. A. Akbar and W. Weppner, J. Mater. Sci., 2003, 38, 4639–4660 CrossRef CAS.
- T. Hibino, S. Tanimoto, S. Kakimoto and M. Sano, Electrochem. Solid-State Lett., 1999, 2, 651–653 CrossRef CAS.
- R. Moos, K. Sahner, M. Fleischer, U. Guth, N. Barsan and U. Weimar, Sensors, 2009, 9, 4323–4365 CrossRef CAS PubMed.
- R. Sun, Y. Guan, X. Cheng, Y. Guan, X. Liang, J. Ma, P. Sun, Y. Sun and G. Lu, Sens. Actuators, B, 2015, 210, 91–95 CrossRef CAS.
- P. K. Sekhar, E. L. Brosha, R. Mukundan, M. A. Nelson, T. L. Williamson and F. H. Garzon, Sens. Actuators, B, 2010, 148, 469–477 CrossRef CAS.
- Y. Guan, C. Li, X. Cheng, B. Wang, R. Sun, X. Liang, J. Zhao, H. Chen and G. Lu, Sens. Actuators, B, 2014, 198, 110–113 CrossRef CAS.
- Z. Tang, X. Li, J. Yang, J. Yu, J. Wang and Z. Tang, Sens. Actuators, B, 2014, 195, 520–525 CrossRef CAS.
- Y. Li, X. Li, Z. Tang, Z. Tang, J. Yu and J. Yang, Sens. Actuators, B, 2015, 206, 176–180 CrossRef CAS.
- Y. Li, X. Li, Z. Tang, J. Wang, J. Yu and Z. Tang, Sens. Actuators, B, 2016, 233, 365–371 CrossRef.
- R. C. Weast, Handbook of physics and chemistry, CRC Press, Boca Raton, 1983 Search PubMed.
- V. V. Eremenko and V. M. Naumenko, JETP Lett., 1968, 7, 326–331 Search PubMed.
- D. L. R. Thelma, C. M. Virginia, D. V. D. Manuel and L. O. Alejandro, Int. J. Chem. React. Eng., 2007, 5, P.A30 Search PubMed.
- Q. Diao, F. Yang, C. Yin, J. Li, S. Yang, X. Liang and G. Lu, Solid State Ionics, 2012, 225, 328–331 CrossRef CAS.
- L. Dai, G. Yang, H. Zhou, Z. He, Y. Li and L. Wang, Sens. Actuators, B, 2016, 224, 356–363 CrossRef CAS.
- F. Sun, X. Li, L. Liu and J. Wang, Sens. Actuators, B, 2013, 184, 220–227 CrossRef CAS.
- Q. Feng, X. Li, J. Wang and A. M. Gaskov, Sens. Actuators, B, 2016, 222, 864–870 CrossRef CAS.
- X. Li, X. Li, Z. Li, J. Wang and J. Zhang, Sens. Actuators, B, 2017, 240, 273–277 CrossRef CAS.
- X. Xie, Y. Li, Z. Liu, M. Haruta and W. Shen, Nature, 2009, 458, 746–749 CrossRef CAS PubMed.
- W. Y. Li, L. N. Xu and J. Chen, Adv. Funct. Mater., 2005, 15, 851–857 CrossRef CAS.
- H. J. Kim and J. H. Lee, Sens. Actuators, B, 2014, 192, 607–627 CrossRef CAS.
- S. Vetter, S. Haffer, T. Wagner and M. Tiemann, Sens. Actuators, B, 2015, 206, 113–138 CrossRef.
- J. Deng, R. Zhang, L. Wang, Z. Lou and T. Zhang, Sens. Actuators, B, 2015, 209, 449–455 CrossRef CAS.
| This journal is © The Royal Society of Chemistry 2017 |

