 Open Access Article
Creative Commons Attribution 3.0 Unported Licence
Phosphoric acid recovery from concentrated aqueous feeds by a mixture of di-isopropyl ether (DiPE) and tri-n-butylphosphate (TBP): extraction data and modelling
M. Campos Assuncaoab,
G. Cotea,
M. Andrea,
H. Halleuxb and
A. Chagnes *ac
*ac
aPSL Research University, Chimie ParisTech – CNRS, Institut de Recherche de Chimie Paris, 11 rue Pierre et Marie Curie, 75005 Paris, France. E-mail: alexandre.chagnes@univ-lorraine.fr
bPrayon, rue Joseph Wauters 144 à, B-4480 Engis, Belgium
cGéoRessources-UMR CNRS 7359-CREGU-Université de Lorraine, 2 Rue du Doyen Roubault, 54518 Vandoeuvre les Nancy Cedex, France
First published on 20th January 2017
Abstract
This paper reports experimental data about the extraction of phosphoric acid from concentrated aqueous feeds (3 to 14 M H3PO4) by the mixture of di-isopropyl ether (DiPE) and tri-n-butylphosphate (TBP) at 25 °C: distribution ratios of H3PO4 and water, and change of phase volume ratio during extraction. Then, a simple model based on the extraction isotherms of H3PO4 and water as well as on the mass balance of these two compounds is developed in the case of the mixture of 90% wt DIPE and 10% wt TBP that corresponds to the solvent used at the industrial scale for the production of purified phosphoric acid.
Introduction
Phosphoric acid is a weak oxyacid with many industrial applications depending on its degree of purification. Phosphate ore contains many impurities such as calcium, iron, aluminium, fluorine, uranium, etc. Therefore, it is mandatory to implement efficient purification processes to produce purified phosphoric acid for different applications. Merchant grade Phosphoric Acid (MPA) is employed in surface treatments and in the production of fertilizers. Food grade Phosphoric Acid (FPA) is used in the production of salts for animal feeding or in the acidulation of food and drinks for human consumption. Pharmaceutical grade Phosphoric Acid (PPA) is produced for the pharmaceutical industry. From the current production of phosphate ores, 137.6 Mt per year,1 less than 4% is for food and pharmaceutical industries but these two sectors need high-grade phosphoric acid.Phosphoric acid can be produced from phosphate ores by two main processes: (i) pyrometallurgical or thermal processes, which use phosphorus as an intermediate material and issue a pharmaceutical grade phosphoric acid, and (ii) hydrometallurgical or wet processes involving leaching, solvent extraction and precipitation stages. In the thermal process, phosphorus is first produced by reduction of the phosphate rock, followed by re-oxidation and hydration to give phosphoric acid. Despite the production of a very high-grade phosphoric acid, the thermal route has been progressively abandoned due to its prohibitive energetic cost (only 5% of the total phosphoric acid was produced by thermal processes in 2007).2 In the wet process, phosphate, ores are leached with a mineral acid, usually sulfuric acid and the resulting leachate is further purified to produce higher grade phosphoric acid. Currently, several hydrometallurgical techniques, including precipitation,3 adsorption,4,5 ion exchange,6 reverse osmosis,7 nanofiltration8 have been considered to achieve such a purification, and the best practical results are obtained when combining chemical and solvent extraction methods.
There are two main strategies for purifying phosphoric acid: (i) the elimination of the impurities or (ii) the selective extraction of H3PO4. Most of the oldest methods belong to the first category and are based on the precipitation of insoluble salts, even if the recovery of specific elements such as uranium attracts increasing attention.9–13 Few examples are listed below:
• De-fluorination by precipitation of (Na,K)2SiF6 or MgSiF6·6H2O.14
• Sulfate precipitation by adding calcium or barium salts at high temperature.15
• Heavy metal precipitation, for instance as sulfides (e.g., CdS).16
Nowadays, most purification methods belong to the second category, i.e. the selective extraction of H3PO4 against impurities. Various solvents based on functional groups including ethers,17–23 alcohols,24–29 ketones30–38 or trialkylphosphates,38–43,43–49 amines,11,50 sulfoxides51,52 used either individually or in synergetic mixtures, have been patented. These systems are listed in Table 1.
| Process | Patent | Extractant | Feed solution | |
|---|---|---|---|---|
| % P2O5 | M | |||
| Prayon | US3970741 (1974)53 | DIPE + TBP | 61 | 14.2 |
| Rhone-Poulenc | US4769226 (1987)54 | TBP | <40 | 7.6 |
| EP0030487 (1985)55 | ||||
| IMI | US3304157 (1967)56 | Ethers + alcohols | >35 | 6.4 |
| US3311450 (1967)57 | ||||
| US3573005 (1971)58 | ||||
| Budenheim | Iso-propanol | 20–55 | 3.2–12 | |
| Toyo-Soda | US3920797 (1975)59 | Butanol or iso-butanol | No restriction | |
| US4154805 (1977)60 | ||||
| US3529932 (1970)61 | ||||
| Albright & Wilson | US3947499 (1976)62 | MIBK | <62 | 14.2 |
| US3914382 (1975)63 | ||||
| US3912803 (1975)64 | ||||
All of these solvents can extract more or less efficiently phosphoric acid as a result of the formation of hydrogen bonds between the extractant and phosphoric acid molecules. Water is co-extracted as well because hydrogen bonding can take place between the molecules of water and those of extractant/diluent, but also because water and H3PO4 can interact via hydrogen bonding.
Among these systems, the Prayon Process, based on the mixture of 90 wt% di-isopropylether (DiPE) and 10 wt% tri-n-butylphosphate (TBP) is the most used at the industrial scale, with feed solutions typically containing up to 14.2 M H3PO4 (i.e., 61.1% P2O5). In spite of a series of papers about the extraction of H3PO4 from aqueous feeds by the mixture of DiPE (or other ethers) and TBP,65,66 the physicochemistry of such systems is still not well understood, as far as the speciation of H3PO4 in initial and equilibrated aqueous phase, the speciation of H3PO4 in organic phase after extraction, the structure of the organic phases and its dependency on supramolecular phenomena (e.g., 3rd phase formation), etc., are concerned.
Regarding modelling of phosphoric acid extraction by organic solvents, only few studies are available in the literature and they are often limited to H3PO4 concentrations lower than 8 mol L−1.88–92 For instance, Ziat et al.91 modelled the distribution of phosphoric acid between TBP and aqueous solution containing 0–6 mol kg−1 phosphoric acid by means of a thermodynamic model accounting for activity coefficients of phosphoric acid in aqueous and organic phases by using the Pitzer's equation and the Sergievskii–Danus's relationship, respectively, and by considering the presence of the following species: TBP, TBP·H2O, H3PO4·TBP and (TBP)2·H3PO4·H2O. Although these representations describe accurately the thermodynamics of these systems (speciation, activity coefficients), and in certain cases the extraction phenomena, they are limited from low to moderate ionic strengths media and require the adjustment of many parameters, which have almost no physical-sense.
Likewise, Hamdi and Hannachi92 published a simulation of extraction, washing and stripping stages of a WPA purification process using tri-n-butyl phosphate (TBP), methyl isobutyl ketone (MIBK) and their mixture (MIBK + TBP) as extraction solvent. This model was based on the use of extraction isotherms for calculating the number of theoretical stages and the content of acid and impurities in the two phases for each step of the purification process. However, this paper does not give detailed information about the model used and does not predict phase volume changes throughout the extraction whereas volume variations can be particularly high as shown in the present paper.
The objectives of the present paper are to (i) briefly review this physicochemistry, (ii) provide additional extraction data and (iii) propose a model of mass transfer for the mixture of industrial interest that contains 90 wt% di-isopropylether (DiPE) and 10 wt% tri-n-butylphosphate (TBP). The present paper is focused on the modelling of phosphoric acid extraction and not on the modelling of phosphoric acid stripping from DiPE–TBP as the latter is not at all an issue. Indeed, full phosphoric acid stripping can be easily achieved simply by contacting the loaded extraction solvent DIPE + TBP with water at temperature close to 40 °C in order to break hydrogen bonds.
This model is based on the use of the distribution isotherms of H3PO4 and water previously determined by a limited series of experiments. This model has been used for predicting the yield of extraction of H3PO4 and the associated variations of phase volumes (shrinking and swelling of the aqueous and organic phases, respectively) under more general conditions, including the variation of the initial phase volume ratio of the aqueous and organic phases.
Experimental
Materials
TBP (purity > 97%) and DIPE (purity > 98.5%) were both supplied by Sigma-Aldrich and used without further purification. The extraction was performed using a series of phosphoric acid solutions with concentrations ranging from 3 up to 14 M and prepared by dilution from concentrated phosphoric acid (VWR, AnalaR NORMAPUR 85% wt H3PO4) with water purified by a Milli-Q Gradient system from Millipore Corporation (resistivity > 18.2 MΩ cm). The concentrations of the initial solutions were verified by means of acid–base titration with 1 M NaOH (concentration verified using potassium hydrogen phthalate, ACS primary standard). Wet Phosphoric Acid (WPA) used in this work was supplied by Prayon.Solvent extraction procedure
Liquid–liquid extraction of phosphoric acid was carried out by contacting an organic phase containing 10% wt TBP in DIPE with a series of phosphoric acid solutions for which initial concentrations varied from 3 to 14 M and initial phase volume ratio was equal to O/A = 6 (organic phase volume over aqueous phase volume), unless otherwise stated. Aqueous and organic phases were shaked during 1 hour at (25.0 ± 0.2) °C at a shaking frequency of 120 min−1 with a mechanical shaking apparatus (Gherardt Laboshake) thermostated with a Gherardt Thermoshake (H3PO4 extraction equilibria were reached within less than 10 minutes of contact). The mixture was settled for 30 minutes. After phase disengagement, the aqueous phase was separated and the organic phase was filtered by using a Whatman 1 PS filter before being analysed. Volume changes of each phase were observed during phosphoric acid extraction. They were particularly high for the aqueous phase.Phosphoric acid concentrations in aqueous and organic solutions were determined by acid–base titration using a 780 Metrohm pH Meter equipped with a glass electrode with 1.00 M and 5.85 M NaOH (NaOH concentration was checked before titration by using potassium hydrogen phthalate, ACS primary standard). For the organic phase, biphasic titrations were performed by dispersing a weighted amount of the sample in water.
Water concentrations in the organic phases were determined by the Karl–Fischer method using a V20 Mettler-Toledo Karl-Fischer titrator. Hydranal-Methanol Rapid (Fluka Analytical) and Hydranal-Composite 5 (Fluka Analytical) were used as reagents. The calibration was performed by using Hydranal-Water Standard 10.0 (Fluka Analytical, water concentration in the standard of 10.05 ± 0.03 g kg−1).
The volumes of the aqueous and organic phases after equilibration were deduced from their weights and densities (measured with a pycnometer).
Experiments were performed in duplicate and errors on aqueous and organic concentrations of H3PO4 and water are about 2% and 5%, respectively.
Computing
Computer simulations were carried out on a PC with the free mathematical software Scilab©.67 The set of mass balance equations for the calculation of the extraction equilibria was solved by the Powell method implemented in Scilab©.Results and discussion
Physicochemical behaviours: state of the art
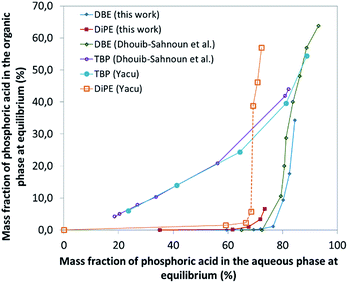 | ||
| Fig. 1 Extraction isotherms of H3PO4 from aqueous feed by various solvents (this work, Dhouib-Sahnoun,46 Yacu74). In the case of DiPE, the dotted part of the extraction curve corresponds to a domain where 3rd phase formation is observed. | ||
Ethers belong to the family of compounds containing donor atoms (here oxygen) but no active hydrogen atoms. They are polar (e.g., μ = 1.18 D for diethyl ether compared to 1.85 D for water) and form a network by α-multimerization (Fig. 2).
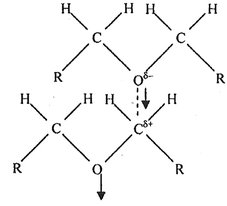 | ||
| Fig. 2 Head–tail arrangement in diethyl ether leading to α-multimerization.75 Adapted with permission from (S. K. Pradhan, S. K. Dash, L. Moharana and B. B. Swain, Indian J. Pure Appl. Sci., 2012, 50, 161–166). Copyright (2012) Indian Journal of Pure & Applied Physics. | ||
Phosphoric acid is extracted in ethers by formation of a complex containing one molecule of water as expressed by the following chemical formula for DiPE: H3PO4·H2O·(CH3)2CHOCH(CH3)2 where H3PO4, H2O and ether molecules are linked together by hydrogen bonds.74
In the formation of the preceding complex, there is a competition between ether and water molecules to form hydrogen bonds with H3PO4. It is of interest that the extraction of H3PO4 becomes significant only when its concentration in aqueous phase is very high (>8 M) which corresponds to the region where the hydrogen-bond based network of water is dramatically modified by insertion of the H3PO4 molecules, to reach at the end a water-in-H3PO4 network. Unfortunately, such H3PO4·H2O·ether complexes formed for instance with DiPE and diethyl ether are poorly soluble both in aqueous solutions and in excess ether, which leads to the formation of third phases (i.e., to the splitting of the organic phase into a light organic phase mainly containing ether and a heavy organic phase containing the complex H3PO4·H2O·ether). Nevertheless, with ethers possessing longer alkyl chains, such as dibutyl ether (DBE), no third phase formation is observed. To delay the formation of such third phases occurring with ethers possessing short chains, including DiPE, phase modifiers can be added, as for instance TBP.
Experimental study of the extraction of H3PO4 and H2O by the mixtures of DiPE and TBP
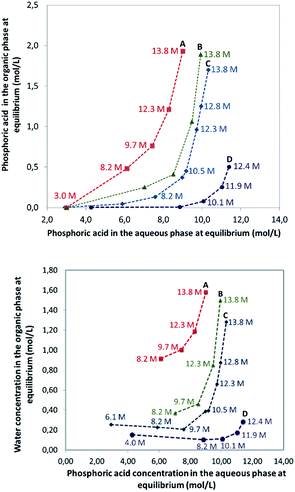
In this part of the work, most experiments have been performed with AnalaR NORMAPUR phosphoric acid.The extraction isotherms of phosphoric acid and water are displayed in Fig. 3 (top and below). These figures show that the extraction of phosphoric acid increases all the more rapidly with aqueous H3PO4 concentration that the concentration of TBP in the mixture DiPE + TBP is high, in coherence with the respective affinity of DiPE and TBP for H3PO4 as reported in Fig. 1. It of interest that the molar ratio [H3PO4]org/[TBP]org related to H3PO4 extracted by TBP (after subtraction of H3PO4 extracted by DiPE) reaches values of 2 at point A and even 4 at point B and 6 at point C. For points B and C, such values are rather high and would normally be expected at higher H3PO4 concentration as reported by Dhouib-Sahnoun et al.46 (Fig. 1). On the other hand, at point A, the value of 2 found for the molar ratio [H3PO4]org/[TBP]org at point A is in agreement with the findings of these authors.46 It also appears that the amount of water extracted into the organic phase exhibits a pseudo-plateau region (with a soft decrease) between 0 and about 7 M H3PO4 (see especially 0.28 M TBP isotherm) and then a sharp increase. This pseudo-plateau region where the extraction of H3PO4 is low corresponds mainly to the solubilisation of water by DiPE (0.22 M water at 25 °C)84 and TBP (3.59 M water at 25 °C).85 The amount of water solubilized in organic phase in this range of aqueous H3PO4 concentration is all the higher that the concentration of TBP in the mixture DiPE + TBP is high. Above about 7 M H3PO4, water extraction follows that of phosphoric acid, but with molar ratio [H2O]org/[H3PO4]org lower than one (e.g., close to 0.7).
The extraction of H3PO4 and water from the aqueous phase to the organic phase implies an important increase of their phase volume ratios O/A compared to the initial values (Fig. 4). As expected, the concentration of H3PO4 in the raffinate decreases during extraction, but due the shrinking of the aqueous phase, the final concentration in the raffinate may remain rather high (e.g., from initially 13.8 M to 8.5 M in point A of Fig. 3), thus the water activity of the system increases during the extraction, which may have consequences on the salting-out effect and the extraction of metal impurities.86,87
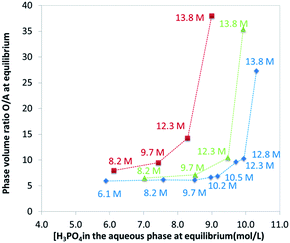 | ||
| Fig. 4 Phase volume ratio at equilibrium plotted against the phosphoric acid concentration at equilibrium in the aqueous phase. Aqueous phase: analytical phosphoric acid which initial concentration ranges between 3 and 13.8 M. Organic phase: mixture of TBP (0.45 M indicated by green triangles, 1 M indicated by red squares, 0.28 M indicated by blue diamonds) in DiPE. See Fig. 3 for experimental conditions. Numbers in the graph correspond to initial concentration of phosphoric acid in the aqueous phase. | ||
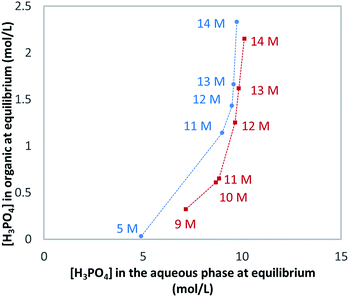
As said above, WPA contains many impurities. However, the presence of such impurities has little effect on the extraction of H3PO4 as shown in Fig. 5.
Modelling of the extraction of H3PO4 and H2O by the mixture of DiPE (90 wt%) and TBP (10 wt%)
As a first approximation, it is assumed in this model that the volume conservation is satisfied as expressed below:
| VT = V0,aq + V0,org = Veq,aq + Veq,org | (1) |
Mass balance of H3PO4 can be written and completed by a volume balance of each phase which takes into account water extraction:
| V0,aqx0 = Veq,aqx + Veq,orgy | (2) |
 | (3) |
 | (4) |
 represents the molar volume of phosphoric acid (
 = 0.053 L mol−1) and
  corresponds to the molar volume of water (
 = 0.018 L mol−1).
In this paper, it is assumed that the solubility of DIPE and TBP in the aqueous phase is sufficiently low to be neglected. Indeed, the solubility of di-isopropyl ether and TBP in water are equal 2 g L−1 at 20 °C and 0.4 g L−1 at 25 °C, respectively.
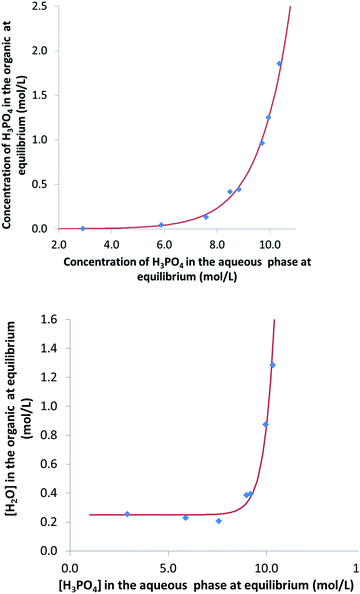
Phosphoric acid and water extraction are described in the present paper by two extraction isotherms y = fH3PO4(x) and z = fH2O(x), respectively, where x denotes phosphoric acid concentration in aqueous phase at the equilibrium.
By using eqn (1)–(3) and the extraction isotherms y = fH3PO4(x) and z = fH2O(x), the following expression can be written:
 | (5) |
Phosphoric acid and water concentrations in the aqueous and organic phases at the equilibrium can be deduced from eqn (5) for any initial conditions. Afterwards, it is thus possible to determine the volumes of the organic and aqueous phases at the equilibrium by means of eqn (6) and (7):
 | (6) |
 | (7) |
y = fH3PO4(x) = 2.5 × 10⁻⁴![[thin space (1/6-em)]](https://www.rsc.org/images/entities/char_2009.gif) e0.855x (with x and y in M) e0.855x (with x and y in M)
| (8) |
z = fH2O(x) = 1.5 × 10⁻⁹![[thin space (1/6-em)]](https://www.rsc.org/images/entities/char_2009.gif) e1.98x + 0.25 (with x and z in M) e1.98x + 0.25 (with x and z in M)
| (9) |
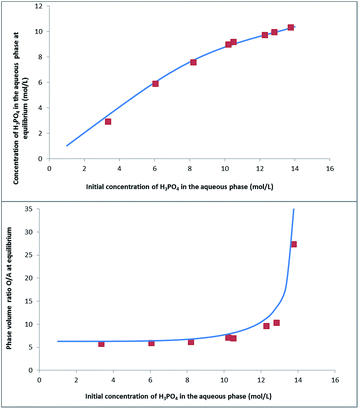
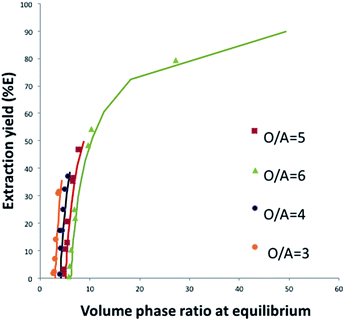
Fig. 8 shows that this model can also be used to calculate the extraction yield of phosphoric acid as a function of the phase volume ratio at equilibrium for different initial phase volume ratios. It should be noted that the plot is derived from the model, and that the variations of volumes measured experimentally were not introduced in the model. There is a good agreement between the model and the experiments.
In order to evaluate the model and assess its ability to represent experimental data, calculated values Zcalc, i.e. calculated phosphoric acid concentration in organic phase, calculated extraction yield or calculated phase volume ratio, have been plotted as a function of the experimental values Zexp, i.e. experimental phosphoric acid concentration in organic phase, experimental extraction yield or experimental phase volume ratio. The equation of Zcalc = F(Zexp) can be expressed as follows:
| Zcalc = uZexp | (10) |
The slope u and the standard deviation R2 for eqn (9) are good indicators for the quality of the model. These values should be equal to unity if the model was in perfect agreement with the experimental data. Table 2 gathers u and R2 values for different experiments. These values confirm the accuracy of the model to predict experimental data.
| [H3PO4]aqa | [H3PO4]orga | O/Aa | [H2O]orga | |
|---|---|---|---|---|
| a At equilibrium. | ||||
| O/A = 7 | ||||
| R2 | 0.9345 | 0.8259 | 1.0868 | 1.0132 |
| u | 1.0589 | 0.9358 | 0.9424 | 0.9753 |
![[thin space (1/6-em)]](https://www.rsc.org/images/entities/char_2009.gif) |
||||
| O/A = 6 | ||||
| R2 | 1.0042 | 0.974 | — | — |
| u | 0.9936 | 0.9056 | — | — |
![[thin space (1/6-em)]](https://www.rsc.org/images/entities/char_2009.gif) |
||||
| O/A = 5 | ||||
| R2 | 0.9888 | 0.9718 | 0.926 | 0.966 |
| u | 0.9674 | 0.9255 | 0.8847 | 1.1012 |
![[thin space (1/6-em)]](https://www.rsc.org/images/entities/char_2009.gif) |
||||
| O/A = 4 | ||||
| R2 | 0.9915 | 0.9688 | 0.9280 | 0.9677 |
| u | 1.0407 | 0.9204 | 0.9439 | 1.1344 |
![[thin space (1/6-em)]](https://www.rsc.org/images/entities/char_2009.gif) |
||||
| O/A = 3 | ||||
| R2 | 0.9941 | 0.995 | 0.7644 | 0.983 |
| u | 1.0489 | 0.7455 | 0.9171 | 1.0398 |
Conclusions
The extraction of H3PO4 and water by the mixtures of DiPE and TBP has been revisited and the obtained results indicate that the speciation in organic phase is more complex than the H3PO4·H2O·ether species reported previously. A simple model based on the extraction isotherms of H3PO4 and water as well as on the mass balance of these two compounds is developed in the case of the mixture of 90% wt DIPE and 10% wt TBP which corresponds to the solvent used at the industrial scale for the production of purified phosphoric acid. The model can be used for optimization of the operational conditions.Acknowledgements
Financial and experimental support from Prayon (Belgium) is gratefully acknowledged. M. Campos Assuncao acknowledges CIFRE for financial support.Notes and references
- S. J. Van Kauwenbergh, M. Stewart and R. Mikkelsen, Better Crops, 2013, 97, 18–20 Search PubMed.
- N. S. Awwad, Y. A. El-Nadi and M. M. Hamed, Chem. Eng. Process., 2013, 74, 69–74 CrossRef CAS.
- R. Kijkowska, D. Pawlowska-Kozinska, Z. Kowalski, M. Jodko and Z. Wzorek, Sep. Purif. Technol., 2002, 28, 197–205 CrossRef CAS.
- L. Monser, M. Ben Amor and M. Ksibi, Chem. Eng. Process., 1999, 38, 267–271 CrossRef CAS.
- A. A. Daifullah, N. Awwad and S. El-Reefy, Chem. Eng. Process., 2004, 43, 193–201 CrossRef CAS.
- D. W. Agers, J. E. House, J. L. Drobnick and C. J. Lewis, Hydrometallurgy, 1963, 515–529 CAS.
- J. Yu and D. Liu, Chem. Eng. Res. Des., 2010, 88, 712–717 CrossRef CAS.
- H. Diallo, M. Rabiller-Baudry, K. Khaless and B. Chaufer, J. Membr. Sci., 2013, 427, 37–47 CrossRef CAS.
- D. Beltrami, G. Cote, H. Mokhtari, B. Courtaud and A. Chagnes, Hydrometallurgy, 2012, 129, 118–125 CrossRef.
- D. Beltrami, A. Chagnes, M. Haddad, A. Varnek, H. Mokhtari, B. Courtaud and G. Cote, Hydrometallurgy, 2013, 140, 28–33 CrossRef CAS.
- D. Beltrami, G. Cote, H. Mokhtari, B. Courtaud, B. A. Moyer and A. Chagnes, Chem. Rev., 2014, 114, 12002–12023 CrossRef CAS PubMed.
- D. Beltrami, A. Chagnes, M. Haddad, H. Laureano, H. Mokhtari, B. Courtaud, S. Juge and G. Cote, Hydrometallurgy, 2014, 144, 207–214 CrossRef.
- D. Beltrami, A. Chagnes, M. Haddad, H. Laureano, H. Mokhtari, B. Courtaud, S. Juge and G. Cote, Sep. Sci. Technol., 2013, 48, 480–486 CrossRef CAS.
- A. M. B. Freitas and M. Giulietti, Nutr. Cycling Agroecosyst., 1997, 48, 235–240 CrossRef CAS.
- M. Kikuchi and Y. Hiraga, US4041134A, 1977, p. 5.
- E. Ennaassia, K. El Kacemi, A. Kossir and G. Cote, Hydrometallurgy, 2002, 64, 101–109 CrossRef CAS.
- C. H. Harrison and P. Roquero, J. Chem. Eng. Data, 2004, 49, 218–220 CrossRef CAS.
- C. H. Harrison and P. Roquero, J. Chem. Eng. Data, 2004, 49, 218–220 CrossRef CAS.
- F. Ruiz, A. Marcilla, A. Ancheta and C. Rico, Solvent Extr. Ion Exch., 1986, 4, 789–802 CrossRef CAS.
- F. Ruiz, A. Marcilla, A. Ancheta and C. Rico, Solvent Extr. Ion Exch., 1986, 4, 771–787 CrossRef.
- A. Marcilla, F. Ruiz, J. Campos and M. Asensio, Solvent Extr. Ion Exch., 1989, 7, 201–210 CrossRef CAS.
- A. Marcilla, F. Ruiz, J. Campus and M. Asensio, Solvent Extr. Ion Exch., 1989, 7, 211–221 CrossRef CAS.
- F. Ruiz, A. Marcilla and A. M. Ancheta, Solvent Extr. Ion Exch., 1987, 5, 1141–1150 CrossRef CAS.
- D. Maljković, D. Maljković and A. Paulin, Solvent Extr. Ion Exch., 1992, 10, 477–489 CrossRef.
- S. Khorfan, O. Shino and A. Wahoud, Chem. Eng., 2003, 45, 139–148 Search PubMed.
- H. G. Gilani, A. G. Gilani, S. Shekarsaraee and H. Uslu, Fluid Phase Equilib., 2012, 316, 109–116 CrossRef.
- A. Gómez-Siurana, F. Ruiz-Beviá, J. Fernández-Sempere and E. Torregrosa-Fuerte, Ind. Eng. Chem. Res., 2001, 40, 892–897 CrossRef.
- F. Ruiz, A. Marcilla, A. M. Ancheta and J. A. Caro, Solvent Extr. Ion Exch., 1985, 3, 331–343 CrossRef CAS.
- H. Ghannadzadeh and K. Ghannadzadeh, in Computational Methods in Applied Science and Engineering, ed. A. K. Haghi, Nova Science Publishers, Inc, Hauppauge, 2010, pp. 95–105 Search PubMed.
- M. Feki and H. F. Ayedi, Can. J. Chem. Eng., 2000, 78, 540–546 CrossRef CAS.
- H. G. Gilani, A. G. Gilani and S. Shekarsaraee, Fluid Phase Equilib., 2013, 337, 32–38 CrossRef.
- A. Marcilla, F. Ruiz and D. Martinezpons, Solvent Extr. Ion Exch., 1993, 11, 469–485 CrossRef CAS.
- J. Saji and M. L. P. Reddy, Hydrometallurgy, 2001, 61, 81–87 CrossRef CAS.
- A. Marcilla, F. Rulz and D. Martinez-Pons, Solvent Extr. Ion Exch., 1993, 11, 455–467 CrossRef CAS.
- M. Feki, M. Fourati, M. M. Chaabouni and H. F. Ayedi, Can. J. Chem. Eng., 1994, 72, 939–944 CrossRef CAS.
- M. Feki and H. F. Ayedi, Sep. Sci. Technol., 1998, 33, 2609–2622 CrossRef CAS.
- A. Hannachi, D. Habaili, C. Chtara and A. Ratel, Sep. Purif. Technol., 2007, 55, 212–216 CrossRef CAS.
- R. Hamdi and A. Hannachi, J. Chem. Eng. Process Technol002E, 2012, 3, 134 CAS.
- J. J. Čomor, M. M. Kopecni and D. M. Petkovic, Solvent Extraction and Ion Exchange, 2007, 15, 991–1006 CrossRef.
- A. Marcilla and F. Ruiz-Bevia, J. Chem. Eng. Data, 2014, 59, 2693–2694 CrossRef CAS.
- J. Mu, R. Motokawa, C. D. Williams, K. Akutsu, S. Nishitsuji and A. J. Masters, J. Phys. Chem. B, 2016, 120, 5183–5519 CrossRef CAS PubMed.
- M. Alibrahim, Period. Polytech., Chem. Eng., 2007, 51, 39–42 CrossRef CAS.
- Y. Jin, J. Li, J. Luo, D. Zheng and L. Liu, J. Chem. Eng. Data, 2010, 55, 3196–3199 CrossRef CAS.
- C. Liu, J. Cao, W. Shen, Y. Ren, W. Mu and X. Ding, Fluid Phase Equilib., 2016, 408, 190–195 CrossRef CAS.
- K. Ziat, B. Messnaoui, T. Bounahmidi, M. de la Guardia and S. Garrigues, Fluid Phase Equilib., 2004, 224, 39–46 CrossRef CAS.
- R. Dhouib-Sahnoun, M. Feki and H. F. Ayedi, J. Chem. Eng. Data, 2002, 47, 861–866 CrossRef CAS.
- E. Hesford and H. A. C. McKay, J. Inorg. Nucl. Chem., 1960, 13, 156–164 CrossRef CAS.
- M. Abdulbake and O. Shino, Period. Polytech., Chem. Eng., 2007, 51, 3 CrossRef CAS.
- X. Fu, J. Shi, Y. Zhu and Z. Hu, Solvent Extr. Ion Exch., 2002, 20, 241–250 CrossRef CAS.
- S. A. Rodrigues, Curso de Pos-Graduacao em Engenharia Metalurgica e Minas, Universidade Federal de Minas Gerais, 2011 Search PubMed.
- Z. R. Toregozhina, M. R. Tanasheva and B. A. Beremzhanov, Zh. Neorg. Khim., 1981, 26, 1419–1422 CAS.
- S. Yuanfu and J. Yuming, EP0176613 A1, 1986.
- E. W. Pavonet, US3970741A, 1976, p. 5.
- L. Winand and D. Perron, US4769226 A, 1988.
- L. Winand, EP0030487 (A1), 1981.
- A. M. Baniel and B. Ruth, US3304157 A, 1967.
- A. Alexander, A. M. Baniel, C. Mount and B. Ruth, US3311450 A, 1967.
- A. M. Baniel and R. Blumberg, US3573005A, 1971.
- S. Fujii, T. Nakajima and I. Toshimitsu, US3920797 A, 1975, p. 7.
- Y. Hiraga and M. Kikuchi, US4154805 A, 1979, p. 6.
- R. Imoto, M. Kikuchi and T. Sakomura, US3529932 A, 1970.
- R. H. Edwards, T. A. Williams and K. Hall, US3947499 A, 1976.
- T. A. Williams, US3914382 A, 1975.
- F. M. Cussons and T. A. Williams, US3912803 A, 1975.
- H. Shlewit and M. Alibrahim, Period. Polytech., Chem. Eng., 2008, 52, 7 CrossRef.
- H. Shlewit, M. Alibrahim and A. Aoudi, Solvent Extr. Res. Dev., Jpn., 2004, 11, 11–20 CAS.
- INRIA-ENPC, Scilab, Copyright© 1989–2005, www.scilab.org Search PubMed.
- A. Dartiguelongue, E. Provost, A. Chagnes, G. Cote and W. Fürst, Solvent Extr. Ion Exch., 2016, 34, 241–259 CrossRef CAS.
- K. L. Elmore, J. D. Hatfield, R. L. Dunn and A. D. Jones, J. Phys. Chem., 1965, 69, 3520–3525 CrossRef CAS.
- B. Messnaoui and T. Bounahmidi, Fluid Phase Equilib., 2005, 237, 77–85 CrossRef CAS.
- K. L. Elmore, C. M. Mason and J. H. Christensen, J. Am. Chem. Soc., 1946, 68, 2528–2532 CrossRef CAS.
- C. Jiang, Chem. Eng. Sci., 1996, 51, 689–693 CrossRef CAS.
- H. Yang, Z. Zhao, D. Zeng and R. Yin, J. Solution Chem., 2016, 45, 1580–1587 CrossRef CAS.
- W. A. Yacu, PhD thesis, University of Aston in Birmingham, August 1997, http://www.eprints.aston.ac.uk/10090/1/Yacu1977_845408.pdf, accessed on 17 December 2016.
- S. K. Pradhan, S. K. Dash, L. Moharana and B. B. Swain, Indian J. Pure Appl. Phys., 2012, 50, 161–166 CAS.
- H. Shlewit and S. A. Khorfan, Solvent Extr. Res. Dev., Jpn., 2002, 9, 59–68 CAS.
- K. Ziat, B. Mesnaoui, T. Bounahmidi, R. Boussen, M. de la Guardia and S. Garrigues, Fluid Phase Equilib., 2002, 201, 259–267 CrossRef CAS.
- C. E. Higgins and W. H. Baldwin, J. Inorg. Nucl. Chem., 1962, 24, 415–427 CrossRef CAS.
- E. R. Irish and W. H. Reas, The Purex process – a solvent extraction reprocessing method for irradiated uranium, Hanford Atomic Products Operation, Richland, Washington, 1957 Search PubMed.
- M. R. Antonio, R. Chiarizia and F. Jaffrennou, Sep. Sci. Technol., 2010, 45, 1689–1698 CrossRef CAS.
- R. Chiarizia, A. Briand, M. P. Jensen and P. Thiyagarajan, Solvent Extr. Ion Exch., 2008, 26, 333–359 CrossRef CAS.
- R. Motokawa, S. Suzuki, H. Ogawa, M. R. Antonio and T. Yaita, J. Phys. Chem. B, 2012, 116, 1319–1327 CrossRef CAS PubMed.
- Y. Kim, H. Kim and K. Park, Bull. Korean Chem. Soc., 2002, 23, 1811–1815 CrossRef CAS.
- A. Mączyński, D. G. Shaw, M. Góral and B. Wiśniewska-Gocłowska, J. Phys. Chem. Ref. Data, 2008, 37, 1147–1168 CrossRef.
- C. J. Hardy, D. Fairhurst, H. A. C. McKay and A. M. Willson, Trans. Faraday Soc., 1964, 60, 1626–1636 RSC.
- G. Cote, A. Jakubiak, D. Bauer, J. Szymanowski, B. Mokili and C. Poitrenaud, Solvent Extr. Ion Exch., 1994, 12, 99–120 CrossRef CAS.
- G. Cote and A. Jakubiak, Hydrometallurgy, 1996, 43, 277–286 CrossRef CAS.
- W. Fürst and H. Renon, AIChE J., 1993, 39, 335–343 CrossRef.
- A. Dartiguelongue, E. Provost, A. Chagnes, G. Cote and W. Fürst, Solvent Extr. Ion Exch., 2016, 34(3), 241–259 CrossRef CAS.
- A. Dartiguelongue, A. Chagnes, E. Provost, G. Cote and W. Fürst, Hydrometallurgy, 2016, 165, 57–63 CrossRef CAS.
- K. Ziat, B. Mesnaoui, T. Bounahmidi, R. Boussen, M. de la Guardia and S. Garrigues, Fluid Phase Equilib., 2002, 259–267 CrossRef CAS.
- R. Hamdi and A. Hannachi, J. Chem. Eng. Process Technol., 2012, 3, 2, DOI:10.4172/2157-7048.1000134.
| This journal is © The Royal Society of Chemistry 2017 |

