 Open Access Article
Infrared dichroism studies and anisotropic photoluminescence properties of poly(para-phenylene vinylene) functionalized reduced graphene oxide†
M. Baibarac *a,
M. Ilieab,
I. Baltoga,
S. Lefrantc and
B. Humbertc
aNational Institute of Materials Physics, Laboratory of Optical Processes in Nanostructured Materials, P.O. Box MG-7, RO-77125, Bucharest, Romania. E-mail: barac@infim.ro
bUniversity of Bucharest, Faculty of Physics, P.O. Box MG-1, RO-77125, Bucharest, Romania
cInstitut des Materiaux “Jean Rouxel”, 2 rue de la Houssiniere, B.P. 32229, F-44322, Nantes, France
First published on 20th January 2017
Abstract
Two methods were used for the synthesis of composites based on reduced graphene oxide (RGO) and poly(para-phenylene vinylene) (PPV) in un-doped and doped state, respectively, i.e. the annealing conversion (AC) of the PPV precursor solution (PS) at 300 °C and the electropolymerization (E) of α,α,α′,α′-tetrabromo-p-xylene. In the case of the E method, a decrease in the distyrylbenzene (DSB) weight onto the RGO sheet surface in favor of PPV in doped state is demonstrated by the s and p polarized IR spectroscopy. The change of the orientation angle of the transition dipole moment vector for the IR bands at 835 and 964 cm−1, in the case of the AC of the PPV PS, is a result of the π–π* interactions between the phenyl groups of PPV and the RGO sheets. The photoluminescence (PL) bands at 2.42 and 2.26 eV indicate the formation of PPV macromolecular chains (MCs) with lengths of 5 and 7–10 repeating units (RUs), respectively. The anisotropic PL studies performed on the composites RGO/PPV in un-doped and doped state, respectively, highlight an increase of the wrapping angle of RGO sheets with PPV MCs with lengths of 5 RUs, when graphene concentration increases.
1. Introduction
The interest in the composites based on PPV and RGO dates from 2013, when the preparation of multi-layer films deposited onto the poly(ethylene terephthalate) (PET) for applications in the field of organic-based portable electronic devices was reported.1 The first application of the PPV/RGO multilayers in the supercapacitor field was demonstrated in 2014.2 In these studies, the Langmuir–Blodgett–Layer (LBL) assembly technique was used for the preparation of the PPV precursor/RGO films, which successively were annealed and converted at 100 °C into the PPV/RGO multilayers.1,2 In comparison with these studies, in the present work, the strategies adopted for the preparation of the PPV/RGO composites will be: (i) the annealing conversion (AC) of the PPV precursor solutions (PSs), containing different RGO weight percentage concentrations, performed at 300 °C and (ii) the electropolymerization of α,α,α′,α′-tetrabromo-p-xylene (TBPX) in the presence of RGO.It is well known that the AC of the PPV PS results in a PPV in un-doped state.3 A partial and total conversion, respectively, of the PPV precursor solution occurs as the conversion temperature is increased from 100 °C to 300 °C.3 Another method used to obtain PPV films in un-doped state was the electrochemical reduction of TBPX at potentials smaller than −1.3 V.4,5 For the particular case of the composites based on PPV and single-walled carbon nanotubes (SWCNTs), it was demonstrated that the chemical and E methods led to a non-covalent and a covalent functionalization, respectively, of SWCNTs with PPV in un-doped state.5,6 To date, the transformation of the PPV films from un-doped state to a doped one was carried out either by chemical oxidation reactions in the presence of FeCl3, I2, or H2SO4 compounds7 or by electro-oxidation of the un-doped PPV films.8 In the case of the electropolymerization of the monomers by cyclic voltammetry, depending on the potential at which cyclic voltammograms (CVs) were stopped, conjugated polymers (CPs) in un-doped or doped state9 were synthesized. In this work, we demonstrate that an alternative method to obtain the PPV films in doped state onto Au electrodes is cyclic voltammetry when the electrochemical polymerization reaction of TBPX in the potential range (−2; +2) V stopped the potential of +2 V versus the Ag/AgCl electrode. A goal of this work is to demonstrate that composites of the type RGO non-covalently functionalized with PPV in un-doped state and RGO covalently functionalized with PPV in doped state can be obtained by the AC of the PPV PS, having different RGO weight percentage concentrations, and the electrochemical polymerization of TBPX in the presence of RGO, respectively, when the CVs were stopped at the potential of +2 V versus the Ag/AgCl electrode.
To establish the molecular structure of the composite materials synthesized by different methods, often the Raman scattering and Fourier transform infrared spectroscopy (FTIR) were used. Considering that the PPV/RGO composites were deposited as films onto the rough Au supports, the vibrational characterization of these materials by surface enhanced Raman scattering (SERS) and IR spectroscopy in the grazing angle incident reflection geometry will be shown in this paper. In the context of the progress recorded in the field of the vibrational properties of PPV and its composites, we note that recently reported studies of IR spectroscopy in the grazing angle incident reflection geometry concerning the dependence on the angle of polarization of the PPV films deposited on Ag and Au supports have allowed a better assessment of the orientation angle of the transition dipole moment vector for the IR absorption bands of macromolecular compounds in the case of the PPV/SWCNT composites prepared by the AC method of the PPV PS, having SWCNT difference weight percentage concentrations.10 Considering that in the present manuscript, the two synthesis methods of the PPV/RGO composites involve the use of rough Au supports, additional information concerning the orientation angle of the transition dipole moment vector for the PPV IR absorption bands will be also reported.
Despite the sustained effort concerning PL properties of the composite materials of the CPs/RGO type when a CP PL quenching effect induced by RGO often was demonstrated,10 at present a confirmation that such process also occurs in the case of PPV/RGO composites is not reported. It is well known that polarized PL studies allow assessment of environmental changes. In the particular case of PPV, to date, special attention was given to the dependence of the PL spectra measured in polarized light with the conversion temperature of PPV PS11 and the assessment of the counter ions effect on energy transfer processes in PPV macromolecular chains (MCs).12 To our best knowledge, no further paper has been published concerning polarized-emission measurements to assess the influence of the carbon nanoparticles on the charge/energy transfer processes that occurs between the two constituents of the PPV/RGO composite. Using the mathematical algorithm previously shown13 in this paper, special attention will be given to the calculation of anisotropy and the wrapping angle of RGO sheets with PPV MCs when the PPV/RGO composites were prepared both by AC of the PPV PSs containing different RGO weight percentage concentrations and the electropolymerization of TBPX in the presence of RGO.
2. Experimental
2.1 Materials
Chemical compounds used in this work, i.e., α,α′-dichloro-p-xylene, tetrahydrothiophene, HCl, NaOH, NaCl, CH3OH, tetrabutyl ammonium bromide (TBAB), dimethylformamide (DMF), graphite powder, KMnO4, NaNO3, H2SO4, H2O2, C2H5OH, and hydrazine, were purchased from Aldrich-Sigma. Compound TBPX was purchased from Tokyo Chemical Industry Co., Ltd.2.2 Synthesis of reduced graphene oxide, poly(para-phenylenevinylene) and their composites
Graphene oxide was prepared according to the protocol published by D. C. Marcano et al. and then reduced in the presence of hydrazine to obtain RGO.14,15The PPV PS was synthesized using the method published by J. D. Stenger-Smith.16 Briefly, a solution of 0.75 M α,α′-dichloro-p-xylene (6.5675 g) in CH3OH (50 ml) was mixed with 3.75 M tetrahydro-thiophene (16.5 ml). The mixture was refluxed under magnetic stirring at the temperature of 50 °C for 12 hours. As increasing of the monomer concentration, the solution tends to yellow. A fraction of methanol (35 ml) is extracted from above solution by distillation. The crystallization of the monomer is obtained by precipitation at 0 °C in distilled acetone (500 ml), when a white precipitate results which is further dried. In order to improve the purity of monomer, the repeated dissolutions and re-crystallizations were carried out in order to eliminate non-dissolved monomer crystals and eventual impurities. The white crystals was dissolved in a polar solvents mixture (e.g. CH3OH![[thin space (1/6-em)]](https://www.rsc.org/images/entities/char_2009.gif) :
:![[thin space (1/6-em)]](https://www.rsc.org/images/entities/char_2009.gif) H2O = 17
H2O = 17![[thin space (1/6-em)]](https://www.rsc.org/images/entities/char_2009.gif) :
:![[thin space (1/6-em)]](https://www.rsc.org/images/entities/char_2009.gif) 36, volumetric ratio) at which was added a NaOH solution (21.4 ml, 1 M) by dropping under the purge with nitrogen gas. The excess of NaOH was neutralized with a HCl solution (10 ml, 1 M), until the pH becoming equal with 7. Further, the solution is dialyzed in distillated water for ten days using a Spectra-Por Dialysis membrane in order to remove the un-reacted monomers and NaCl. After this purification stage, the solution of poly(p-xylene tetra-hidrophenium chloride) is deposited as film onto rough Au support by the solvent evaporation under nitrogen atmosphere at 25 °C. PPV PS films were annealed at 300 °C under vacuum at a pressure of 10−6 Torr for 10 hours. This AC process allows the remove of sulfonium groups leading to the appearance of the vinylene groups. In the case of PPV/RGO composites obtained by AC method, the PPV precursor/RGO blends with different weight percentages concentrations of RGO, equal to 0 wt%, 0.01 wt%, 0.05 wt%, 0.1 wt%, and 0.5 wt%, were prepared and ultrasonically homogenized for 10 min, the AC taking place in the same conditions with those of PPV. Scheme 1S† shows the AC reaction of the PPV PS in the presence of RGO.
36, volumetric ratio) at which was added a NaOH solution (21.4 ml, 1 M) by dropping under the purge with nitrogen gas. The excess of NaOH was neutralized with a HCl solution (10 ml, 1 M), until the pH becoming equal with 7. Further, the solution is dialyzed in distillated water for ten days using a Spectra-Por Dialysis membrane in order to remove the un-reacted monomers and NaCl. After this purification stage, the solution of poly(p-xylene tetra-hidrophenium chloride) is deposited as film onto rough Au support by the solvent evaporation under nitrogen atmosphere at 25 °C. PPV PS films were annealed at 300 °C under vacuum at a pressure of 10−6 Torr for 10 hours. This AC process allows the remove of sulfonium groups leading to the appearance of the vinylene groups. In the case of PPV/RGO composites obtained by AC method, the PPV precursor/RGO blends with different weight percentages concentrations of RGO, equal to 0 wt%, 0.01 wt%, 0.05 wt%, 0.1 wt%, and 0.5 wt%, were prepared and ultrasonically homogenized for 10 min, the AC taking place in the same conditions with those of PPV. Scheme 1S† shows the AC reaction of the PPV PS in the presence of RGO.
For electrochemical synthesis of the composites based on RGO and PPV in doped state, six solutions of 0.02 M TBPX and 0.1 M TBAB with different weight percentage concentrations of RGO, i.e., 0 wt%, 0.01 wt%, 0.025 wt%, 0.05 wt%, 0.1 wt%, and 0.5 wt%, in a solvent mixture of DMF and H2O, having the volumetric ratio of 98![[thin space (1/6-em)]](https://www.rsc.org/images/entities/char_2009.gif) :
:![[thin space (1/6-em)]](https://www.rsc.org/images/entities/char_2009.gif) 2, were prepared. The working electrode was a blank Au support with an area of 1 cm2, while the counter electrode was a spiral Pt wire; the reference electrode was a commercial Ag/AgCl electrode (3 M KCl). Both PPV and the PPV/RGO composites were synthesized by cyclic voltammetry in the potential range of (−2; +2) V versus the Ag/AgCl electrode at a sweep rate of 100 mV s−1. All CVs were stopped at the potential of +2 V versus Ag/AgCl, PPV being in doped state. Scheme 2S† shows electrochemical mechanism of the covalent functionalization of the RGO sheets with PPV MCs.
2, were prepared. The working electrode was a blank Au support with an area of 1 cm2, while the counter electrode was a spiral Pt wire; the reference electrode was a commercial Ag/AgCl electrode (3 M KCl). Both PPV and the PPV/RGO composites were synthesized by cyclic voltammetry in the potential range of (−2; +2) V versus the Ag/AgCl electrode at a sweep rate of 100 mV s−1. All CVs were stopped at the potential of +2 V versus Ag/AgCl, PPV being in doped state. Scheme 2S† shows electrochemical mechanism of the covalent functionalization of the RGO sheets with PPV MCs.
A chemical treatment with a 1 M NH4OH solution of the composites based on RGO and PPV in doped state was performed to achieve a de-doping of the MCs when composites of the RGO/PPV type in un-doped state were expected to result.
2.3 Characterization
The CVs were recorded using a potentiostat/galvanostat from Radiometer Analytical, Voltalab 80 model.Raman spectra were recorded in a backscattering geometry under an excitation wavelength of 676.4 nm, using a T64000 Raman spectrophotometer from Horiba Jobin Yvon.
IR spectra were recorded using a Vertex 70 IR spectrometer from Bruker, endowed with a Hyperion 2000 FTIR microscope with a grazing angle objective.
PL spectra were recorded in a right-angle geometry, at room temperature (RT), using a Horiba Jobin Yvon Fluorolog-3 spectrophotometer, model FL3-22.
3. Results and discussions
3.1 Electrochemical polymerization of TBPX in the presence of RGO
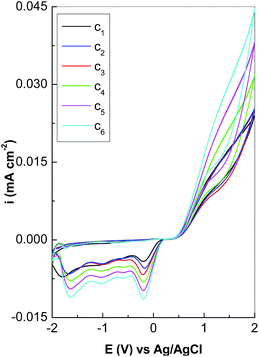
The black curve in Fig. 1 corresponds to the 30th CV of the PPV film, electrochemical synthesized onto Au electrode, when four cathodic peaks at −0.16 V, −0.5 V, −1.05 V, and −1.78 V versus Ag/AgCl were observed. As shown in previously paper,5 during the cathodic scanning of the potential from +2 to −2 V versus Ag/AgCl, the four cathodic peaks are also observed in the first 5 CVs, when the formation of a TBPX diradical was induced.A consequence of the high chemical reactivity of TBPX diradicals toward themselves is the spontaneous dimerization reaction that leads to the formation of a dimer with the chemical formula of Br2HC–C6H4–CH![[double bond, length as m-dash]](https://www.rsc.org/images/entities/char_e001.gif) CH–C6H4–CHBr2.5 As numbers of CVs increase, successive reduction reactions of the dimer enable the growth of PPV MCs.5 Fig. 1 highlights an up-shift of the last cathodic peak from −1.78 V to −1.7 V, −1.67 V, −1.66 V, −1.65 V, and −1.64 V, as gradually increasing of the RGO weight percentage concentration from 0 wt% to 0.01 wt%, 0.025 wt%, 0.05 wt%, 0.1 wt%, and 0.5 wt%, respectively. This change is accompanied by an increase in the current densities of the cathodic peaks at −0.16 V, −0.5 V and −1.05 V versus Ag/AgCl. The preceding variations indicate that the reaction mechanism of the electrochemical synthesized PPV is changed in the presence of RGO when the formation of the RGO sheets covalently functionalized with the PPV oligomers in un-doped state is induced and occurs similar to how the composites based on PPV in un-doped state and SWCNTs highly separated in metallic and semiconducting tubes.5 During the anodic scanning of the potential from −2 to +2 V versus Ag/AgCl, when the working electrode was immersed in the solution of 0.02 M TBPX and 0.1 M TBAB in DMF
CH–C6H4–CHBr2.5 As numbers of CVs increase, successive reduction reactions of the dimer enable the growth of PPV MCs.5 Fig. 1 highlights an up-shift of the last cathodic peak from −1.78 V to −1.7 V, −1.67 V, −1.66 V, −1.65 V, and −1.64 V, as gradually increasing of the RGO weight percentage concentration from 0 wt% to 0.01 wt%, 0.025 wt%, 0.05 wt%, 0.1 wt%, and 0.5 wt%, respectively. This change is accompanied by an increase in the current densities of the cathodic peaks at −0.16 V, −0.5 V and −1.05 V versus Ag/AgCl. The preceding variations indicate that the reaction mechanism of the electrochemical synthesized PPV is changed in the presence of RGO when the formation of the RGO sheets covalently functionalized with the PPV oligomers in un-doped state is induced and occurs similar to how the composites based on PPV in un-doped state and SWCNTs highly separated in metallic and semiconducting tubes.5 During the anodic scanning of the potential from −2 to +2 V versus Ag/AgCl, when the working electrode was immersed in the solution of 0.02 M TBPX and 0.1 M TBAB in DMF![[thin space (1/6-em)]](https://www.rsc.org/images/entities/char_2009.gif) :
:![[thin space (1/6-em)]](https://www.rsc.org/images/entities/char_2009.gif) H2O, the development of a broad oxidation maximum ∼+1.32 V versus Ag/AgCl is observed in the case of the 30th CV of PPV. The presence of RGO in the synthesis solution induces, during the anodic scanning, only an increase of the current densities in the potential range (+0.5; +2) V versus Ag/AgCl. The oxidation maximum at ∼+1.32 V versus Ag/AgCl is assigned to the insertion of the Br− ions into the PPV oligomer MCs according to reactions shown in Scheme 1.
H2O, the development of a broad oxidation maximum ∼+1.32 V versus Ag/AgCl is observed in the case of the 30th CV of PPV. The presence of RGO in the synthesis solution induces, during the anodic scanning, only an increase of the current densities in the potential range (+0.5; +2) V versus Ag/AgCl. The oxidation maximum at ∼+1.32 V versus Ag/AgCl is assigned to the insertion of the Br− ions into the PPV oligomer MCs according to reactions shown in Scheme 1.
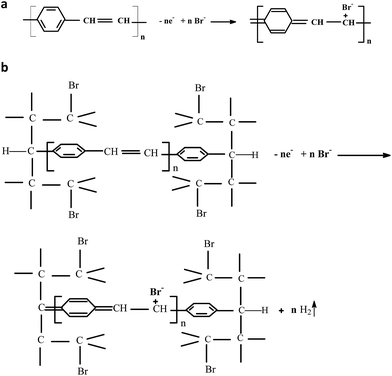 | ||
| Scheme 1 The oxidation reaction of the film of PPV in un-doped state deposited onto the blank Au electrode in the absence of RGO (a) and in the presence of RGO (b). | ||
3.2 Vibrational and photoluminescence properties of the RGO/PPV composites
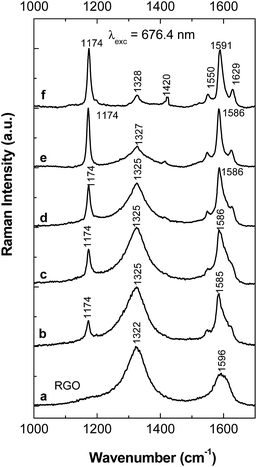
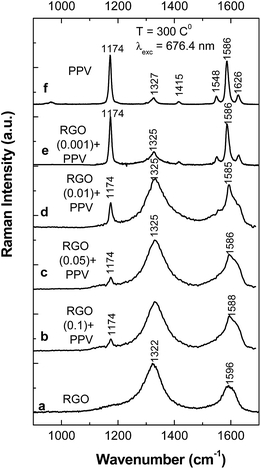
Experimental arguments for the formation of the PPV oligomers in doped state onto the RGO sheets surface, as well as on the blank Au electrode, in the following are shown by surface enhanced Raman scattering (SERS) and IR spectroscopy in the grazing angle incident reflection geometry.Fig. 2 and 3 show Raman spectra of the PPV and RGO films deposited onto Au rough supports as well as of the PPV/RGO composites obtained by the electrochemical polymerization of TBPX and the AC of PPV PSs, respectively. We remind readers that the Raman spectrum of RGO (Fig. 2a) is characterized by the two bands situated at 1322 and 1596 cm−1, often labeled as the D and G bands of graphite materials, which are assigned to the breathing mode of the carbon hexagonal rings and the E2g phonon mode at the center of the Brillouin zone, respectively.15 Fig. 2f and 3f show the Raman spectra of the PPV films, synthesized by the electrochemical polymerization of TBPX and the method of AC of PPV PSs, respectively. Two Raman lines of high intensity are highlighted in the PPV Raman spectra, regardless of the synthesis method used. The former is located at 1174 cm−1, this being assigned to the C–C stretching + C–H bending of the phenyl ring vibrational mode;17 the second one is peaked at 1591 cm−1, having two shoulders at 1550 cm−1 and 1629 cm−1. The three Raman lines at 1550, 1591, and 1629 cm−1 are assigned to the vibrational modes of the C![[double bond, length as m-dash]](https://www.rsc.org/images/entities/char_e001.gif) C stretching of the phenyl ring, C–C stretching of the phenyl ring, and C
C stretching of the phenyl ring, C–C stretching of the phenyl ring, and C![[double bond, length as m-dash]](https://www.rsc.org/images/entities/char_e001.gif) C stretching of the vinyl group, respectively.17 In addition, the Raman spectra of the PPV, synthesized by the two methods, show a Raman line of lower intensity peaked at 1326 cm−1; that is attributed to the vibrational mode of C
C stretching of the vinyl group, respectively.17 In addition, the Raman spectra of the PPV, synthesized by the two methods, show a Raman line of lower intensity peaked at 1326 cm−1; that is attributed to the vibrational mode of C![[double bond, length as m-dash]](https://www.rsc.org/images/entities/char_e001.gif) C stretching + C–H bending of the vinyl group,17 and a Raman G band peaked at ∼1585–1588 cm−1 assigned to the E2g phonon mode at the center of the Brillouin zone.15
C stretching + C–H bending of the vinyl group,17 and a Raman G band peaked at ∼1585–1588 cm−1 assigned to the E2g phonon mode at the center of the Brillouin zone.15
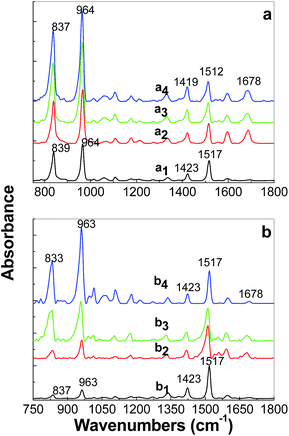
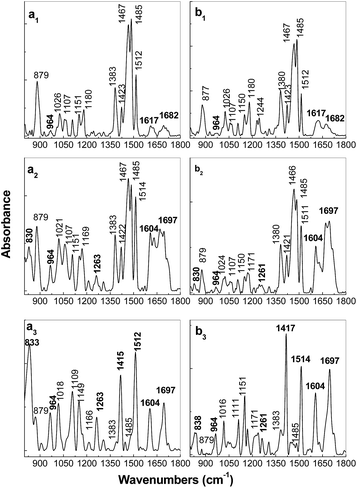
Regardless of the synthesis method of the PPV/RGO composites, a gradual decrease in the relative intensity of the Raman line peaked at 1174 cm−1, accompanied by an increase in the relative intensity of the Raman band situated in the spectral range of 1200–1400 cm−1 (Fig. 2 and 3), is observed as the RGO weight percentage concentration in the composite mass increases. The only difference observed between the Raman spectra of the PPV films, synthesized by electrochemical and chemical method, i.e., when the polymer is in doped and un-doped state, respectively, is the position of the Raman line assigned to the symmetrical phenyl ring bending vibrational mode,17 which is changed from 1420 cm−1 (Fig. 2f) to 1415 cm−1 (Fig. 3f). Considering all these variations, in this stage of our studies, it is difficult to conclude that the two synthesis methods result in the formation of composites of the type RGO/PPV in doped state and RGO/PPV in un-doped state. To overcome this inconvenience, Fig. 4 and 5 show the p and s polarized IR spectra of PPV and its composites synthesized by the two methods. In the case of the samples obtained by the AC of the PPV PS, at the temperature of 300 °C, i.e., when the polymer oligomers are in un-doped state, the IR absorption bands at ∼837, 963, 1423, and 1517 cm−1 (Fig. 4), assigned to the vibrational modes of phenyl ring C–H out-of-plane bending, trans-vinylene C–H out-of-plane bending, phenyl ring C![[double bond, length as m-dash]](https://www.rsc.org/images/entities/char_e001.gif) C in-plane bending and phenyl ring C–C in-ring stretching, respectively,18,19 show a dependence both with s and p polarization (as reported in ref. 18–20) and the RGO weight percentage concentration.
C in-plane bending and phenyl ring C–C in-ring stretching, respectively,18,19 show a dependence both with s and p polarization (as reported in ref. 18–20) and the RGO weight percentage concentration.
A significant increase in the absorbance of the IR bands peaked at ∼837 and 963–964 cm−1, as increase of the RGO weight percentage concentration in the PPV/RGO composite mass is observed in Fig. 4. These variations were reported to be characteristic for carbon nanoparticles-based materials such as SWCNTs non-covalently functionalized with PPV in un-doped state.18–20
Table 1 shows the variation of the orientation angle of the transition dipole moment vector (θIR) for the four IR absorption bands at ∼837, 963, 1423, and 1517 cm−1 when the films of PPV with difference weight percentage concentration of RGO deposited onto Au supports were obtained by the AC of the PPV precursor/RGO blends at the conversion temperature of 300 °C. A smaller variation of the orientation angle of the transition dipole moment vector is observed only in the case of the IR band peaked at 1516 cm−1. By analogy with the case of the PPV/SWCNT composites, obtained by the AC of the PPV PSs with different weight percentages concentrations of SWCNTs, at the conversion temperature of 300 °C, the variation of the IR band peaking at 1517 cm−1, only by 4°, indicates an adsorption of the PPV non-covalently functionalized RGO composite onto the Au support through the C–C stretching vibrational mode of the phenyl ring.20 In our opinion, the variations of 28° and 41° in the IR bands peaked at ∼833–837 and 963–964 cm−1, as increasing the RGO weight percentage concentration in the PPV/RGO composite mass indicates significant perturbations induced by vibrational modes of phenyl ring C–H out-of-plane bending and trans-vinylene C–H out-of-plane bending, respectively, as a consequence of the π–π* interactions established between the basal plane of RGO and phenyl rings of the PPV MCs.
| ν (cm−1) | θIR (degree) for PPV20 | θIR (degree) for PPV/0.01 wt% RGO | θIR (degree) for PPV/0.1 wt% RGO | θIR (degree) for PPV/0.5 wt% RGO |
|---|---|---|---|---|
a The θIR value was calculated with the following equation:18,20 R = Ap/As = (sin2![[thin space (1/6-em)]](https://www.rsc.org/images/entities/char_2009.gif) θIR + o)/(2 θIR + o)/(2![[thin space (1/6-em)]](https://www.rsc.org/images/entities/char_2009.gif) cos2 cos2![[thin space (1/6-em)]](https://www.rsc.org/images/entities/char_2009.gif) θIR + o) where Ap, As, R and o correspond to the absorbance measured in the s and p polarization, the dichroic ratio and the orientation parameter equal with 0.04. θIR + o) where Ap, As, R and o correspond to the absorbance measured in the s and p polarization, the dichroic ratio and the orientation parameter equal with 0.04. |
||||
| 835 | 82 | 80 | 72 | 54 |
| 964 | 72 | 75 | 72 | 36 |
| 1421 | 58 | 58 | 68 | 70 |
| 1516 | 55 | 56 | 58 | 59 |
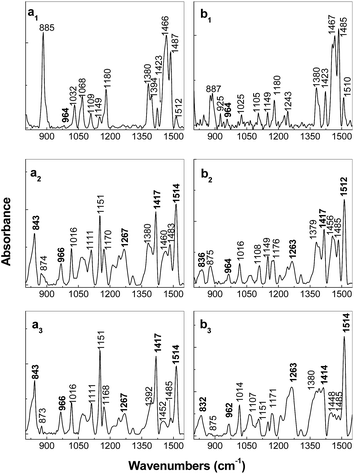
In this stage of our study, it is worth mentioning that the variation of 28° noted in Table 1 for the IR band peaked at ∼833–837 cm−1, assigned to the vibrational modes of phenyl ring C–H out-of-plane bending18,19 fits well with the PPV torsion angles distribution Φ1 and Φ2 calculated by R. I. Venkatanarayanan et al.21 to be equal with 27 ± 1°. Comparison with the samples prepared by the AC method of the PPV PS with different weight percentage concentrations of RGO, in the case of the samples of PPV and its composites containing RGO and PPV in doped state, prepared by electrochemical polymerization of TBPX, significant differences are evidenced in Fig. 5. Fig. 5a1 and b1 show p and s polarized IR spectra of the compound electrochemical synthetized in the absence of RGO. The assignment of the IR absorption bands peaked at 885, 1025–1032, 1068, 1105–1109, 1149, 1180, 1380–1394, 1423, 1466–1485, and 1512 cm−1 is shown in Table 1S.† Here, it is worth mentioning that the above IR absorption bands were reported belonging to PPV in doped state.7,18,22 The very low absorbance of IR bands peaked at 964 and 1518 cm−1, assigned to the vibrational modes of C–H out-of-plane bending of trans-vinylene group and phenylene ring C![[double bond, length as m-dash]](https://www.rsc.org/images/entities/char_e001.gif) C stretching,18,19 respectively (Fig. 5a1 and b1), must be understood taking into account the molecular structure of PPV in doped state obtained according to Scheme 1a. A puzzling fact is that these vibrational modes of PPV in doped state are located at the same frequencies as those reported in the case of distyryl benzene (DSB), a compound that shows three benzene rings and two vinyl groups.19 This fact allows advancing the hypothesis that by the electrochemical polymerization of TBPX, both PPV oligomers in doped state and DSB are synthesized.18,19 As observed in Fig. 5a1 and b1, the IR spectrum of the PPV MCs in doped state shows a strong dependence on the angle of polarization of the IR absorption bands peaked at ∼885, 1000–1200, and 1510 cm−1. In comparison with Fig. 5a1 and b1, the following changes were observed in the IR spectra of the composites based on RGO and PPV MCs in doped state (Fig. 5a2, a3 and b2, b3) as the RGO weight percentage concentration in the composites mass increased: (i) a down-shift of the IR absorption bands from 885 and 1423 cm−1 to 875 and 1417 cm−1, respectively, simultaneously with the appearance of two new IR absorption bands peaked at 832–843 and 962–966 cm−1; (ii) a gradual change of the ratio between the absorbance of the p/s polarized IR bands situated in the spectral ranges of 1350–1400 and 1450–1500 cm−1 from 0.46/0.39 (Fig. 5a1 and b1) to 1.01/0.86 (Fig. 5a2 and b2) and 1.92/1.95 (Fig. 5a3 and b3); (iii) a gradual increase in the absorbance of the p polarized IR band with the maximum at 1149–1151 cm−1; and (iv) an increase in the absorbance of the IR band with the maximum at 1510–1514 cm−1 is reported in the case of the p and s polarized IR spectra of the composites based on RGO and PPV in doped state.
C stretching,18,19 respectively (Fig. 5a1 and b1), must be understood taking into account the molecular structure of PPV in doped state obtained according to Scheme 1a. A puzzling fact is that these vibrational modes of PPV in doped state are located at the same frequencies as those reported in the case of distyryl benzene (DSB), a compound that shows three benzene rings and two vinyl groups.19 This fact allows advancing the hypothesis that by the electrochemical polymerization of TBPX, both PPV oligomers in doped state and DSB are synthesized.18,19 As observed in Fig. 5a1 and b1, the IR spectrum of the PPV MCs in doped state shows a strong dependence on the angle of polarization of the IR absorption bands peaked at ∼885, 1000–1200, and 1510 cm−1. In comparison with Fig. 5a1 and b1, the following changes were observed in the IR spectra of the composites based on RGO and PPV MCs in doped state (Fig. 5a2, a3 and b2, b3) as the RGO weight percentage concentration in the composites mass increased: (i) a down-shift of the IR absorption bands from 885 and 1423 cm−1 to 875 and 1417 cm−1, respectively, simultaneously with the appearance of two new IR absorption bands peaked at 832–843 and 962–966 cm−1; (ii) a gradual change of the ratio between the absorbance of the p/s polarized IR bands situated in the spectral ranges of 1350–1400 and 1450–1500 cm−1 from 0.46/0.39 (Fig. 5a1 and b1) to 1.01/0.86 (Fig. 5a2 and b2) and 1.92/1.95 (Fig. 5a3 and b3); (iii) a gradual increase in the absorbance of the p polarized IR band with the maximum at 1149–1151 cm−1; and (iv) an increase in the absorbance of the IR band with the maximum at 1510–1514 cm−1 is reported in the case of the p and s polarized IR spectra of the composites based on RGO and PPV in doped state.
Similar changes with those reported in the case of single-walled carbon nanotubes covalently functionalized with PPV5 are reported by the IR absorption spectroscopy under polarized light, when the covalent functionalization of the RGO sheets with PPV took place. Similar changes with those reported in the case of single-walled carbon nanotubes covalently functionalized with PPV5 are reported by the IR absorption spectroscopy under polarized light, when the covalent functionalization of the RGO sheets with PPV took place.
In this context, it is worth mentioning: (i) the down-shift of the IR band assigned to the vibrational mode of phenyl ring C![[double bond, length as m-dash]](https://www.rsc.org/images/entities/char_e001.gif) C in-plane bending18,19 from 1423 cm−1 (Fig. 5a1 and b1) to 1417–1414 cm−1 (Fig. 5a3 and b3); (ii) the change of the ratio between the absorbance of the p/s polarized IR bands assigned to the vibrational modes of phenyl ring C
C in-plane bending18,19 from 1423 cm−1 (Fig. 5a1 and b1) to 1417–1414 cm−1 (Fig. 5a3 and b3); (ii) the change of the ratio between the absorbance of the p/s polarized IR bands assigned to the vibrational modes of phenyl ring C![[double bond, length as m-dash]](https://www.rsc.org/images/entities/char_e001.gif) C in-plane bending18,19 and the PPV quinoid structure7,18,22 situated at 1414–1423 and 1485 cm−1, respectively, from 0.26/0.33 (Fig. 5a1 and b1) to 1.81/1.23 (Fig. 5a2 and b2) and 5.26/2.39 (Fig. 5a3 and b3); (iii) the increase in the absorbance of the IR band assigned to the vibrational modes of phenyl ring C–H out-of-plane bending18,19 situated at 843–832 cm−1 (Fig. 5a2, b2, a3 and b3); and (iv) a down-shift of the IR band, assigned to the E2g, a vibrational mode19 from 1180 to 1151 cm−1 which is accompanied of an increase in its absorbance (Fig. 5a1–a3). These changes can be explained taking into account the reaction mechanism of the electrochemical functionalization of the RGO sheets with PPV shown in Scheme 2S,† when the formation of new covalent bonds C–C between RGO and PPV takes place.
C in-plane bending18,19 and the PPV quinoid structure7,18,22 situated at 1414–1423 and 1485 cm−1, respectively, from 0.26/0.33 (Fig. 5a1 and b1) to 1.81/1.23 (Fig. 5a2 and b2) and 5.26/2.39 (Fig. 5a3 and b3); (iii) the increase in the absorbance of the IR band assigned to the vibrational modes of phenyl ring C–H out-of-plane bending18,19 situated at 843–832 cm−1 (Fig. 5a2, b2, a3 and b3); and (iv) a down-shift of the IR band, assigned to the E2g, a vibrational mode19 from 1180 to 1151 cm−1 which is accompanied of an increase in its absorbance (Fig. 5a1–a3). These changes can be explained taking into account the reaction mechanism of the electrochemical functionalization of the RGO sheets with PPV shown in Scheme 2S,† when the formation of new covalent bonds C–C between RGO and PPV takes place.
To explain these variations and to verify the hypothesis that the electrochemical polymerization of TBPX leads to the synthesis of two reaction products, i.e., PPV oligomers in doped state and DSB, Fig. 6 shows the p and s polarized IR spectra of the synthesized electrochemical samples, which were successively interacted with the 1 M NH4OH solution for 5 min. Such an interaction should lead to a de-doping of PPV in doped state, when MCs of PPV in un-doped state are anticipated to result. If this condition occurs, the p and s polarized IR absorption spectra will be similar to those shown in Fig. 4. The interaction of the PPV in doped state with the 1 M NH4OH solution induces the following changes in the IR absorption spectra of Fig. 6: (i) a decrease in the absorbance of the IR band located in the spectral range of 800–850 cm−1 in the p polarization geometry (Fig. 5a1 and 6a1); (ii) a down-shift of the IR band, assigned to the A1g vibrational mode, from 885–887 cm−1 to 879–877 cm−1 is observed for both the p and s polarized IR spectra (Fig. 5a1, b1 and 6a1, b1); (iii) a change of the ratio between the absorbance of the IR bands located in the spectral range of 1100–1200 cm−1 (I1151–1149/I1180) from 0.29 and 0.52 (Fig. 5a1 and b1) to 0.82 and 0.63 (Fig. 6a1 and a2), when the PPV IR spectra were recorded in p and s polarization geometry, respectively. Above variations reported in the 850–1500 cm−1 spectral range indicate that DSB is also electrochemical synthesized on the Au support. The successively interaction of PPV in doped state with the 1 M NH4OH solution leads to a significant increase in the absorbance of the IR band peaked at 1518 cm−1 (Fig. 6a1 and b1). A careful analysis of Fig. 5a1, b1 and 6a1, b1 indicates a change of the ratio between absorbance of the IR bands peaked at 1512–1518 and 1423 cm−1, recorded under p/s polarized light, from 0.54/0.81 (Fig. 5a1 and b1) to 2.11/1.36 (Fig. 6a1 and b1), when PPV in doped state has interacted with the 1 M NH4OH solution. This fact indicates clearly the transformation of PPV from the doped state into an un-doped state. Contrary to our expectations, an increase in the absorbance of the IR band peaked at 964 cm−1 is not observed after the interaction of PPV in doped state with the 1 M NH4OH solution. For the moment an explanation for this behavior is difficult to be advanced. A different behavior is observed in the case of the PPV/RGO composites synthesized by electrochemical method and successively interacted with the 1 M NH4OH solution when an increase in absorbance of the IR band peaked at 964 cm−1 is observed in Fig. 6a2, a3, b2 and b3. Other changes observed in IR spectra of the samples resulting after the chemical interaction of NH4OH with the composites based on PPV in doped state and RGO (Fig. 6a2, a3, b2 and b3) consist in: (i) a gradual increase in absorbance of the IR band with maximum at ∼830–833 cm−1 simultaneously with the decrease in absorbance of the IR band localized at 879 cm−1; the ratio between absorbance of the IR bands peaked at ∼830–833 and 879 cm−1 (I830–833/I879) in the p/s polarized IR spectra is equal to 0.66/0.39 and 3.23/3.89 when the weight percentage concentration of RGO in the composite mass was of 0.01 wt% and 0.1 wt%, respectively; (ii) a change of the value of the ratio between the absorbance of the IR bands peaked at ∼1151 and 1169 cm−1 (I1151/I1169) in the p/s polarized IR spectra from 0.82/0.78 to 2.92/2.93 when the weight percentage concentration of RGO in the composite mass was of 0.01 wt% and 0.1 wt%, respectively; (iii) a gradual increase in the absorbance of the IR band with maximum at 1261–1263 cm−1; and (iv) a change of the ratios between the absorbance of the IR bands with maxima at (a) 1383 and 1422–1415 cm−1 (I1383/I1422–1415) from 0.72/0.78 (Fig. 6a2 and b2) to 9.64/4.83 (Fig. 6a3 and b3) and (b) 1467–1485 and 1512–1514 cm−1 (I1467–1485/I1512–1514) from 0.84/0.66 (Fig. 6a2 and b2) to 5.85/8.71 (Fig. 6a3 and b3) when the RGO weight percentage concentration in the composite mass was of 0.01 wt% and 0.1 wt%, respectively. In this stage of our study, it is worth mentioning that the IR bands at 833, 964, 1415, and 1514 cm−1, observed in Fig. 6a2, a3, b2, and b3, are also reported in the IR spectra of PPV in un-doped state (Fig. 4). This fact shows that as the RGO weight percentage concentration in the PPV electrochemical synthesis solution increases, the PPV MCs similar to those reported in the PPV synthesized by AC of the PPV PS are obtained to the detriment of DSB. In the case of the composite, based on PPV in doped state and 0.5 wt% RGO, electrochemical synthesized and successively interacted with the 1 M NH4OH solution, the increase in the absorbance of the IR band at 1417 cm−1, assigned to the phenyl ring C![[double bond, length as m-dash]](https://www.rsc.org/images/entities/char_e001.gif) C in-plane bending vibrational mode,18,19 indicates a hindrance steric effect induced by the covalent functionalization of the RGO sheets with MCs of PPV in un-doped state.
C in-plane bending vibrational mode,18,19 indicates a hindrance steric effect induced by the covalent functionalization of the RGO sheets with MCs of PPV in un-doped state.
Returning to Fig. 4, it is worth mentioning that the p and s polarized IR spectra of the PPV films in un-doped state synthesized by the PPV PS AC method show an absorption band peaked at 1678 cm−1 with a very low absorbance (curves a1 and b1 in Fig. 4) which was assigned to the C![[double bond, length as m-dash]](https://www.rsc.org/images/entities/char_e001.gif) O stretching vibrational mode.18 An IR absorption band, peaked at 1682 cm−1, of low absorbance, was also reported in the case of the PPV sample synthesized by electrochemical method and successively interaction with a 1 M NH4OH solution (Fig. 6a1 and b1). Regardless of the synthesis method of composites based on RGO and PPV in un-doped state, i.e. AC method (curves a2–a4 in Fig. 4) and electrochemical method and successively interaction with a 1 M NH4OH solution (Fig. 6a2, a3, b2 and b3), an increase in absorbance of the IR band situated in the spectral range 1650–1750 cm−1 is reported. In our opinion, the increase in absorbance of the IR band situated in the spectral range 1650–1750 cm−1 in the case of the PPV/RGO composites prepared by AC method originates in presence of reminiscent C
O stretching vibrational mode.18 An IR absorption band, peaked at 1682 cm−1, of low absorbance, was also reported in the case of the PPV sample synthesized by electrochemical method and successively interaction with a 1 M NH4OH solution (Fig. 6a1 and b1). Regardless of the synthesis method of composites based on RGO and PPV in un-doped state, i.e. AC method (curves a2–a4 in Fig. 4) and electrochemical method and successively interaction with a 1 M NH4OH solution (Fig. 6a2, a3, b2 and b3), an increase in absorbance of the IR band situated in the spectral range 1650–1750 cm−1 is reported. In our opinion, the increase in absorbance of the IR band situated in the spectral range 1650–1750 cm−1 in the case of the PPV/RGO composites prepared by AC method originates in presence of reminiscent C![[double bond, length as m-dash]](https://www.rsc.org/images/entities/char_e001.gif) O bonds in RGO sheets. The significant increase in absorbance of the IR band situated in the spectral range 1650–1750 cm−1, observed in the case of the sample prepared by electrochemical method and successively interacted with the 1 M NH4OH solution originates both in (i) the appearance of new C
O bonds in RGO sheets. The significant increase in absorbance of the IR band situated in the spectral range 1650–1750 cm−1, observed in the case of the sample prepared by electrochemical method and successively interacted with the 1 M NH4OH solution originates both in (i) the appearance of new C![[double bond, length as m-dash]](https://www.rsc.org/images/entities/char_e001.gif) O bonds in RGO sheets resulted during the oxidation reactions in the potential range (−2; +2) V versus the Ag/AgCl electrode, when Au electrodes were immersed in the solutions of 0.02 M TBPX and 0.1 M TBAB with different weight percentage concentrations of RGO in the solvent mixture of DMF and H2O, having the volumetric ratio of 98
O bonds in RGO sheets resulted during the oxidation reactions in the potential range (−2; +2) V versus the Ag/AgCl electrode, when Au electrodes were immersed in the solutions of 0.02 M TBPX and 0.1 M TBAB with different weight percentage concentrations of RGO in the solvent mixture of DMF and H2O, having the volumetric ratio of 98![[thin space (1/6-em)]](https://www.rsc.org/images/entities/char_2009.gif) :
:![[thin space (1/6-em)]](https://www.rsc.org/images/entities/char_2009.gif) 2 and (ii) the formation of new C
2 and (ii) the formation of new C![[double bond, length as m-dash]](https://www.rsc.org/images/entities/char_e001.gif) O bonds on PPV MCs.
O bonds on PPV MCs.
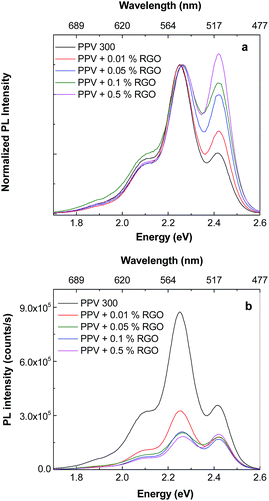
Additional proofs concerning the presence of PPV MCs and DSB on the Au electrode surface, depending on the synthesis method used for the preparation of the PPV/RGO composites, are shown in Fig. 7–9. The black curve in Fig. 7 shows the PL spectrum of PPV in un-doped state, obtained by the AC of the PPV PS at the conversion temperature of 300 °C, which is characterized by a complex band with the maximum at ∼2.25 eV.
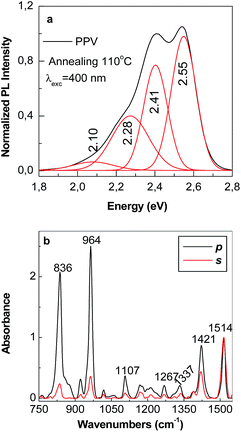 | ||
| Fig. 9 The PL spectrum of the sample obtained by AC of the PPV PS at 110 °C (a) and its p and s polarized IR spectrum (black and red curves in (b)). | ||
According to Fig. 8a, the de-convolution of the PL spectrum of the PPV film in un-doped state reveals four emission bands peaked at 2.42, 2.25, 2.1, and 1.96 eV. The first two PL bands with maxima at 2.42 and 2.25 eV were assigned to the electronic emission transitions of MCs that have lengths of 5 and 7–10 RUs, respectively, whereas the last two PL bands peaking at 2.1 and 1.96 eV correspond to the vibronic replica of the first and second order, respectively, of the PL band with a maximum at 2.42 eV.22 In this work, MCs that have lengths of 5 and 7–10 RUs correspond the PPV backbone segments with conjugation length corresponding to the molecular structures (–C6H4–CH![[double bond, length as m-dash]](https://www.rsc.org/images/entities/char_e001.gif) CH–)5 and (–C6H4–CH
CH–)5 and (–C6H4–CH![[double bond, length as m-dash]](https://www.rsc.org/images/entities/char_e001.gif) CH–)7, respectively.
CH–)7, respectively.
Fig. 1S† highlights both a change in the shape of the PPV PL spectrum and a decrease in its intensity as the RGO weight percentage concentration in the composite mass increases. A similar effect of PPV PL quenching was reported in the case of PPV/SWCNT composites synthetized by the AC of the PPV PS with different SWCNT weight percentage concentrations.23
According to Fig. 1S,† the changes in the profile of the PPV PL spectrum are marked in the presence of RGO, when the values of the ratio between the relative intensities of the two emission bands peaked at 2.25 and 2.42 eV (I2.25/I2.42) vary from 2.4 (Fig. 1S(a)†) to 1.25 (Fig. 1S(b)†) and 0.95 (Fig. 1S(c)†). The increase in the relative intensity of the PL band at 2.42 eV with respect to the PL band with maximum at 2.25 eV (Fig. 1S†) is assigned to the increase of the short and isolated segments of PPV with the length of 5 RU in the presence of RGO. This assignment was make taking into account ref. 24, when a similar behavior of PL spectra of the composites obtained by AC of the PPV precursor solutions with different SWNTs weight percentage concentrations, was reported. For the electrochemical synthesized samples, a change of the I2.25/I2.42 ratio from 1.7 (Fig. 8c) to 1.15 (Fig. 8d) is reported in the presence of RGO. The difference between the values of the I2.25/I2.42 ratio in the case of the two methods, i.e. AC (0.95, Fig. 1S(c)†) and electrochemical way (1.15, Fig. 8d), can be a consequence of the reaction mechanisms of the two methods. In this context, it is worth mentioning that in comparison with AC method (Scheme 1S†), each reduction reaction shown in Scheme 2S,† leads to obtain of two reaction products from which only one allows further growth of PPV MCs.
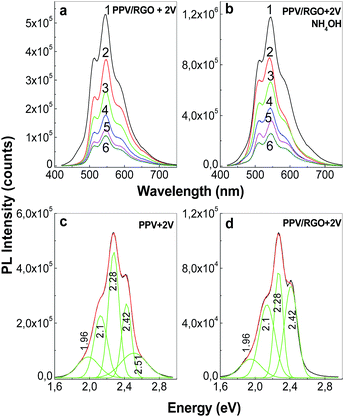
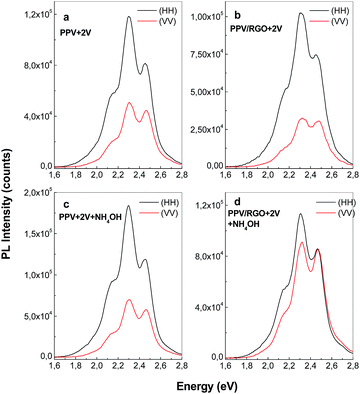
Depending on the synthesis method used to prepare the films of PPV in un-doped state, i.e. (i) AC method and (ii) the electrochemical way followed by a successively interaction with a 1 M NH4OH solution, the PL intensity varies from 900.000 counts (black curve in Fig. 7b) to 1.176.530 counts (curve 1 in Fig. 8b), respectively. According to the yearly studies reported by M. Anni et al.25 the generation of carbonyl groups on PPV MCs induces an enhancement of PPV PL. Taking into account this progress, a first conclusion is that the PPV film in un-doped state synthetized by AC method contains less C![[double bond, length as m-dash]](https://www.rsc.org/images/entities/char_e001.gif) O groups onto MCs in comparison with the electrochemical synthetized PPV sample and successively interacted with the 1 M NH4OH solution. This sentence is in good agreement with our results obtained by IR spectroscopy in polarized light (Fig. 4 and 6). According to Fig. 8a and c, the PL spectrum of the sample synthesized by the electrochemical method, when CVs were stopped at the potential of +2 V versus Ag/AgCl, shows that in the spectral range of 420–775 nm (2.95–1.6 eV), five emission bands peaked at 1.96, 2.1, 2.28, 2.42, and 2.51 eV. Thus far, a PL band around 2.51 eV was reported both in the case of the PPV MCs synthesized by the AC of PPV PS at the conversion temperature of 120 °C (ref. 23) and in DSB.23,26 As demonstrated by A. Sreeram et al., a low conversion takes place in the case of PPV PS AC at the temperature of 110 °C.27 According to Fig. 9a, the PL spectrum of PPV synthesized by the AC method at temperature of 110 °C shows four emission bands peaked at 2.55, 2.41, 2.28, and 2.1 eV, the most intense emission band being that situated in the 2.45–2.8 eV spectral range, which is assigned to the PPV MCs with the length of 4 RUs.23,24
O groups onto MCs in comparison with the electrochemical synthetized PPV sample and successively interacted with the 1 M NH4OH solution. This sentence is in good agreement with our results obtained by IR spectroscopy in polarized light (Fig. 4 and 6). According to Fig. 8a and c, the PL spectrum of the sample synthesized by the electrochemical method, when CVs were stopped at the potential of +2 V versus Ag/AgCl, shows that in the spectral range of 420–775 nm (2.95–1.6 eV), five emission bands peaked at 1.96, 2.1, 2.28, 2.42, and 2.51 eV. Thus far, a PL band around 2.51 eV was reported both in the case of the PPV MCs synthesized by the AC of PPV PS at the conversion temperature of 120 °C (ref. 23) and in DSB.23,26 As demonstrated by A. Sreeram et al., a low conversion takes place in the case of PPV PS AC at the temperature of 110 °C.27 According to Fig. 9a, the PL spectrum of PPV synthesized by the AC method at temperature of 110 °C shows four emission bands peaked at 2.55, 2.41, 2.28, and 2.1 eV, the most intense emission band being that situated in the 2.45–2.8 eV spectral range, which is assigned to the PPV MCs with the length of 4 RUs.23,24
Fig. 9b reveals that the p and s polarized IR spectra of the sample obtained by the AC of the PPV PS at the conversion temperature of 110 °C show all IR absorption bands reported in the case of the PPV films prepared by the same method at the temperature of 300 °C (black curves in Fig. 4a and b). Fig. 9b reveals that the p and s polarized IR spectra of the sample obtained by the AC of the PPV PS at the conversion temperature of 110 °C show all IR absorption bands reported in the case of the PPV films prepared by the same method at the temperature of 300 °C (black curves in Fig. 4a and b). Considering that the p and s polarized IR spectra of the PPV film, prepared at the conversion temperatures of 110 °C and 300 °C, do not show IR bands peaked at 885–877, 1025–1032, 1068, 1105–1109, 1149, 1180, 1380–1394, and 1466–1485 cm−1, and they are observed only in the case of DSB, we assign these IR bands to the substituted DSB that results during the PPV electrochemical synthesis in the presence of RGO (Scheme 2S†). As observed in Fig. 8b, the successive interaction of the sample, synthetized by electrochemical method and in the absence of RGO, with the 1 M NH4OH solution does not induce a change in the profile of the emission band situated in the 420–775 nm spectral range. The de-doping process of the macromolecular compound in the presence of the 1 M NH4OH solution is evidenced by the increase in the intensity of the PL spectrum from 529.472 counts (curve 1, Fig. 8a) to 1.179.410 counts (curve 1, Fig. 8b) when the MCs of PPV in un-doped state are deposited on the Au electrode surface. These changes show that two compounds are synthesized by the electrochemical polymerization of TBPX onto an Au electrode when CVs were stopped at the potential of +2 V versus Ag/AgCl: a PPV in doped state and DBS. A change in the profile of the PL spectra of the samples obtained by electrochemical polymerization of TBPX in the presence of RGO is remarked by the existence of only four emission bands peaked at 1.96, 2.1, 2.28, and 2.42 eV (Fig. 8d). The disappearance of the emission band with the maximum at 2.51 eV in the case of the composites based on PPV in doped state and different RGO weight percentage concentration is in good accordance with the IR studies presented above, which indicates that an inhibition of the DSB formation onto the Au electrode surface occurs.
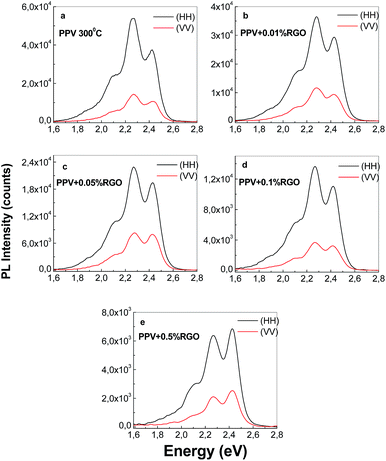
Using anisotropic PL measurements in the following, an estimation of the wrapping angle of RGO sheets with PPV MCs is shown. Using vertical (V) and horizontal (H) polarization PL excitation beams, the PL intensity in the V and H polarization geometry was measured in this order. A dependence of the polarization of the PL spectra both in the case of PPV and its composites with RGO, synthesized by AC of the PPV PS and electrochemical polymerization of TBPX, is highlighted in Fig. 10 and 11. The previously studies reported by I. Orion et al. have demonstrated that PPV PS AC method allows the obtaining of the oriented polymer films.19 A significant role in the obtaining the oriented polymer films was reported to be played of the PPV inter-chain interactions.28 At present, it is known that the PPV PS AC involves a liquid crystalline phase that induces alignment predominantly along the rubbing director.29 This fact induces as the PPV PL intensity measured with the excitation and emission polarizers mounted horizontal in spectrophotometer (IHH) to be higher than those of light intensity measured with excitation and emission polarizers mounted vertically (IVV).28,29
Fig. 10a confirms this behavior for the films prepared by PPV PS AC. The anisotropy (r) and the polarization (P) were calculated according to the eqn (1) and (2):13
| r = (IVV − GIVH)/(IVV + 2GIVH) | (1) |
| P = 3r/(2 + r) | (2) |
For single-phonon excitation, the angle of the binding (θPL) of PPV onto RGO sheet surfaces was calculated according to eqn (3):
r = 0.4[(3![[thin space (1/6-em)]](https://www.rsc.org/images/entities/char_2009.gif) cos2 cos2![[thin space (1/6-em)]](https://www.rsc.org/images/entities/char_2009.gif) θPL − 1)/2] θPL − 1)/2]
| (3) |
This equation indicates that the r values can be equal with −0.2 and +0.4, when the θPL angle may vary from 90° to 0°.
In samples prepared by the AC of the PPV PS, one observes that the r values are easily different of 0.4. When the r value is 0.4 the excitation and emission transition dipoles are aligned, namely parallel to the basal plane of RGO.
A decrease from 0.373 to 0.238, as increasing the RGO weight percentage concentration in the composite mass is reported. A smaller value for r, equal with 0.207, is reported in the case of the PPV electrochemical synthesized in the presence of RGO, according to Table 2. This experimental fact leads to an angle between the molecule's absorption and emission dipoles equal with 34°, which indicates that the PPV excitation dipole is not parallel to the basal plane of RGO. Considering the PL band peaked at 2.41 eV, the values of the r and θPL parameters are summarized for the PPV and its composites with RGO, synthesized by the two methods, in Table 2. The θPL values vary when the RGO weight percentage concentration is changed from 0 to 0.5 wt% in the composite mass from: (i) 12° to 31°, in the RGO sheets non-covalently functionalized with PPV in un-doped state; and (ii) 28° to 34°, in the RGO sheets covalently functionalized with PPV in doped state. Regardless of the synthesis route, the θPL values of the composites based on PPV in un-doped or doped state and RGO with a weight percentage concentration of 0.5 wt% are close. The growth of the θPL value as the RGO weight percentage concentration increases in the composite mass is the result of the π–π* interactions between the phenyl groups of PPV and the RGO sheets and the non-planarity of PPV MCs.21 In comparison with composites synthesized by AC of PPV PS in the presence of RGO, the higher values of θPL are reported in the electrochemical synthesized samples as a consequence of the co-generation of PPV in doped state and DSB when additional π–π* interactions between the phenyl groups of DSB and the RGO sheets are invoked.
| Sample | IHH (counts) | IVV (counts) | r | θPL (degree) |
|---|---|---|---|---|
| AC method of PPV PS | ||||
| PPV | 54.100 | 14.755 | 0.373 | 12° |
| PPV + 0.01 wt% RGO | 35.200 | 12.100 | 0.369 | 13° |
| PPV + 0.05 wt% RGO | 23.200 | 9.320 | 0.320 | 21° |
| PPV + 0.1 wt% RGO | 11.922 | 3.322 | 0.299 | 23° |
| PPV + 0.5 wt% RGO | 7.422 | 2.472 | 0.238 | 31° |
![[thin space (1/6-em)]](https://www.rsc.org/images/entities/char_2009.gif) |
||||
| Electrochemical polymerization of TBPX, 30 CVs | ||||
| PPV | 83.100 | 45.600 | 0.268 | 28° |
| PPV/RGO 0.1 wt% | 75.800 | 31.800 | 0.207 | 34° |
| PPV + 1 M NH4OH | 120.000 | 59.300 | 0.261 | 29° |
| PPV/RGO 0.1 wt% + 1 M NH4OH | 87.102 | 86.522 | 0.217 | 33° |
Concerning the adsorption of the films of PPV/RGO composite, with the same RGO weight percentage concentration on the Au electrode surface, different values of the orientation angle of the transition dipole moment vector for the four IR absorption bands at ∼837, 963, 1423, and 1514 cm−1 are reported as depending on the synthesis methods of these materials. Thus, in the case of the sample of RGO/PPV in un-doped state obtained by the chemical interaction of the NH4OH solution with the composite based on PPV in doped state and 0.1 wt% RGO, prepared by electrochemical route, the calculated values of the orientation angle of the transition dipole moment vector for the four IR absorption bands at ∼837, 963, 1423, and 1514 cm−1 are equal with 63°, 49°, 33° and 42°, respectively. Significant differences for these values are remarked versus those reported for the composites based on PPV in un-doped state and RGO prepared by the AC method (Table 1). The higher difference is noted for the orientation angle of the transition dipole moment vector of the IR absorption band, assigned to the vibrational mode of trans-vinylene C–H out-of-plane bending,18,19 with a maximum at ∼963 cm−1, when RGO sheets were covalently functionalized with PPV in un-doped state. These differences indicate a preferential orientation on the Au support as a consequence of the chemical adsorption of PPV in un-doped state onto the RGO sheet surface.
4. Conclusions
This paper reported new results concerning the influence of RGO on the optical properties of PPV in doped or un-doped state. Using surface enhanced Raman scattering, FTIR spectroscopy in the grazing angle incident reflection geometry and photoluminescence, it is demonstrated that:(i) The AC of the PPV PS with different RGO weight percentage concentrations results in the composites based on PPV in un-doped state and RGO as demonstrated by the SERS studies and FTIR spectroscopy in the grazing angle incident reflection geometry; a PPV PL quenching effect is reported in the presence of RGO. The polarized PL measurements indicate that wrapping angle of RGO sheets with PPV MCs (θPL), via the π–π* interactions between the phenyl groups of PPV in un-doped state and the RGO sheets, varies from 12° to 31° when the RGO weight percentage concentration is changed from 0 to 0.5 wt%, respectively;
(ii) Two reaction products, i.e., a PPV in doped state and DSB, were evidenced by FTIR spectroscopy to result when the electrochemical polymerization of TBPX onto an Au electrode was performed by cyclic voltammetry and a stopping of CVs at the potential of +2 V versus Ag/AgCl was carried out;
(iii) Using correlated studies of PL and IR spectroscopy, a decrease in the DSB weight in favor of the PPV in doped state was demonstrated to occur as the RGO weight percentage concentration increased in the electrochemical synthesis solution; the increase in the absorbance of the IR band with a maximum at 1417 cm−1, assigned to the phenyl ring C![[double bond, length as m-dash]](https://www.rsc.org/images/entities/char_e001.gif) C in-plane bending vibrational mode, in the composite based on PPV in doped state and 0.5 wt% RGO, electrochemically synthetized and successively interacted with the 1 M NH4OH solution, indicates that a hindrance steric effect is induced by the covalent functionalization of the RGO sheets with PPV MCs. The polarized PL measurements demonstrated that the wrapping angle of RGO sheets with PPV MCs (θPL) varies from 28° to 34° when the RGO weight percentage concentration is changed from 0 to 0.5 wt%, respectively.
C in-plane bending vibrational mode, in the composite based on PPV in doped state and 0.5 wt% RGO, electrochemically synthetized and successively interacted with the 1 M NH4OH solution, indicates that a hindrance steric effect is induced by the covalent functionalization of the RGO sheets with PPV MCs. The polarized PL measurements demonstrated that the wrapping angle of RGO sheets with PPV MCs (θPL) varies from 28° to 34° when the RGO weight percentage concentration is changed from 0 to 0.5 wt%, respectively.
(iv) The different values of the orientation angle of the transition dipole moment vector for the IR absorption bands peaked at 833, 964, 1415 and 1514 cm−1, in composites of the type RGO non-covalently functionalized with PPV in un-doped state and RGO covalently functionalized with PPV in doped state, deposited onto Au supports, were reported.
Acknowledgements
This work was funded by the Romanian National Authority for Scientific Research, CNCS-UEFISCDI, Module III Bilateral Cooperation, Humbert Curien-Brancusi project, no. 1027/26.06.2014 and Core Program 2016–2017, project PN16-480101.References
- B. H. Wee and J. D. Hong, Adv. Funct. Mater., 2013, 23, 4657–4666 CrossRef CAS.
- B. H. Wee and J. D. Hong, Langmuir, 2014, 30, 5267–5275 CrossRef CAS PubMed.
- R. Ou, R. A. Gerhardt and R. J. Samuels, J. Polym. Sci., Part B: Polym. Phys., 2004, 42, 98–116 CrossRef CAS.
- L. O. Peres, H. Varela, J. R. Garcia, M. R. Fernandes, R. M. Toresi, F. C. Nart and J. Gruber, Synth. Met., 2001, 118, 65–70 CrossRef CAS.
- M. Baibarac, I. Baltog, M. Ilie, B. Humbert, S. Lefrant and C. Negrila, J. Phys. Chem. C, 2016, 120, 5694–5705 CAS.
- H. Ago, K. Petritsch, M. S. P. Shaffer, A. H. Windle and R. H. Friend, Adv. Mater., 1999, 11, 1281–1285 CrossRef CAS.
- M. R. Fernandes, J. R. Garcia, M. S. Schultz and F. C. Nart, Thin Solid Films, 2005, 474, 279–284 CrossRef CAS.
- M. Baitoul, J. Wery, J. P. Buisson, G. Arbackle, H. Shah, S. Lefrant and M. Hamdoume, Polymer, 2000, 41, 6955–6964 CrossRef CAS.
- A. G. Grimsdale and A. B. Holmes, in Conjugated Polymers – Theory, Synthesis, Properties and Characterization, Handbook of Conducting Polymers, ed. T. A. Skotheim and J. R. Reynolds, CRC Press, New York, 2006, vol. 2 Search PubMed.
- I. Smaranda, A. M. Benito, W. K. Maser, I. Baltog and M. Baibarac, J. Phys. Chem. C, 2014, 118, 25704–25717 CAS.
- D. Comoretto, C. Soci, F. Marabelli, A. Mikhailovsky and D. Moses, Synth. Met., 2005, 153, 281–284 CrossRef CAS.
- P. A. Filho, A. Marletta, L. Akcelrud Jr and O. N. Oliveira, Chem. Phys. Lett., 2014, 605–606, 147–151 CrossRef.
- M. J. Shea, R. D. Mehlenbacher, M. T. Zanni and M. S. Arnold, J. Phys. Chem. Lett., 2014, 5, 3742–3749 CrossRef CAS PubMed.
- D. C. Marcano, D. V. Kosynkin, J. M. Berlin, A. Sinitskii, Z. Sun, A. Slesarev, L. B. Alemany, W. Lu and J. M. Tour, ACS Nano, 2010, 4, 4806–4816 CrossRef CAS PubMed.
- S. Eigher, C. Dotzer and A. Hirsch, Carbon, 2012, 50, 3666–3673 CrossRef.
- J. D. Stenger-Smith, P. W. Lenz and G. Wegner, Polymer, 1989, 30, 1048–1053 CrossRef CAS.
- E. Mulazzi, A. Ripamonti, J. Wery, B. Dulieu and S. Lefrant, Phys. Rev. B: Condens. Matter Mater. Phys., 1999, 60, 16519–16525 CrossRef CAS.
- D. D. C. Bradley, R. H. Friend, H. Lindenberger and S. Roth, Polymer, 1986, 27, 1709–1713 CrossRef CAS.
- I. Orion, J. P. Buisson and S. Lefrant, Phys. Rev. B: Condens. Matter Mater. Phys., 1998, 57, 7050–7065 CrossRef CAS.
- M. Baibarac, I. Baltog, J. Wery, S. Lefrant and J. Y. Mevellec, J. Phys. Chem. C, 2012, 116, 25337–25345 Search PubMed.
- R. I. Venkatanarayanan, S. Krishnan, A. Sreeram, P. A. Yuya, N. G. Patel, A. Tandia and J. B. McLaughlin, Macromol. Theory Simul., 2016, 25, 238–253 CrossRef CAS.
- P. Damlin, C. Kvarnstrom and A. Ivaska, Electrochim. Acta, 1999, 44, 4087–4097 CrossRef CAS.
- J. Wery, H. Aarab, S. Lefrant, E. Faulques, E. Mulazzi and R. Perego, Phys. Rev. B: Condens. Matter Mater. Phys., 2003, 67, 115202 CrossRef.
- F. Massuyeau, H. Aarab, L. Mihut, S. Lefrant, E. Faulques, J. Wery, E. Mulazzi and R. Perego, J. Phys. Chem. C, 2007, 111, 15111–15118 CAS.
- M. Anni, G. Gigli, R. Cingolani, Y. G. Gobato, A. Vercik, A. Marletta, F. G. E. Guimaras and R. M. Faria, Phys. Rev. B: Condens. Matter Mater. Phys., 2003, 68, 035215 CrossRef.
- N. F. Colaneri, D. D. C. Bradley, R. H. Friend, P. L. Burn, A. B. Holmes and C. W. Spangler, Phys. Rev. B: Condens. Matter Mater. Phys., 1990, 42, 11670–11681 CrossRef CAS.
- A. Sreeram, N. G. Patel, R. I. Venkatanarayanan, S. J. DeLuca, P. A. Yuya and S. Krishnan, Polym. Test., 2014, 37, 170–178 CrossRef CAS.
- D. Comoretto, C. Soci, F. Marabelli, A. Mikhailovsky and D. Mores, Synth. Met., 2005, 153, 281–284 CrossRef CAS.
- Y. H. Yao, S. H. Yang and C. S. Hsu, Polymer, 2006, 47, 8297–8308 CrossRef CAS.
Footnote |
| † Electronic supplementary information (ESI) available. See DOI: 10.1039/c6ra26445j |
| This journal is © The Royal Society of Chemistry 2017 |

